

The DOI matches its Crossref record; 34 of the 34 references it cites were found in a registry or an index.
Schizophrenia-associated NRXN1 deletions induce developmental-timing- and cell-type-specific vulnerabilities in human brain organoids
Abstract
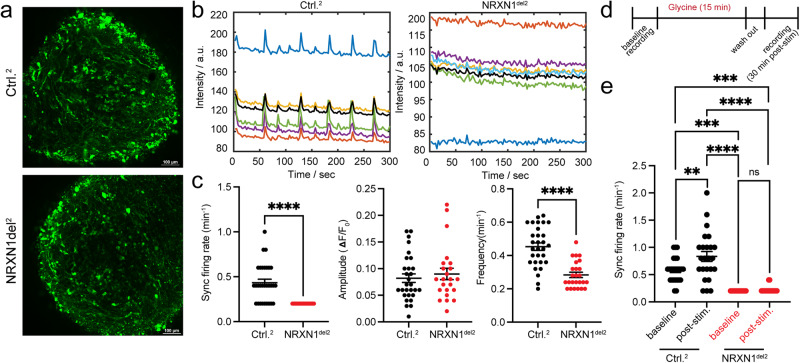
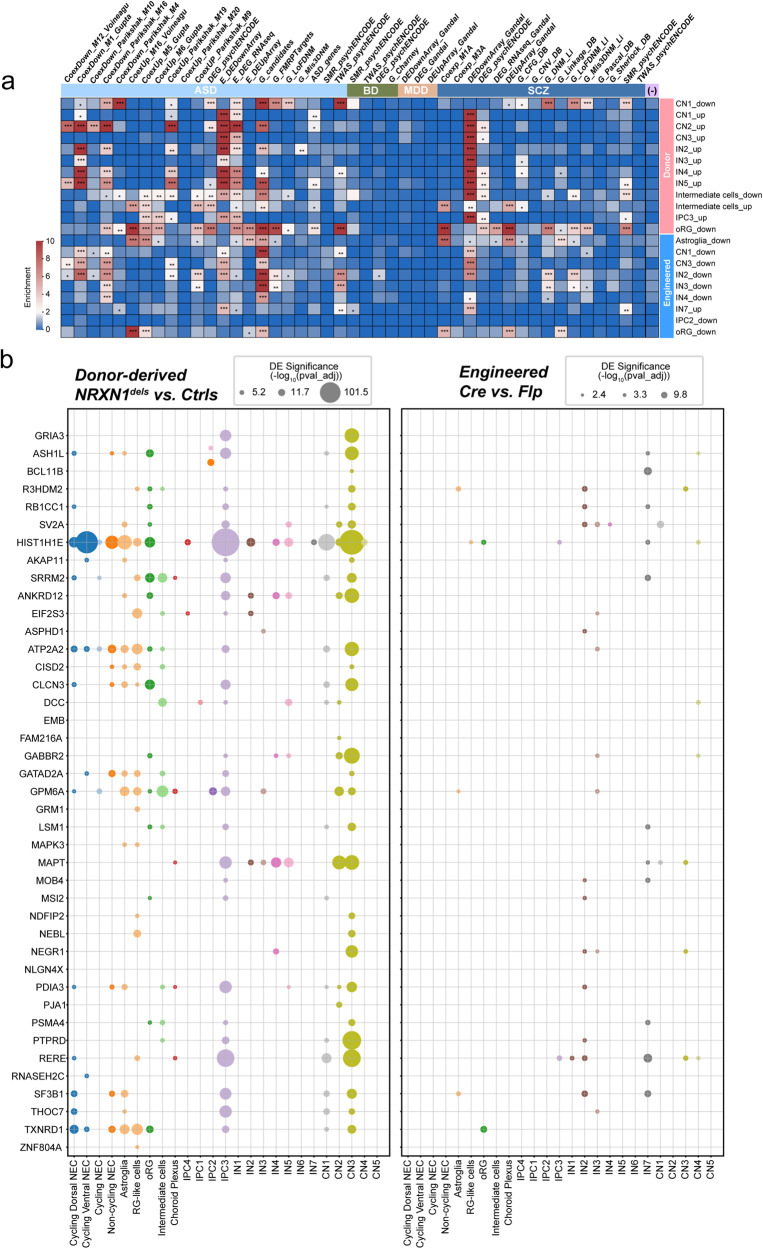
De novo mutations and copy number deletions in NRXN1 (2p16.3) pose a significant risk for schizophrenia (SCZ). It is unclear how NRXN1 deletions impact cortical development in a cell type-specific manner and disease background modulates these phenotypes. Here, we leveraged human pluripotent stem cell-derived forebrain organoid models carrying NRXN1 heterozygous deletions in isogenic and SCZ patient genetic backgrounds and conducted single-cell transcriptomic analysis over the course of brain organoid development from 3 weeks to 3.5 months. Intriguingly, while both deletions similarly impacted molecular pathways associated with ubiquitin-proteasome system, alternative splicing, and synaptic signaling in maturing glutamatergic and GABAergic neurons, SCZ- NRXN1 deletions specifically perturbed developmental trajectories of early neural progenitors and accumulated disease-specific transcriptomic signatures. Using calcium imaging, we found that both deletions led to long-lasting changes in spontaneous and synchronous neuronal networks, implicating synaptic dysfunction. Our study reveals developmental-timing- and cell-type-dependent actions of NRXN1 deletions in unique genetic contexts.
Overview
The claims and statistics of this paper haven’t been checked yet.
Run the check — free, no account needed. It reads the open-access text and checks the sources it cites.
Integrity signals
Registry
Cites
Statistics
Figures
Verification
Claims the paper makes
The claims and statistics of this paper haven’t been checked yet.
Run the check — free, no account needed. It reads the open-access text and checks the sources it cites.
Claims other papers make about this one
Each is checked against this paper’s own text: does it say what the citing paper says it does?
In the citing paper
“No statistical power estimation analyses were used to predetermine sample sizes, where were chosen to match previous publications14,21 and field standards.”
From Phenotypic complexities of rare heterozygous neurexin-1 deletions (2025) · cites this paper as [14]
In the citing paper
“Taken together, these results reinforce the hypothesis that perturbations in NRXN1 splicing converge on synaptic function14,36.”
From Phenotypic complexities of rare heterozygous neurexin-1 deletions (2025) · cites this paper as [14]
Self-check
Percentages, sums and reported differences re-computed from the paper’s own numbers.
The self-check needs the paper’s full text.
Citations
Cites
Cerebral organoids model human brain development and microcephaly
Lancaster, M. A., Renner, M., Martin, C.-A., Wenzel, D., Bicknell, L. S., Hurles, M. E., Homfray, T., Penninger, J. M., Jackson, A. P., & Knoblich, J. A. (2013) · Nature · doi:10.1038/nature12517 · Cited by 5,372
The single-cell transcriptional landscape of mammalian organogenesis
Cao, J., Spielmann, M., Qiu, X., Huang, X., Ibrahim, D. M., Hill, A. J., Zhang, F., Mundlos, S., Christiansen, L., Steemers, F. J., et al. (2019) · Nature · doi:10.1038/s41586-019-0969-x · Cited by 4,490
Mapping genomic loci implicates genes and synaptic biology in schizophrenia
Trubetskoy, V., Pardiñas, A. F., Qi, T., Panagiotaropoulou, G., Awasthi, S., Bigdeli, T. B., Bryois, J., Chen, C.-Y., Dennison, C. A., Hall, L. S., et al. (2022) · Nature · doi:10.1038/s41586-022-04434-5 · Cited by 2,964
Howard, D. M., Adams, M. J., Clarke, T.-K., Hafferty, J. D., Gibson, J., Shirali, M., Coleman, J. R. I., Hagenaars, S. P., Ward, J., Wigmore, E. M., et al. (2019) · Nature Neuroscience · doi:10.1038/s41593-018-0326-7 · Cited by 2,565
Brain-Region-Specific Organoids Using Mini-bioreactors for Modeling ZIKV Exposure
Qian, X., Nguyen, H. N., Song, M. M., Hadiono, C., Ogden, S. C., Hammack, C., Yao, B., Hamersky, G. R., Jacob, F., Zhong, C., et al. (2016) · Cell · doi:10.1016/j.cell.2016.04.032 · Cited by 2,127
Functional cortical neurons and astrocytes from human pluripotent stem cells in 3D culture
Paşca, A. M., Sloan, S. A., Clarke, L. E., Tian, Y., Makinson, C. D., Huber, N., Kim, C. H., Park, J.-Y., O'Rourke, N. A., Nguyen, K. D., et al. (2015) · Nature Methods · doi:10.1038/nmeth.3415 · Cited by 1,609
Genome-wide association study identifies 30 loci associated with bipolar disorder
eQTLGen Consortium, Stahl, E. A., BIOS Consortium, the Bipolar Disorder Working Group of the Psychiatric Genomics Consortium, Breen, G., Forstner, A. J., McQuillin, A., Ripke, S., Trubetskoy, V., Mattheisen, M., et al. (2019) · Nature Genetics · doi:10.1038/s41588-019-0397-8 · Cited by 1,519
Transcriptome-wide isoform-level dysregulation in ASD, schizophrenia, and bipolar disorder
Gandal, M. J., Zhang, P., Hadjimichael, E., Walker, R. L., Chen, C., Liu, S., Won, H., van Bakel, H., Varghese, M., Wang, Y., et al. (2018) · Science · doi:10.1126/science.aat8127 · Cited by 1,247
Individual brain organoids reproducibly form cell diversity of the human cerebral cortex
Velasco, S., Kedaigle, A. J., Simmons, S. K., Nash, A., Rocha, M., Quadrato, G., Paulsen, B., Nguyen, L., Adiconis, X., Regev, A., et al. (2019) · Nature · doi:10.1038/s41586-019-1289-x · Cited by 1,094
Contribution of copy number variants to schizophrenia from a genome-wide study of 41,321 subjects
Marshall, C. R., Howrigan, D. P., Merico, D., Thiruvahindrapuram, B., Wu, W., Greer, D. S., Antaki, D., Shetty, A., Holmans, P. A., Pinto, D., et al. (2017) · Nature Genetics · doi:10.1038/ng.3725 · Cited by 1,058
Research works printed but not linked: 63
- Lowther, C. et al. Molecular characterization of NRXN1 deletions from 19,263 clinical microarray cases identifies exons important for neurodevelopmental disease expression. Genet Med. 19, 53–61 (2017). · DOI
- Fuccillo, M. V. & Pak, C. Copy number variants in neurexin genes: phenotypes and mechanisms. Curr. Opin. Genet. Dev. 68, 64–70 (2021). · DOI
- Sudhof, T. C. Synaptic neurexin complexes: a molecular code for the logic of neural circuits. Cell 171, 745–769 (2017). · DOI · Paper page
- Dai, J., Aoto, J. & Südhof, T. C. Alternative splicing of presynaptic neurexins differentially controls postsynaptic NMDA and AMPA receptor responses. Neuron 102, 993–1008.e5 (2019). · DOI
- Davatolhagh, M. F. & Fuccillo, M. V. Neurexin1α differentially regulates synaptic efficacy within striatal circuits. Cell Rep. 34, 108773 (2021). · DOI
- Chen, L. Y., Jiang, M., Zhang, B., Gokce, O. & Südhof, T. C. Conditional deletion of all neurexins defines diversity of essential synaptic organizer functions for neurexins. Neuron 94, 611–625.e4 (2017). · DOI
- Ullrich, B., Ushkaryov, Y. A. & Südhof, T. C. Cartography of neurexins: more than 1000 isoforms generated by alternative splicing and expressed in distinct subsets of neurons. Neuron 14, 497–507 (1995). · DOI
- Schreiner, D. et al. Targeted combinatorial alternative splicing generates brain region-specific repertoires of neurexins. Neuron 84, 386–398 (2014). · DOI
- Jenkins, A. K. et al. Neurexin 1 (NRXN1) splice isoform expression during human neocortical development and aging. Mol. Psychiatry 21, 701–706 (2016). · DOI
- Zeng, L. et al. Functional impacts of NRXN1 knockdown on neurodevelopment in stem cell models. PloS One 8, e59685 (2013). · DOI
- Lam, M. et al. Single cell analysis of autism patient with bi-allelic NRXN1-alpha deletion reveals skewed fate choice in neural progenitors and impaired neuronal functionality. Exp. Cell Res. 383, 111469 (2019). · DOI
- Willsey, H. R. et al. Parallel in vivo analysis of large-effect autism genes implicates cortical neurogenesis and estrogen in risk and resilience. Neuron 109, 788–804.e8 (2021). · DOI
- Xiang, Y. et al. Fusion of regionally specified hPSC-derived organoids models human brain development and interneuron migration. Cell Stem Cell 21, 383–398.e7 (2017). · DOI
- Sebastian, R., Song, Y. & Pak, C. Probing the molecular and cellular pathological mechanisms of schizophrenia using human induced pluripotent stem cell models. Schizophr. Res S0920-9964, 00263–00268 (2022).
- Gordon, A. et al. Long-term maturation of human cortical organoids matches key early postnatal transitions. Nat. Neurosci. 24, 331–342 (2021). · DOI
- Kathuria, A. et al. Transcriptomic landscape and functional characterization of induced pluripotent stem cell-derived cerebral organoids in schizophrenia. JAMA Psychiatry 77, 745–754 (2020). · DOI
- Pak, C. et al. Human neuropsychiatric disease modeling using conditional deletion reveals synaptic transmission defects caused by heterozygous mutations in NRXN1. Cell Stem Cell 17, 316–328 (2015). · DOI · Paper page
- Pak, C. et al. Cross-platform validation of neurotransmitter release impairments in schizophrenia patient-derived NRXN1-mutant neurons. Proc. Natl Acad. Sci. USA 118, e2025598118 (2021). · DOI · Paper page
- Tanaka, Y., Cakir, B., Xiang, Y., Sullivan, G. J. & Park, I.-H. Synthetic analyses of single-cell transcriptomes from multiple brain organoids and fetal brain. Cell Rep. 30, 1682–1689.e3 (2020). · DOI
- Zhong, S. et al. A single-cell RNA-seq survey of the developmental landscape of the human prefrontal cortex. Nature 555, 524–528 (2018). · DOI · Paper page
- Bhaduri, A. et al. An atlas of cortical arealization identifies dynamic molecular signatures. Nature 598, 200–204 (2021). · DOI
- Kanton, S. et al. Organoid single-cell genomic atlas uncovers human-specific features of brain development. Nature 574, 418–422 (2019). · DOI · Paper page
- Uzquiano, A. et al. Proper acquisition of cell class identity in organoids allows definition of fate specification programs of the human cerebral cortex. Cell. 185, 3770–3788.e27 (2022). · DOI
- Chen, J., Bardes, E. E., Aronow, B. J. & Jegga, A. G. ToppGene Suite for gene list enrichment analysis and candidate gene prioritization. Nucleic Acids Res. 37, W305–W311 (2009). · DOI · Paper page
- Charizanis, K. et al. Muscleblind-like 2-mediated alternative splicing in the developing brain and dysregulation in myotonic dystrophy. Neuron 75, 437–450 (2012). · DOI
- Li, Q. et al. The splicing regulator PTBP2 controls a program of embryonic splicing required for neuronal maturation. Elife 3, e01201 (2014). · DOI · Paper page
- Lukacsovich, D. et al. Single-cell RNA-seq reveals developmental origins and ontogenetic stability of neurexin alternative splicing profiles. Cell Rep. 27, 3752–3759.e4 (2019). · DOI
- Love, M. I., Huber, W. & Anders, S. Moderated estimation of fold change and dispersion for RNA-seq data with DESeq2. Genome Biol. 15, 550 (2014). · DOI · Paper page
- Koopmans, F. et al. SynGO: an evidence-based, expert-curated knowledge base for the synapse. Neuron 103, 217–234.e4 (2019). · DOI · Paper page
- Vaquero-Garcia, J. et al. A new view of transcriptome complexity and regulation through the lens of local splicing variations. eLife 5, e11752 (2016). · DOI · Paper page
- Shemesh, O. A. et al. Precision calcium imaging of dense neural populations via a cell-body-targeted calcium indicator. Neuron 107, 470–486.e11 (2020). · DOI
- Watanabe, A. et al. Fabp7 maps to a quantitative trait locus for a schizophrenia endophenotype. PLoS Biol. 5, e297 (2007). · DOI
- Maekawa, M. et al. Polymorphism screening of brain-expressed FABP7, 5 and 3 genes and association studies in autism and schizophrenia in Japanese subjects. J. Hum. Genet. 55, 127–130 (2010). · DOI
- Koga, M. et al. Plasma fatty acid-binding protein 7 concentration correlates with depression/anxiety, cognition, and positive symptom in patients with schizophrenia. J. Psychiatr. Res. 144, 304–311 (2021). · DOI
- Hu, C., Chen, W., Myers, S. J., Yuan, H. & Traynelis, S. F. Human GRIN2B variants in neurodevelopmental disorders. J. Pharmacol. Sci. 132, 115–121 (2016). · DOI
- Takasaki, Y. et al. Mutation screening of GRIN2B in schizophrenia and autism spectrum disorder in a Japanese population. Sci. Rep. 6, 33311 (2016). · DOI
- Coyle, J. T. NMDA receptor and schizophrenia: a brief history. Schizophr. Bull. 38, 920–926 (2012). · DOI
- Nakazawa, K. & Sapkota, K. The origin of NMDA receptor hypofunction in schizophrenia. Pharm. Ther. 205, 107426 (2020). · DOI
- Shimamoto, C. et al. Functional characterization of FABP3, 5 and 7 gene variants identified in schizophrenia and autism spectrum disorder and mouse behavioral studies. Hum. Mol. Genet. 23, 6495–6511 (2014). · DOI
- Lu, W. et al. Activation of synaptic NMDA receptors induces membrane insertion of new AMPA receptors and LTP in cultured hippocampal neurons. Neuron 29, 243–254 (2001). · DOI
- Wang, L. et al. Analyses of the autism-associated neuroligin-3 R451C mutation in human neurons reveal a gain-of-function synaptic mechanism. Mol. Psychiatry https://doi.org/10.1038/s41380-022-01834-x (2022). · DOI
- Yu, Y. et al. Rare loss of function mutations in N-methyl-D-aspartate glutamate receptors and their contributions to schizophrenia susceptibility. Transl. Psychiatry 8, 1–9 (2018). · DOI
- Yeo, G., Holste, D., Kreiman, G. & Burge, C. B. Variation in alternative splicing across human tissues. Genome Biol. 5, R74 (2004). · DOI · Paper page
- Raj, B. & Blencowe, B. J. Alternative splicing in the mammalian nervous system: recent insights into mechanisms and functional roles. Neuron 87, 14–27 (2015). · DOI · Paper page
- Tan, W. et al. Molecular cloning of a brain-specific, developmentally regulated neuregulin 1 (NRG1) isoform and identification of a functional promoter variant associated with schizophrenia. J. Biol. Chem. 282, 24343–24351 (2007). · DOI
- Law, A. J., Kleinman, J. E., Weinberger, D. R. & Weickert, C. S. Disease-associated intronic variants in the ErbB4 gene are related to altered ErbB4 splice-variant expression in the brain in schizophrenia. Hum. Mol. Genet. 16, 129–141 (2007). · DOI
- Sartorius, L. J. et al. Expression of a GRM3 splice variant is increased in the dorsolateral prefrontal cortex of individuals carrying a schizophrenia risk SNP. Neuropsychopharmacology 33, 2626–2634 (2008). · DOI
- Flaherty, E. et al. Neuronal impact of patient-specific aberrant NRXN1α splicing. Nat. Genet. 51, 1679–1690 (2019). · DOI · Paper page
- Luza, S. et al. The ubiquitin proteasome system and schizophrenia. Lancet Psychiatry 7, 528–537 (2020). · DOI
- Nishimura, A. et al. The carbohydrate deposits detected by histochemical methods in the molecular layer of the dentate gyrus in the hippocampal formation of patients with schizophrenia, Down’s syndrome and dementia, and aged person. Glycoconj. J. 17, 815–822 (2000). · DOI
- Altar, C. A. et al. Deficient hippocampal neuron expression of proteasome, ubiquitin, and mitochondrial genes in multiple schizophrenia cohorts. Biol. Psychiatry 58, 85–96 (2005). · DOI · Paper page
- Rubio, M. D., Wood, K., Haroutunian, V. & Meador-Woodruff, J. H. Dysfunction of the ubiquitin proteasome and ubiquitin-like systems in schizophrenia. Neuropsychopharmacology 38, 1910–1920 (2013). · DOI
- Bousman, C. A. et al. Elevated ubiquitinated proteins in brain and blood of individuals with schizophrenia. Sci. Rep. 9, 2307 (2019). · DOI
- Tai, H.-C., Besche, H., Goldberg, A. L. & Schuman, E. M. Characterization of the brain 26S proteasome and its interacting proteins. Front. Mol. Neurosci. 3, 12 (2010).
- Ferreira, J. S. et al. GluN2B-containing NMDA receptors regulate AMPA receptor traffic through anchoring of the synaptic proteasome. J. Neurosci. 35, 8462–8479 (2015). · DOI · Paper page
- Huo, Y. et al. The deubiquitinating enzyme USP46 regulates AMPA receptor ubiquitination and trafficking. J. Neurochem. 134, 1067–1080 (2015). · DOI
- Fu, A. K. Y. et al. APCCdh1 mediates EphA4-dependent downregulation of AMPA receptors in homeostatic plasticity. Nat. Neurosci. 14, 181–189 (2011). · DOI
- Weinberger, D. R. Future of days past: neurodevelopment and schizophrenia. Schizophr. Bull. 43, 1164–1168 (2017). · DOI
- Raedler, T. J., Knable, M. B. & Weinberger, D. R. Schizophrenia as a developmental disorder of the cerebral cortex. Curr. Opin. Neurobiol. 8, 157–161 (1998). · DOI
- Garrido-Martín, D., Palumbo, E., Guigó, R. & Breschi, A. ggsashimi: Sashimi plot revised for browser- and annotation-independent splicing visualization. PLOS Comput. Biol. 14, e1006360 (2018). · DOI
- Wolf, F. A., Angerer, P. & Theis, F. J. SCANPY: large-scale single-cell gene expression data analysis. Genome Biol. 19, 15 https://doi.org/10.1186/s13059-017-1382-0 (2018). · DOI · Paper page
- Jin, K. et al. An interactive single cell web portal identifies gene and cell networks in COVID-19 host responses. iScience 24, 103115 https://doi.org/10.1016/j.isci.2021.103115 (2021). · DOI
- Kaimal, V. et al. ToppCluster: a multiple gene list feature analyzer for comparative enrichment clustering and network-based dissection of biological systems. Nucleic Acids Res. 38, W96–102 https://doi.org/10.1093/nar/gkq418 (2010). · DOI
Cited by
Phenotypic complexities of rare heterozygous neurexin-1 deletions
Fernando, M. B., Fan, Y., Zhang, Y., Tokolyi, A., Murphy, A. N., Kammourh, S., Deans, P. J. M., Ghorbani, S., Onatzevitch, R., Pero, A., et al. (2025) · Nature · doi:10.1038/s41586-025-08864-9 · Cited by 30
Metadata
- Authors
- Sebastian, R., Jin, K., Pavon, N., Bansal, R., Potter, A., Song, Y., Babu, J., Gabriel, R., Sun, Y., Aronow, B., & Pak, C.
- Venue
- Nature Communications
- Published
- 2023-06-24
- Volume
- 14
- Issue
- 1
- ISSN
- 2041-1723
- PMC
- PMC10290702
- Cited by
- 73
- References
- 34
- Language
- en
- Funders
- U.S. Department of Health & Human Services | NIH | National Institute of Mental Health (MH122519, MH130843)
- Tourette Association of America
- U.S. Department of Health & Human Services | NIH | National Institute of General Medical Sciences (GM135096)
About these checks
Registry, retraction, Cites and statistics results are computed, not judged, with one exception: a printed reference that no index lists is read once by a model before it counts as a citation error. Claims are extracted by a model and kept only when their quote appears verbatim in the text; each cited source is then checked, with a model’s help, for whether it says what the claim relies on. Those verdicts can be wrong — read the claim’s quote and the cited source before relying on one.
Statistics and arithmetic are recomputed, not judged.
Confidence bands are shown only for fields calibrated on our annotated test set. None is calibrated yet, so no band is shown.
What counts as a claim ›How we measure confidence ›How we check this ›
Are you an author, or do you see a problem with this page? Request a review
Data sources
Bibliographic data: Semantic Scholar, OpenAlex, Crossref.
Contains information from the Semantic Scholar Academic Graph Datasets, made available under the ODC Attribution License (ODC-BY 1.0).
Semantic Scholar’s data is described in: Kinney, R., et al. (2023). The Semantic Scholar Open Data Platform. arXiv:2301.10140.
