

The DOI matches its Crossref record; 17 of the 17 references it cites were found in a registry or an index.
Combined single-cell and spatial transcriptomics reveal the molecular, cellular and spatial bone marrow niche organization
Published version of a preprint
Overview
The claims and statistics of this paper haven’t been checked yet.
Run the check — free, no account needed. It reads the open-access text and checks the sources it cites.
Integrity signals
Registry
Cites
Statistics
Figures
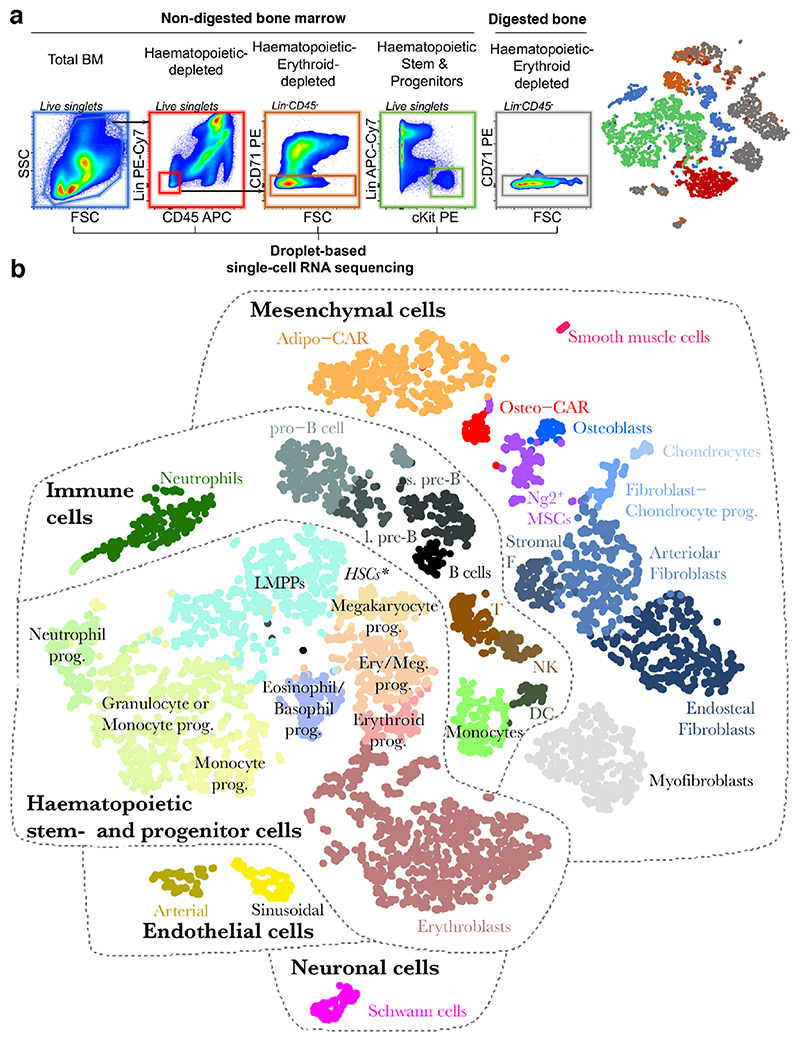
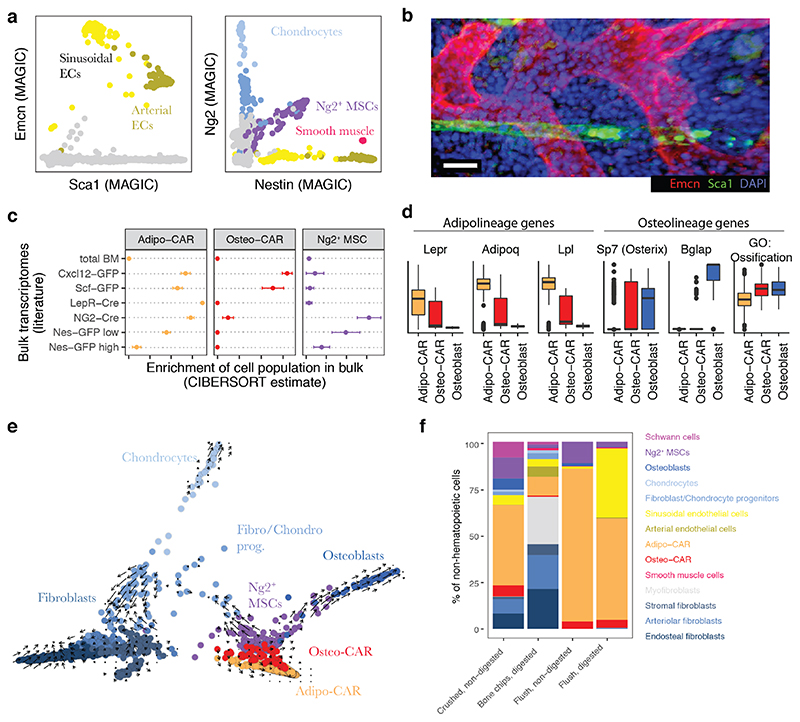
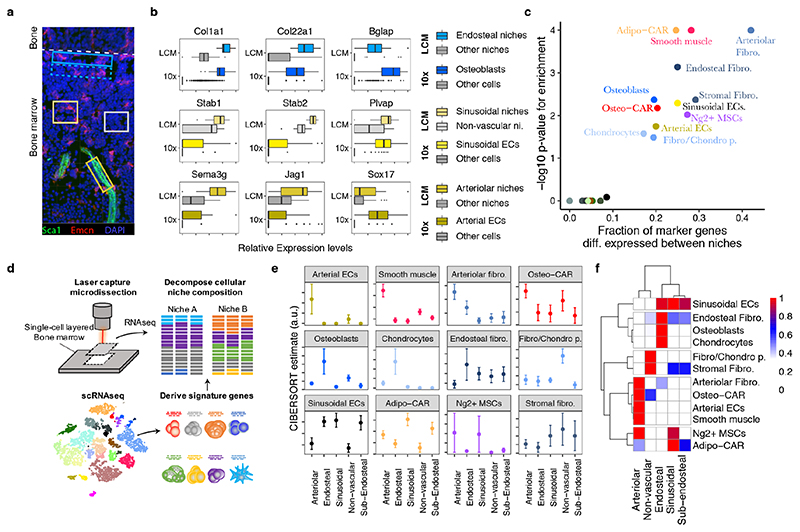
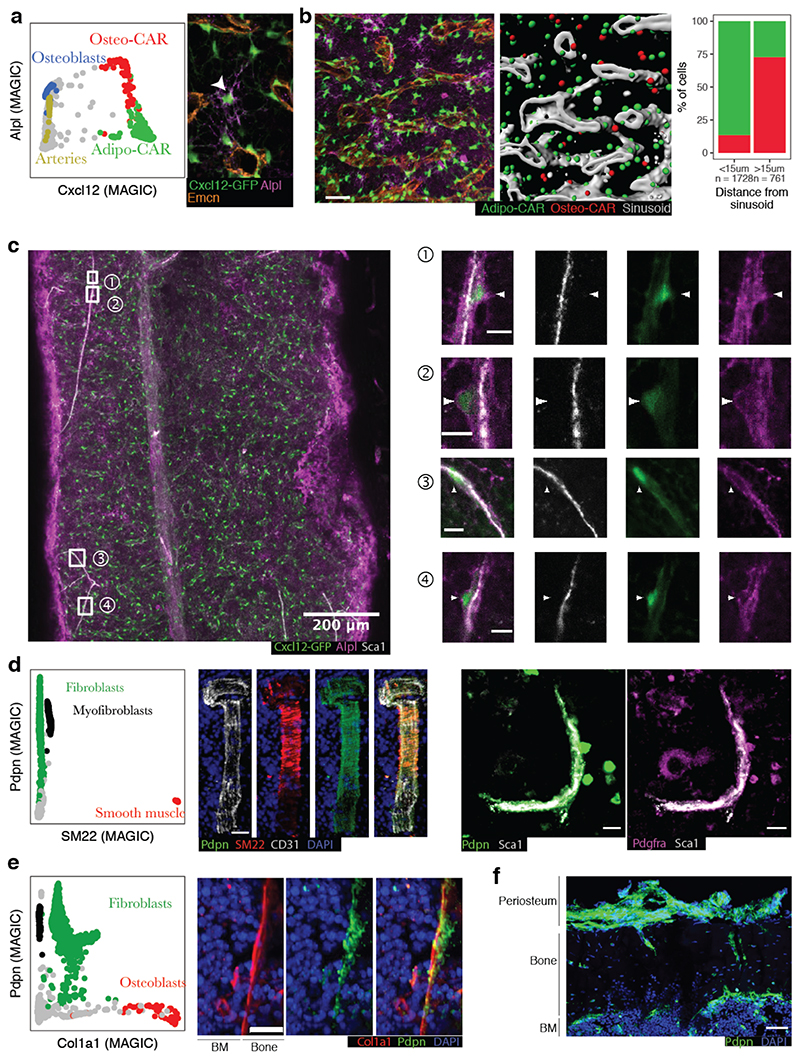
Verification
Claims the paper makes
The claims and statistics of this paper haven’t been checked yet.
Run the check — free, no account needed. It reads the open-access text and checks the sources it cites.
Claims other papers make about this one
Each is checked against this paper’s own text: does it say what the citing paper says it does?
In the citing paper
“These were then further cross-checked against known genes associated with specific lineages and cell types leading to 17 clusters32,58,59.”
From Clonal hematopoiesis related TET2 loss-of-function impedes IL1β-mediated epigenetic reprogramming in hematopoietic stem and progenitor cells (2023) · cites this paper as [59]
Self-check
Percentages, sums and reported differences re-computed from the paper’s own numbers.
The self-check needs the paper’s full text.
Citations
Cites
STAR: ultrafast universal RNA-seq aligner
Dobin, A., Davis, C. A., Schlesinger, F., Drenkow, J., Zaleski, C., Jha, S., Batut, P., Chaisson, M., & Gingeras, T. R. (2013) · Bioinformatics · doi:10.1093/bioinformatics/bts635 · Cited by 51,709
HTSeq—a Python framework to work with high-throughput sequencing data
Anders, S., Pyl, P. T., & Huber, W. (2015) · Bioinformatics · doi:10.1093/bioinformatics/btu638 · Cited by 21,464
ggplot2: Elegant Graphics for Data Analysis
Wickham, H. (2009) · doi:10.1007/978-0-387-98141-3 · Cited by 14,447
Integrating single-cell transcriptomic data across different conditions, technologies, and species
Butler, A., Hoffman, P., Smibert, P., Papalexi, E., & Satija, R. (2018) · Nature Biotechnology · doi:10.1038/nbt.4096 · Cited by 13,174
Near-optimal probabilistic RNA-seq quantification
Bray, N. L., Pimentel, H., Melsted, P., & Pachter, L. (2016) · Nature Biotechnology · doi:10.1038/nbt.3519 · Cited by 9,723
Massively parallel digital transcriptional profiling of single cells
Zheng, G. X. Y., Terry, J. M., Belgrader, P., Ryvkin, P., Bent, Z. W., Wilson, R., Ziraldo, S. B., Wheeler, T. D., McDermott, G. P., Zhu, J., et al. (2017) · Nature Communications · doi:10.1038/ncomms14049 · Cited by 7,353
Visualization and analysis of gene expression in tissue sections by spatial transcriptomics
Ståhl, P. L., Salmén, F., Vickovic, S., Lundmark, A., Navarro, J. F., Magnusson, J., Giacomello, S., Asp, M., Westholm, J. O., Huss, M., et al. (2016) · Science · doi:10.1126/science.aaf2403 · Cited by 3,834
Spatially resolved, highly multiplexed RNA profiling in single cells
Chen, K. H., Boettiger, A. N., Moffitt, J. R., Wang, S., & Zhuang, X. (2015) · Science · doi:10.1126/science.aaa6090 · Cited by 2,969
The bone marrow niche for haematopoietic stem cells
Morrison, S. J., & Scadden, D. T. (2014) · Nature · doi:10.1038/nature12984 · Cited by 2,451
Single-cell reconstruction of the early maternal–fetal interface in humans
Vento-Tormo, R., Efremova, M., Botting, R. A., Turco, M. Y., Vento-Tormo, M., Meyer, K. B., Park, J.-E., Stephenson, E., Polański, K., Goncalves, A., et al. (2018) · Nature · doi:10.1038/s41586-018-0698-6 · Cited by 2,358
Research works printed but not linked: 44
- Ramasamy, S. K. et al. Regulation of hematopoiesis and osteogenesis by blood vessel-derived signals. Annu. Rev. Cell Dev. Biol. 32, 649–675 (2016). · DOI
- Wei, Q. & Frenette, P. S. Niches for hematopoietic stem cells and their progeny. Immunity 48, 632–648 (2018). · DOI
- Sugiyama, T., Kohara, H., Noda, M. & Nagasawa, T. Maintenance of the hematopoietic stem cell pool by CXCL12–CXCR4 chemokine signaling in bone marrow stromal cell niches. Immunity 25, 977–988 (2006). · DOI
- Ding, L., Saunders, T. L., Enikolopov, G. & Morrison, S. J. Endothelial and perivascular cells maintain haematopoietic stem cells. Nature 481, 457–462 (2012). · DOI
- Ding, L. & Morrison, S. J. Haematopoietic stem cells and early lymphoid progenitors occupy distinct bone marrow niches. Nature 495, 231–235 (2013). · DOI
- Kunisaki, Y. et al. Arteriolar niches maintain haematopoietic stem cell quiescence. Nature 502, 637–643 (2013). · DOI
- Asada, N. et al. Differential cytokine contributions of perivascular haematopoietic stem cell niches. Nat. Cell Biol. 19, 214–223 (2017). · DOI
- Greenbaum, A. et al. CXCL12 in early mesenchymal progenitors is required for haematopoietic stem-cell maintenance. Nature 495, 227–230 (2013). · DOI
- Méndez-Ferrer, S. et al. Mesenchymal and haematopoietic stem cells form a unique bone marrow niche. Nature 466, 829–834 (2010). · DOI
- Gomariz, A. et al. Quantitative spatial analysis of haematopoiesis-regulating stromal cells in the bone marrow microenvironment by 3D microscopy. Nat. Commun. 9, 2532 (2018). · DOI
- Newman, A. M. et al. Robust enumeration of cell subsets from tissue expression profiles. Nat. Methods 12, 453–457 (2015). · DOI · Paper page
- Baron, M. et al. A single-cell transcriptomic map of the human and mouse pancreas reveals inter- and intra-cell population structure. Cell Syst. 3, 346–360 (2016). · DOI · Paper page
- Zhu, L., Lei, J., Klei, L., Devlin, B. & Roeder, K. Semisoft clustering of single-cell data. Proc. Natl Acad. Sci. USA 116, 466–471 (2018). · DOI
- Boulais, P. E. et al. The majority of CD45– Ter119– CD31– bone marrow cell fraction is of hematopoietic origin and contains erythroid and lymphoid progenitors. Immunity 49, 627–639 (2018). · DOI
- Coutu, D. L., Kokkaliaris, K. D., Kunz, L. & Schroeder, T. Three-dimensional map of nonhematopoietic bone and bone-marrow cells and molecules. Nat. Biotechnol. 35, 1202–1210 (2017). · DOI
- Omatsu, Y. et al. The essential functions of adipo-osteogenic progenitors as the hematopoietic stem and progenitor cell niche. Immunity 33, 387–399 (2010). · DOI
- Zhou, B. O. et al. Bone marrow adipocytes promote the regeneration of stem cells and haematopoiesis by secreting SCF. Nat. Cell Biol. 19, 891–903 (2017). · DOI
- La Manno, G. et al. RNA velocity of single cells. Nature 560, 494–498 (2018). · DOI · Paper page
- Karamitros, D. et al. Single-cell analysis reveals the continuum of human lympho-myeloid progenitor cells. Nat. Immunol. 19, 85–97 (2018). · DOI
- Baryawno, N. et al. A cellular taxonomy of the bone marrow stroma in homeostasis and leukemia. Cell 177, 1915–1932 (2019). · DOI
- Lee, J. H. et al. Highly multiplexed subcellular RNA sequencing in situ. Science 343, 1360–1363 (2014). · DOI · Paper page
- Medaglia, C. et al. Spatial reconstruction of immune niches by combining photoactivatable reporters and scRNA-seq. Science 358, 1622–1626 (2017). · DOI
- Silberstein, L. et al. Proximity-based differential single-cell analysis of the niche to identify stem/progenitor cell regulators. Cell Stem Cell 19, 530–543 (2016). · DOI
- Nichterwitz, S. et al. Laser capture microscopy coupled with Smart-seq2 (LCM-seq) for robust and efficient transcriptomic profiling of mouse and human cells. Nat. Commun. 7, 12139 (2016). · DOI
- Tamura, S. et al. Podoplanin-positive periarteriolar stromal cells promote megakaryocyte growth and proplatelet formation in mice by CLEC-2. Blood 127, 1701–1710 (2016). · DOI
- Gumbiner, B. M. Cell adhesion: the molecular basis of tissue architecture and morphogenesis. Cell 84, 345–357 (1996). · DOI · Paper page
- Potente, M. & Mäkinen, T. Vascular heterogeneity and specialization in development and disease. Nat. Rev. Mol. Cell Biol. 18, 477–494 (2017). · DOI · Paper page
- Xu, C. et al. Stem cell factor is selectively secreted by arterial endothelial cells in bone marrow. Nat. Commun. 9, 2449 (2018). · DOI
- Camp, J. G. et al. Multilineage communication regulates human liver bud development from pluripotency. Nature 546, 533–538 (2017). · DOI · Paper page
- Cohen, M. et al. Lung single-cell signaling interaction map reveals basophil role in macrophage imprinting. Cell 175, 1031–1044 (2018). · DOI
- Siddiqui, J. A. & Partridge, N. C. Physiological bone remodeling: systemic regulation and growth factor involvement. Physiology 31, 233–245 (2016). · DOI
- Pinho, S. et al. Lineage-biased hematopoietic stem cells are regulated by distinct niches. Dev. Cell 44, 634–641.e4 (2018). · DOI
- Itkin, T. et al. Distinct bone marrow blood vessels differentially regulate haematopoiesis. Nature 532, 323–328 (2016). · DOI
- Cordeiro Gomes, A. et al. Hematopoietic stem cell niches produce lineage-instructive signals to control multipotent progenitor differentiation. Immunity 45, 1219–1231 (2016). · DOI
- van Dijk, D. et al. Recovering gene interactions from single-cell data using data diffusion. Cell 174, 716-729 (2018). · DOI · Paper page
- Kiselev, V. Y., Yiu, A. & Hemberg, M. scmap: projection of single-cell RNA-seq data across data sets. Nat. Methods 15, 359–362 (2018). · DOI
- Law, C. W., Chen, Y., Shi, W. & Smyth, G. K. voom: precision weights unlock linear model analysis tools for RNA-seq read counts. Genome Biol. 15, R29 (2014). · DOI · Paper page
- Hennig, B. P. et al. Large-scale low-cost NGS library preparation using a robust Tn5 purification and tagmentation protocol. G3 8, 79–89 (2018). · DOI
- Nichterwitz, S., Benitez, J. A., Hoogstraaten, R., Deng, Q. & Hedlund, E. In RNA Detection. Methods in Molecular Biology, vol 1649 (ed Gaspar, I.) (Humana Press, New York, NY, 2018).
- Thomsen, E. R. et al. Fixed single-cell transcriptomic characterization of human radial glial diversity. Nat. Methods 13, 87–93 (2016). · DOI
- Stuart, T. et al. Comprehensive integration of single-cell data. Cell 177, 1888–1902 (2019). · DOI · Paper page
- Chen, B., Khodadoust, M. S., Liu, C. L., Newman, A. M. & Alizadeh, A. A. in Cancer Systems Biology, vol. 1711 (ed. von Stechow, L.) 243–259 (Humana Press, New York, 2018). · DOI
- Shay, T. & Kang, J. Immunological genome project and systems immunology. Trends Immunol. 34, 602–609 (2013). · DOI
- Worthley, D. L. et al. Gremlin 1 identifies a skeletal stem cell with bone, cartilage, and reticular stromal potential. Cell 160, 269–284 (2015). · DOI
Cited by
Deciphering cell–cell interactions and communication from gene expression
Armingol, E., Officer, A., Harismendy, O., & Lewis, N. E. (2021) · Nature Reviews Genetics · doi:10.1038/s41576-020-00292-x · Cited by 1,267
Integrating single-cell and spatial transcriptomics to elucidate intercellular tissue dynamics
Longo, S. K., Guo, M. G., Ji, A. L., & Khavari, P. A. (2021) · Nature Reviews Genetics · doi:10.1038/s41576-021-00370-8 · Cited by 1,059
Functional characterization of the dural sinuses as a neuroimmune interface
Rustenhoven, J., Drieu, A., Mamuladze, T., de Lima, K. A., Dykstra, T., Wall, M., Papadopoulos, Z., Kanamori, M., Salvador, A. F., Baker, W., et al. (2021) · Cell · doi:10.1016/j.cell.2020.12.040 · Cited by 685
Skull and vertebral bone marrow are myeloid cell reservoirs for the meninges and CNS parenchyma
Cugurra, A., Mamuladze, T., Rustenhoven, J., Dykstra, T., Beroshvili, G., Greenberg, Z. J., Baker, W., Papadopoulos, Z., Drieu, A., Blackburn, S., et al. (2021) · Science · doi:10.1126/science.abf7844 · Cited by 681
Dimitrov, D., Türei, D., Garrido-Rodriguez, M., Burmedi, P. L., Nagai, J. S., Boys, C., Ramirez Flores, R. O., Kim, H., Szalai, B., Costa, I. G., et al. (2022) · Nature Communications · doi:10.1038/s41467-022-30755-0 · Cited by 664
Microscopic examination of spatial transcriptome using Seq-Scope
Cho, C.-S., Xi, J., Si, Y., Park, S.-R., Hsu, J.-E., Kim, M., Jun, G., Kang, H. M., & Lee, J. H. (2021) · Cell · doi:10.1016/j.cell.2021.05.010 · Cited by 520
Cell-cell communication: New insights and clinical implications
Su, J., Song, Y., Zhu, Z., Huang, X., Fan, J., Qiao, J., & Mao, F. (2024) · Signal Transduction and Targeted Therapy · doi:10.1038/s41392-024-01888-z · Cited by 433
A mechanosensitive peri-arteriolar niche for osteogenesis and lymphopoiesis
Shen, B., Tasdogan, A., Ubellacker, J. M., Zhang, J., Nosyreva, E. D., Du, L., Murphy, M. M., Hu, S., Yi, Y., Kara, N., et al. (2021) · Nature · doi:10.1038/s41586-021-03298-5 · Cited by 310
Bandyopadhyay, S., Duffy, M. P., Ahn, K. J., Sussman, J. H., Pang, M., Smith, D., Duncan, G., Zhang, I., Huang, J., Lin, Y., et al. (2024) · Cell · doi:10.1016/j.cell.2024.04.013 · Cited by 300
Predicting cell-to-cell communication networks using NATMI
Hou, R., Denisenko, E., Ong, H. T., Ramilowski, J. A., & Forrest, A. R. R. (2020) · Nature Communications · doi:10.1038/s41467-020-18873-z · Cited by 285
The endothelium–bone axis in development, homeostasis and bone and joint disease
Tuckermann, J., & Adams, R. H. (2021) · Nature Reviews Rheumatology · doi:10.1038/s41584-021-00682-3 · Cited by 258
Targeted Perturb-seq enables genome-scale genetic screens in single cells
Schraivogel, D., Gschwind, A. R., Milbank, J. H., Leonce, D. R., Jakob, P., Mathur, L., Korbel, J. O., Merten, C. A., Velten, L., & Steinmetz, L. M. (2020) · Nature Methods · doi:10.1038/s41592-020-0837-5 · Cited by 245
Self-citationDecline in IGF1 in the bone marrow microenvironment initiates hematopoietic stem cell aging
Young, K., Eudy, E., Bell, R., Loberg, M. A., Stearns, T., Sharma, D., Velten, L., Haas, S., Filippi, M.-D., & Trowbridge, J. J. (2021) · Cell Stem Cell · doi:10.1016/j.stem.2021.03.017 · Cited by 216
Self-citationCellular heterogeneity in adipose tissues
Corvera, S. (2021) · Annual Review of Physiology · doi:10.1146/annurev-physiol-031620-095446 · Cited by 171
Unraveling Hematopoiesis through the Lens of Genomics
Liggett, L. A., & Sankaran, V. G. (2020) · Cell · doi:10.1016/j.cell.2020.08.030 · Cited by 163
Chen, Y., Yang, S., Lovisa, S., Ambrose, C. G., McAndrews, K. M., Sugimoto, H., & Kalluri, R. (2021) · Nature Communications · doi:10.1038/s41467-021-27563-3 · Cited by 134
McClatchy, J., Strogantsev, R., Wolfe, E., Lin, H. Y., Mohammadhosseini, M., Davis, B. A., Eden, C., Goldman, D., Fleming, W. H., Conley, P., et al. (2023) · Nature Communications · doi:10.1038/s41467-023-43697-y · Cited by 95
Inoue, K., Qin, Y., Xia, Y., Han, J., Yuan, R., Sun, J., Xu, R., Jiang, J. X., Greenblatt, M. B., & Zhao, B. (2023) · eLife · doi:10.7554/elife.82118 · Cited by 65
Doolittle, M. L., Saul, D., Kaur, J., Rowsey, J. L., Vos, S. J., Pavelko, K. D., Farr, J. N., Monroe, D. G., & Khosla, S. (2023) · Nature Communications · doi:10.1038/s41467-023-40393-9 · Cited by 57
Doolittle, M. L., Saul, D., Kaur, J., Rowsey, J. L., Vos, S. J., Pavelko, K. D., Farr, J. N., Monroe, D. G., & Khosla, S. (2023) · doi:10.1101/2023.01.12.523760 · Cited by 57
Søe, K., Delaisse, J.-M., & Borggaard, X. G. (2021) · Seminars in Cell & Developmental Biology · doi:10.1016/j.semcdb.2020.05.016 · Cited by 49
Bone marrow niches for hematopoietic stem cells: Life span dynamics and adaptation to acute stress
Hofmann, J., & Kokkaliaris, K. D. (2024) · Blood · doi:10.1182/blood.2023023788 · Cited by 45
Single‐cell RNAseq provides insight into altered immune cell populations in human fracture nonunions
Avin, K. G., Dominguez, J. M., Chen, N. X., Hato, T., Myslinski, J. J., Gao, H., Liu, Y., McKinley, T. O., Brown, K. M., Moe, S. M., et al. (2023) · Journal of Orthopaedic Research · doi:10.1002/jor.25452 · Cited by 39
Interactions of B-lymphocytes and bone cells in health and disease
Grčević, D., Sanjay, A., & Lorenzo, J. (2023) · Bone · doi:10.1016/j.bone.2021.116296 · Cited by 36
Cellular crosstalk in the bone marrow niche
Huang, Z., Iqbal, Z., Zhao, Z., Liu, J., Alabsi, A. M., Shabbir, M., Mahmood, A., Liang, Y., Li, W., & Deng, Z. (2024) · Journal of Translational Medicine · doi:10.1186/s12967-024-05900-6 · Cited by 34
Design principles of cell-state-specific enhancers in hematopoiesis
Frömel, R., Rühle, J., Bernal Martinez, A., Szu-Tu, C., Pacheco Pastor, F., Martinez-Corral, R., & Velten, L. (2025) · Cell · doi:10.1016/j.cell.2025.04.017 · Cited by 29
Self-citationSpatiotemporal multi-omics: exploring molecular landscapes in aging and regenerative medicine
Chu, L.-X., Wang, W.-J., Gu, X.-P., Wu, P., Gao, C., Zhang, Q., Wu, J., Jiang, D.-W., Huang, J.-Q., Ying, X.-W., et al. (2024) · Military Medical Research · doi:10.1186/s40779-024-00537-4 · Cited by 29
Lutz, R., Poos, A. M., Solé-Boldo, L., John, L., Wagner, J., Prokoph, N., Baertsch, M. A., Vonficht, D., Palit, S., Brobeil, A., et al. (2025) · Science Immunology · doi:10.1126/sciimmunol.adp6667 · Cited by 25
“2D), in line with previous reports (16).”
Self-citationZhang, X., Tian, L., Majumdar, A., & Scheller, E. L. (2024) · Comprehensive Physiology · doi:10.1002/j.2040-4603.2024.tb00300.x · Cited by 18
Borda, M., Sierra, R., Cantero, M. J., Gómez Bustillo, S., Fiore, E. J., Giardelli, G., Martino Garcet, M., Rebottaro, M. L., Bayo Fina, J. M., Schiavone, M., et al. (2024) · Stem Cell Research & Therapy · doi:10.1186/s13287-024-03896-w · Cited by 3
Metadata
- Authors
- Baccin, C., Al-Sabah, J., Velten, L., Helbling, P. M., Grünschläger, F., Hernández-Malmierca, P., Nombela-Arrieta, C., Steinmetz, L. M., Trumpp, A., & Haas, S.
- Venue
- Nature Cell Biology
- Published
- 2019-12-23
- Volume
- 22
- Issue
- 1
- Pages
- 38-48
- ISSN
- 1465-7392
- 1476-4679
- PMC
- PMC7610809
- Cited by
- 904
- References
- 17
- Language
- en
About these checks
Registry, retraction, Cites and statistics results are computed, not judged, with one exception: a printed reference that no index lists is read once by a model before it counts as a citation error. Claims are extracted by a model and kept only when their quote appears verbatim in the text; each cited source is then checked, with a model’s help, for whether it says what the claim relies on. Those verdicts can be wrong — read the claim’s quote and the cited source before relying on one.
Statistics and arithmetic are recomputed, not judged.
Confidence bands are shown only for fields calibrated on our annotated test set. None is calibrated yet, so no band is shown.
What counts as a claim ›How we measure confidence ›How we check this ›
Are you an author, or do you see a problem with this page? Request a review
