

The DOI matches its Crossref record; 37 of the 38 references it cites were found in a registry or an index.
Measuring human capital using global learning data
Open accessAbstract
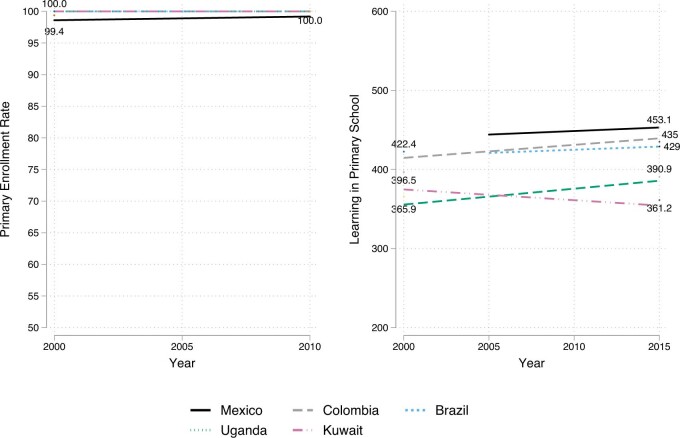
Human capital—that is, resources associated with the knowledge and skills of individuals—is a critical component of economic development 1,2 . Learning metrics that are comparable for countries globally are necessary to understand and track the formation of human capital. The increasing use of international achievement tests is an important step in this direction 3 . However, such tests are administered primarily in developed countries 4 , limiting our ability to analyse learning patterns in developing countries that may have the most to gain from the formation of human capital. Here we bridge this gap by constructing a globally comparable database of 164 countries from 2000 to 2017. The data represent 98% of the global population and developing economies comprise two-thirds of the included countries. Using this dataset, we show that global progress in learning—a priority Sustainable Development Goal—has been limited, despite increasing enrolment in primary and secondary education. Using an accounting exercise that includes a direct measure of schooling quality, we estimate that the role of human capital in explaining income differences across countries ranges from a fifth to half; this result has an intermediate position in the wide range of estimates provided in earlier papers in the literature 5–13 . Moreover, we show that average estimates mask considerable heterogeneity associated with income grouping across countries and regions. This heterogeneity highlights the importance of including countries at various stages of economic development when analysing the role of human capital in economic development. Finally, we show that our database provides a measure of human capital that is more closely associated with economic growth than current measures that are included in the Penn world tables version 9.0 14 and the human development index of the United Nations 15 .
Overview
The claims and statistics of this paper haven’t been checked yet.
Free: it reads the open-access text and checks the first 5 claims that cite a source we can check. Create a free account to check every claim.
Integrity signals
Registry
Cites
Statistics
Figures
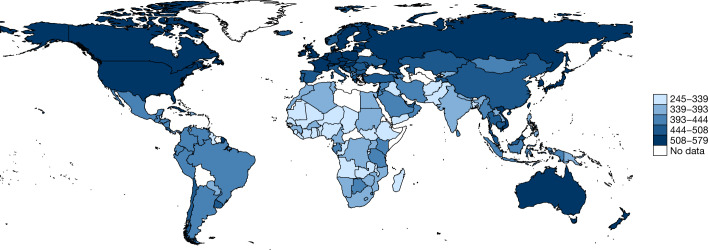
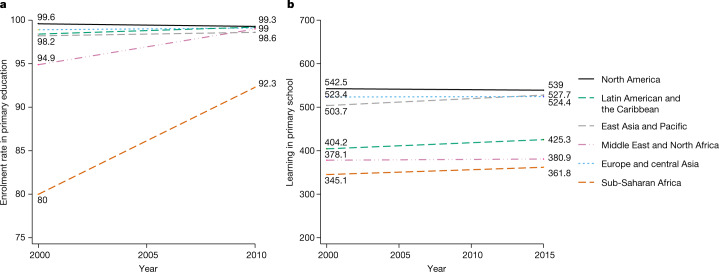
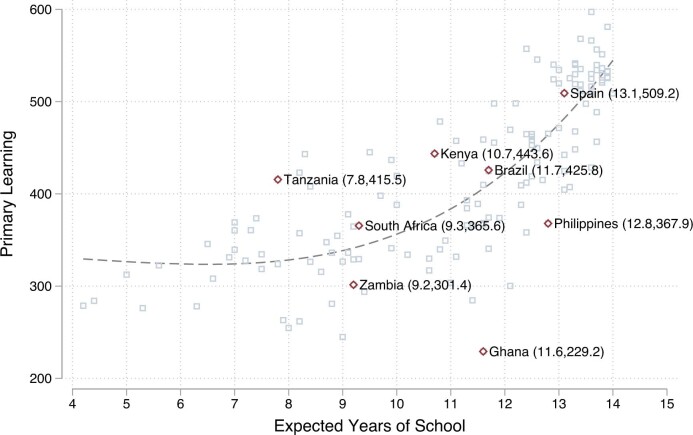
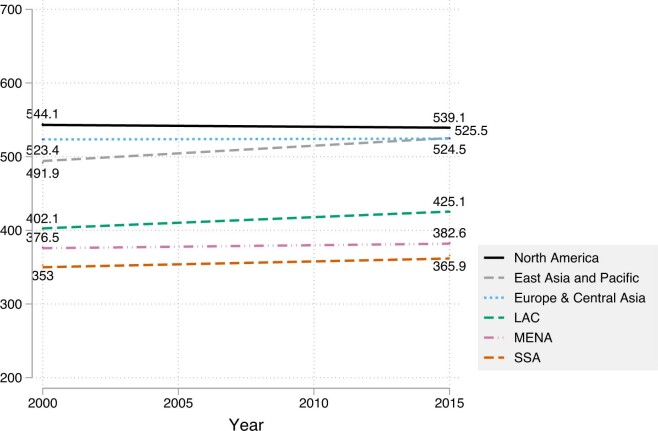

Verification
Claims the paper makes
The claims and statistics of this paper haven’t been checked yet.
Free: it reads the open-access text and checks the first 5 claims that cite a source we can check. Create a free account to check every claim.
Claims other papers make about this one
Each is checked against this paper’s own text: does it say what the citing paper says it does?
The cited source says what the claim attributes to it.
In the citing paper
“Low-and middle-income countries were already struggling with a learning crisis before the pandemic.”
From A systematic review and meta-analysis of the evidence on learning during the COVID-19 pandemic (2023) · cites this paper as [30]
Self-check
Percentages, sums and reported differences re-computed from the paper’s own numbers.
The self-check needs the paper’s full text.
Citations
Cites
A Contribution to the Empirics of Economic Growth
Mankiw, N. G., Romer, D., & Weil, D. N. (1992) · The Quarterly Journal of Economics · doi:10.2307/2118477 · Cited by 15,119
An Inquiry into the Nature and Causes of the Wealth of Nations
Smith, A. (1776) · The Glasgow Edition of the Works and Correspondence of Adam Smith, Vol. 2: An Inquiry into the Nature and Causes of the Wealth of Nations, Vol. 1 · doi:10.1093/oseo/instance.00043218 · Cited by 11,757
Investment in Human Capital: A Theoretical Analysis
Becker, G. S. (1962) · Journal of Political Economy · doi:10.1086/258724 · Cited by 8,063
Why do Some Countries Produce So Much More Output Per Worker than Others?
Hall, R. E., & Jones, C. I. (1999) · The Quarterly Journal of Economics · doi:10.1162/003355399555954 · Cited by 7,879
The United Nations Development Programme
Oestreich, J. E. (2017) · Development and Human Rights · doi:10.1093/acprof:oso/9780190637347.003.0003 · Cited by 4,894
The Next Generation of the Penn World Table
Feenstra, R. C., Inklaar, R., & Timmer, M. P. (2015) · American Economic Review · doi:10.1257/aer.20130954 · Cited by 4,799
A new data set of educational attainment in the world, 1950–2010
Barro, R. J., & Lee, J. W. (2013) · Journal of Development Economics · doi:10.1016/j.jdeveco.2012.10.001 · Cited by 4,333
International data on educational attainment: updates and implications
Barro, R. J. (2001) · Oxford Economic Papers · doi:10.1093/oep/53.3.541 · Cited by 2,569
Schooling, Labor-Force Quality, and the Growth of Nations
Hanushek, E. A., & Kimko, D. D. (2000) · American Economic Review · doi:10.1257/aer.90.5.1184 · Cited by 2,164
Education for Growth: Why and for Whom?
Krueger, A. B., & Lindahl, M. (2001) · Journal of Economic Literature · doi:10.1257/jel.39.4.1101 · Cited by 2,060
Cited by
A systematic review and meta-analysis of the evidence on learning during the COVID-19 pandemic
Betthäuser, B. A., Bach-Mortensen, A. M., & Engzell, P. (2023) · Nature Human Behaviour · doi:10.1038/s41562-022-01506-4 · Cited by 568
Public Procurement in Law and Practice
Bosio, E., Djankov, S., Glaeser, E., & Shleifer, A. (2022) · American Economic Review · doi:10.1257/aer.20200738 · Cited by 237
Self-citationGlobal universal basic skills: Current deficits and implications for world development
Gust, S., Hanushek, E. A., & Woessmann, L. (2023) · Journal of Development Economics · doi:10.1016/j.jdeveco.2023.103205 · Cited by 156
Improving Learning in Low- and Lower-Middle-Income Countries
Angrist, N., Aurino, E., Patrinos, H. A., Psacharopoulos, G., Vegas, E., Nordjo, R. E., & Wong, B. A. (2023) · Journal of Benefit-Cost Analysis · doi:10.1017/bca.2023.26 · Cited by 137
Self-citationSecondary School Fee Abolition in Sub-Saharan Africa: Taking Stock of the Evidence
Gruijters, R. J., Abango, M. A., & Casely-Hayford, L. (2024) · Comparative Education Review · doi:10.1086/731496 · Cited by 119
Metadata
- Authors
- Angrist, N., Djankov, S., Goldberg, P. K., & Patrinos, H. A.
- Affiliations
- World Bank (US)
- Peterson Institute for International Economics (US)
- National Bureau of Economic Research (US)
- Corresponding author
- Angrist, Noam
- Venue
- Nature
- Published
- 2021-03-10
- Volume
- 592
- Issue
- 7854
- Pages
- 403-408
- ISSN
- 0028-0836 (ISSN-L)
- 1476-4687
- PMC
- PMC8046667
- OpenAlex
- W3135040737
- Semantic Scholar
- 75fae8a9912fe4a8a084321eec4f489258a1aaa3
- Cited by
- 328
- References
- 38
- Citations by year
- 2026: 47 · 2025: 49 · 2024: 80 · 2023: 69 · 2022: 65 · 2021: 14
- FWCI
- 43.52
- Type
- journal article
- Language
- en
- Open access
- hybrid
- doi.org
- Licence
- cc-by
- creativecommons.org/licenses/by/4.0 (tdm)
- creativecommons.org/licenses/by/4.0 (vor)
- Locations
- Nature (publishedVersion, cc-by)
- PubMed Central (publishedVersion, cc-by)
- PubMed (publishedVersion)
- London School of Economics and Political Science Research Online (London School of Economics and Political Science) (acceptedVersion)
- London School of Economics and Political Science Theses Online (London School of Economics and Political Science) (acceptedVersion)
- LSE Research Online Documents on Economics (submittedVersion)
- RePEc: Research Papers in Economics (submittedVersion)
- Funders
- United States Agency for International Development (FHI360)
- World Bank Group
- Topics
- Social Sciences › Economics, Econometrics and Finance › Economics and Econometrics › Economic Growth and Productivity
- Social Sciences › Economics, Econometrics and Finance › Economics and Econometrics › Economic Growth and Development
- Social Sciences › Development › Culture, Economy, and Development Studies
- Keywords
- human capital, learning metrics, developing countries, economic growth, educational quality, Sustainable Development Goal 4, human capital accounting, Human Development Index, Penn World Table
About these checks
Registry, retraction, Cites and statistics results are computed, not judged, with one exception: a printed reference that no index lists is read once by a model before it counts as a citation error. Claims are extracted by a model and kept only when their quote appears verbatim in the text; each cited source is then checked, with a model’s help, for whether it says what the claim relies on. Those verdicts can be wrong — read the claim’s quote and the cited source before relying on one.
Statistics and arithmetic are recomputed, not judged.
Confidence bands are shown only for fields calibrated on our annotated test set. None is calibrated yet, so no band is shown.
What counts as a claim ›How we measure confidence ›How we check this ›
Are you an author, or do you see a problem with this page? Request a review
How to cite
Cite CoChat for the checks on this page, and the paper for its own findings.
- This page
- CoChat. (2026). Citation check: Measuring human capital using global learning data. https://app.cochat.ai/papers/10.1038/s41586-021-03323-7
- The paper
- Angrist, N., Djankov, S., Goldberg, P. K., & Patrinos, H. A. (2021). Measuring human capital using global learning data. Nature. https://doi.org/10.1038/s41586-021-03323-7
Data sources
Bibliographic data: Semantic Scholar, OpenAlex, Crossref.
Contains information from the Semantic Scholar Academic Graph Datasets, made available under the ODC Attribution License (ODC-BY 1.0).
Semantic Scholar’s data is described in: Kinney, R., et al. (2023). The Semantic Scholar Open Data Platform. arXiv:2301.10140.
