

The DOI matches its Crossref record; 58 of the 58 references it cites were found in a registry or an index.
A foundation model for generalizable disease detection from retinal images
Open accessAbstract
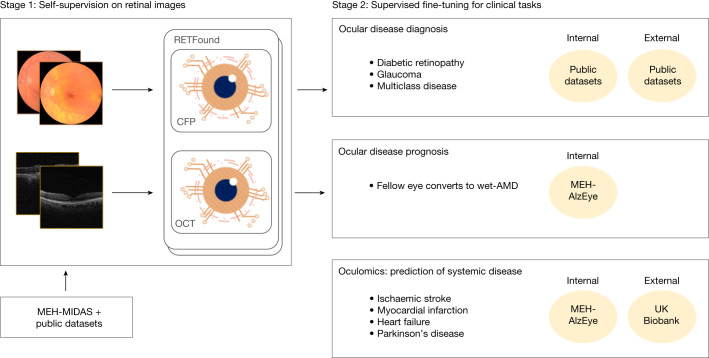
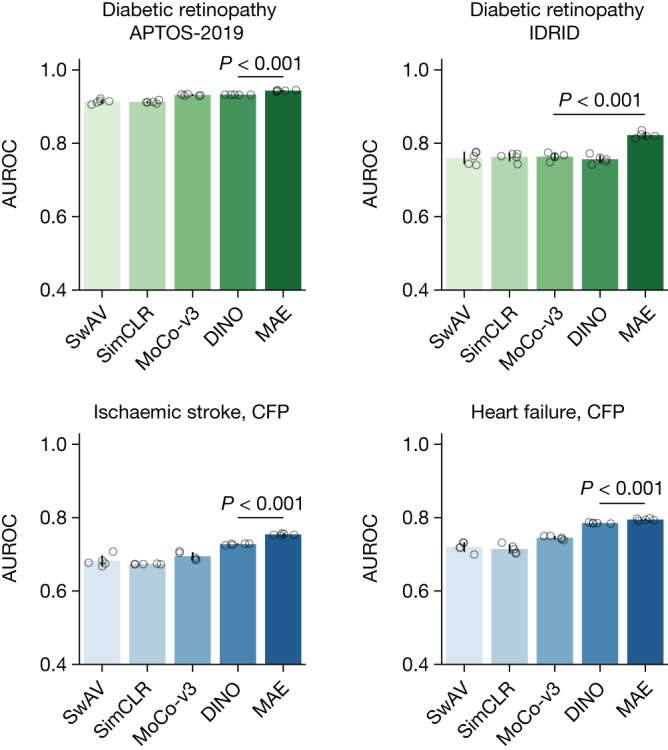
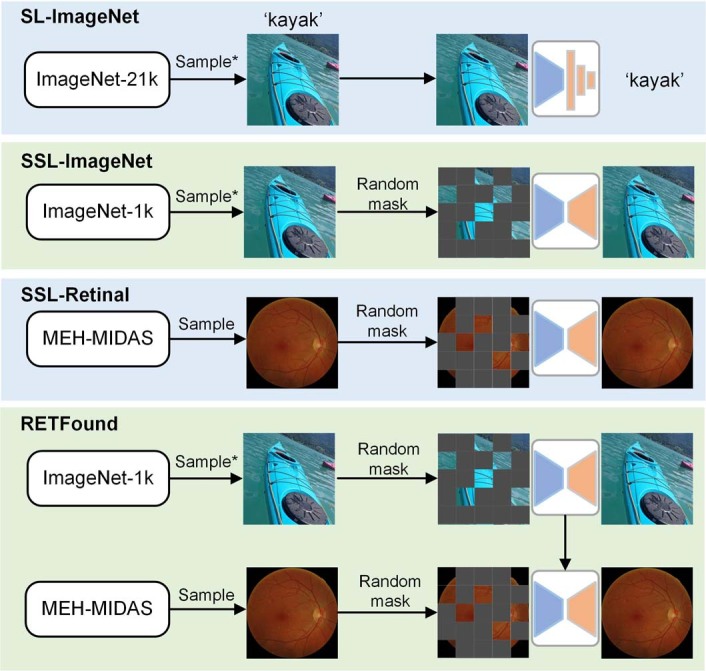
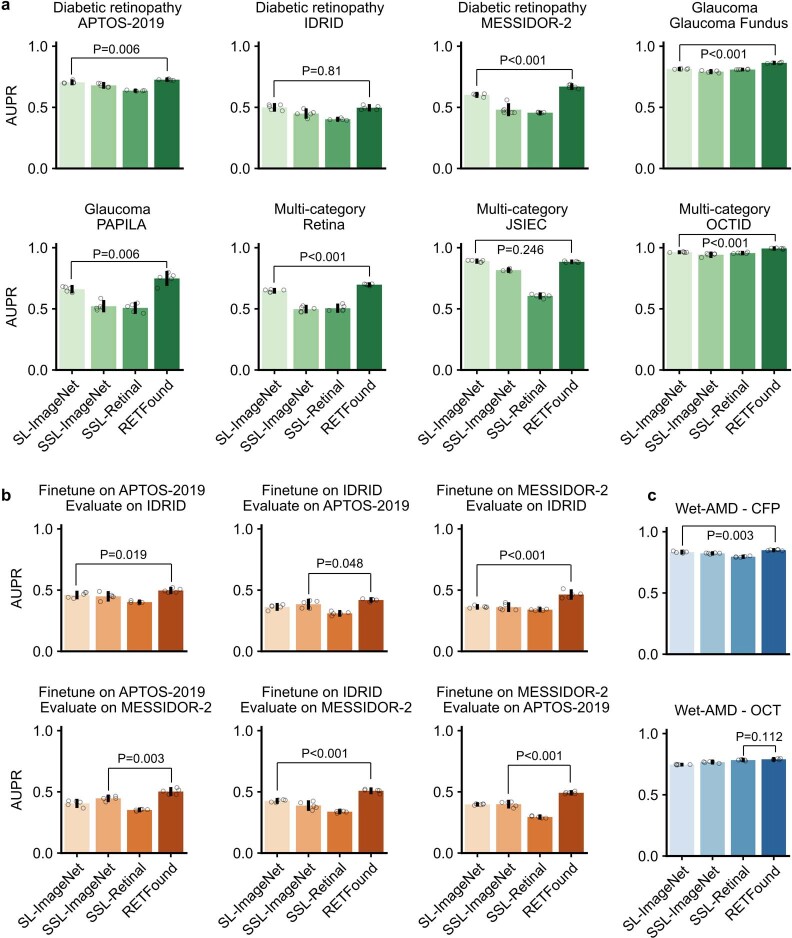
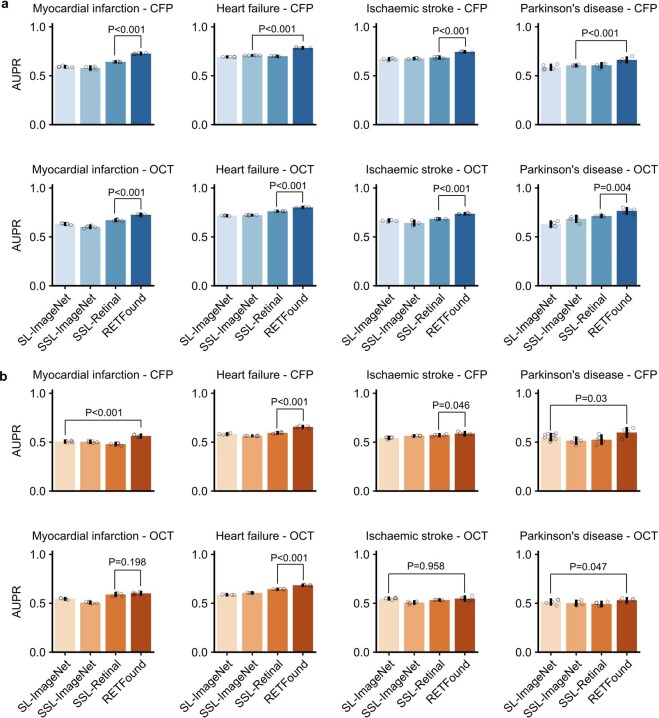
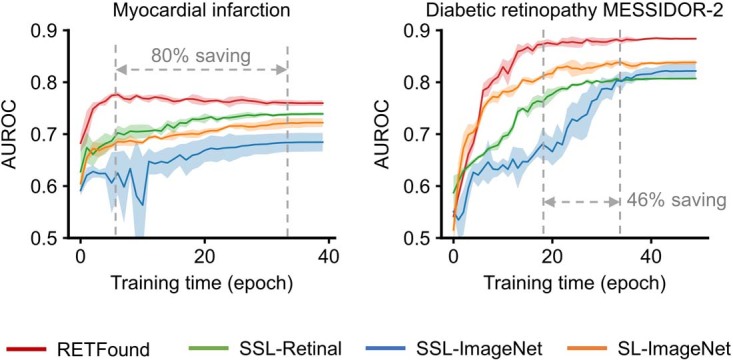
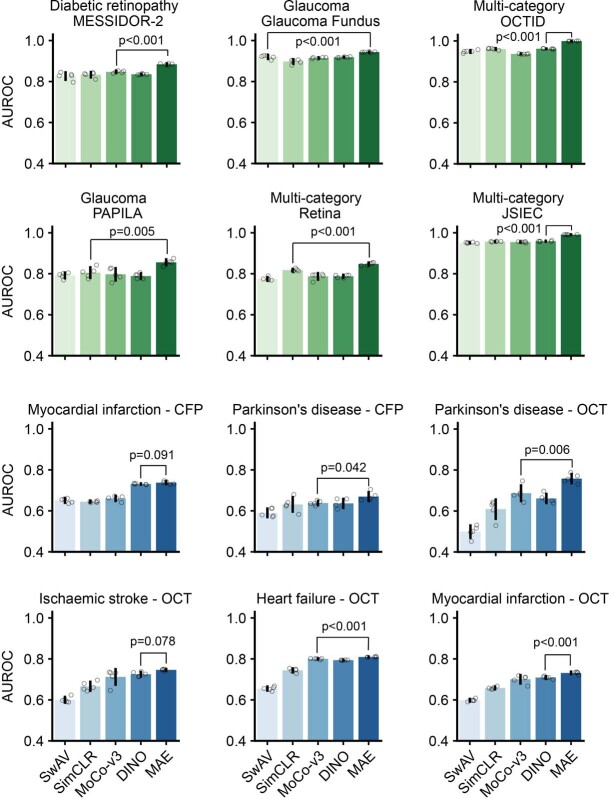
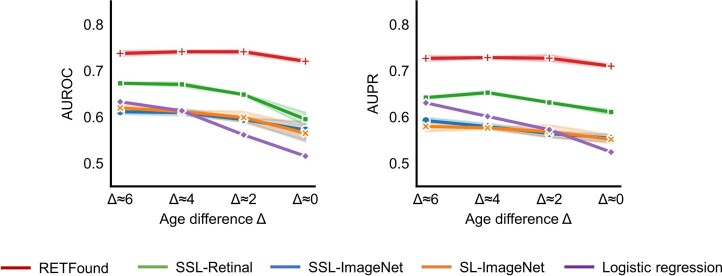
Medical artificial intelligence (AI) offers great potential for recognizing signs of health conditions in retinal images and expediting the diagnosis of eye diseases and systemic disorders 1. However, the development of AI models requires substantial annotation and models are usually task-specific with limited generalizability to different clinical applications 2. Here, we present RETFound, a foundation model for retinal images that learns generalizable representations from unlabelled retinal images and provides a basis for label-efficient model adaptation in several applications. Specifically, RETFound is trained on 1.6 million unlabelled retinal images by means of self-supervised learning and then adapted to disease detection tasks with explicit labels. We show that adapted RETFound consistently outperforms several comparison models in the diagnosis and prognosis of sight-threatening eye diseases, as well as incident prediction of complex systemic disorders such as heart failure and myocardial infarction with fewer labelled data. RETFound provides a generalizable solution to improve model performance and alleviate the annotation workload of experts to enable broad clinical AI applications from retinal imaging.
Overview
The claims and statistics of this paper haven’t been checked yet.
Run the check — free, no account needed. It reads the open-access text and checks the sources it cites.
Integrity signals
Registry
Cites
Statistics
Figures
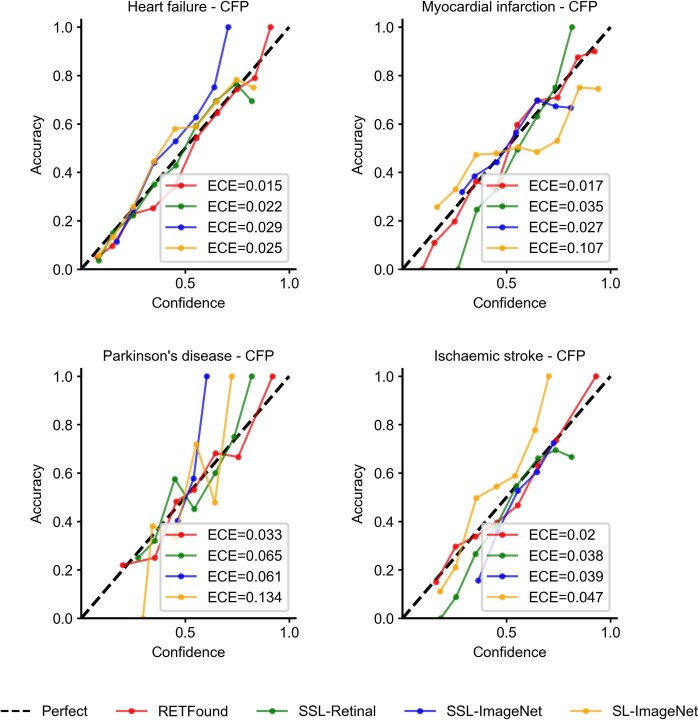
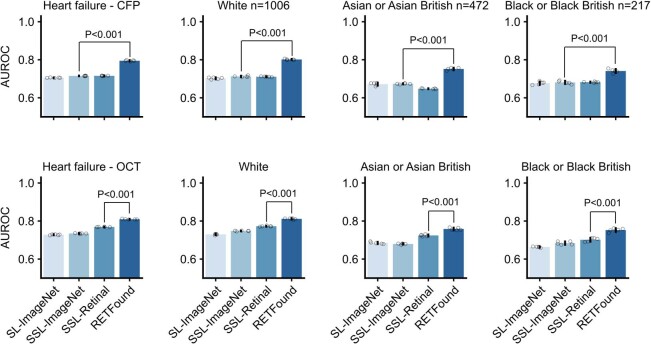
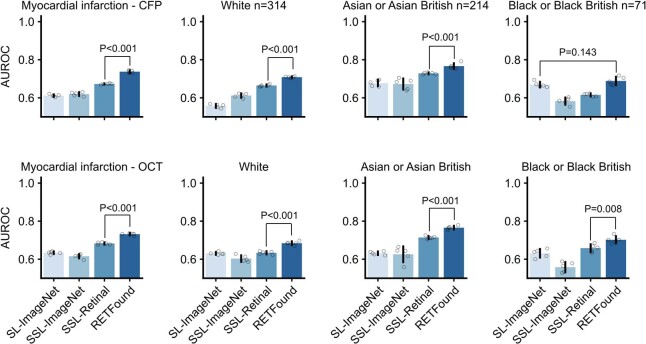
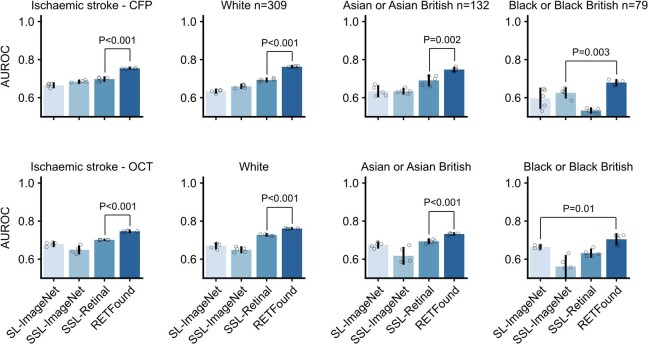
Verification
Claims the paper makes
The claims and statistics of this paper haven’t been checked yet.
Run the check — free, no account needed. It reads the open-access text and checks the sources it cites.
Claims other papers make about this one
Each is checked against this paper’s own text: does it say what the citing paper says it does?
In the citing paper
“Specialty-specific foundation models20,21,23 typically focus on single imaging modalities”
From A Multimodal Vision Foundation Model for Clinical Dermatology (2025) · cites this paper as [20]
In the citing paper
“The scaling behavior observed in PanDerm’s performance aligns with recent foundation model trends20,22,23,59”
From A Multimodal Vision Foundation Model for Clinical Dermatology (2025) · cites this paper as [20]
In the citing paper
“Foundation models reduce the data requirements for specialized tasks, for example in predicting diseases from retinal photographs17.”
From Large language models and multimodal foundation models for precision oncology (2024) · cites this paper as [17]
Self-check
Percentages, sums and reported differences re-computed from the paper’s own numbers.
The self-check needs the paper’s full text.
Citations
Cites
ImageNet: A large-scale hierarchical image database
Deng, J., Dong, W., Socher, R., Li, L.-J., Li, K., & Fei-Fei, L. (2009) · 2009 IEEE Conference on Computer Vision and Pattern Recognition · doi:10.1109/cvpr.2009.5206848 · Cited by 65,333
Grad-CAM: Visual Explanations from Deep Networks via Gradient-Based Localization
Selvaraju, R. R., Cogswell, M., Das, A., Vedantam, R., Parikh, D., & Batra, D. (2017) · 2017 IEEE International Conference on Computer Vision (ICCV) · doi:10.1109/iccv.2017.74 · Cited by 24,513
Dermatologist-level classification of skin cancer with deep neural networks
Esteva, A., Kuprel, B., Novoa, R. A., Ko, J., Swetter, S. M., Blau, H. M., & Thrun, S. (2017) · Nature · doi:10.1038/nature21056 · Cited by 14,362
High-performance medicine: the convergence of human and artificial intelligence
Topol, E. J. (2019) · Nature Medicine · doi:10.1038/s41591-018-0300-7 · Cited by 10,450
Self-citationThe UK Biobank resource with deep phenotyping and genomic data
Bycroft, C., Freeman, C., Petkova, D., Band, G., Elliott, L. T., Sharp, K., Motyer, A., Vukcevic, D., Delaneau, O., O’Connell, J., et al. (2018) · Nature · doi:10.1038/s41586-018-0579-z · Cited by 8,876
Self-citationMasked Autoencoders Are Scalable Vision Learners
He, K., Chen, X., Xie, S., Li, Y., Dollar, P., & Girshick, R. (2022) · 2022 IEEE/CVF Conference on Computer Vision and Pattern Recognition (CVPR) · doi:10.1109/cvpr52688.2022.01553 · Cited by 8,489 · cited 1×
“Besides this label efficiency, SSL-based models perform better than supervised models when tested on new data from different domains 15,16 .”
MethodGulshan, V., Peng, L., Coram, M., Stumpe, M. C., Wu, D., Narayanaswamy, A., Venugopalan, S., Widner, K., Madams, T., Cuadros, J., et al. (2016) · JAMA · doi:10.1001/jama.2016.17216 · Cited by 7,697
Emerging Properties in Self-Supervised Vision Transformers
Caron, M., Touvron, H., Misra, I., Jegou, H., Mairal, J., Bojanowski, P., & Joulin, A. (2021) · 2021 IEEE/CVF International Conference on Computer Vision (ICCV) · doi:10.1109/iccv48922.2021.00951 · Cited by 5,638 · cited 1×
“All task performances are evaluated by the classification metrics known as AUROC and AUPR, computed from the receiver operating characteristics and precision-recall curves of classifiers, respectively.”
MethodIdentifying Medical Diagnoses and Treatable Diseases by Image-Based Deep Learning
Kermany, D. S., Goldbaum, M., Cai, W., Valentim, C. C. S., Liang, H., Baxter, S. L., McKeown, A., Yang, G., Wu, X., Yan, F., et al. (2018) · Cell · doi:10.1016/j.cell.2018.02.010 · Cited by 4,842
Large Language Models Encode Clinical Knowledge
Singhal, K., Azizi, S., Tu, T., Mahdavi, S. S., Wei, J., Chung, H. W., Scales, N., Tanwani, A., Cole-Lewis, H., Pfohl, S., et al. (2022) · arXiv · doi:10.48550/arxiv.2212.13138 · Cited by 4,083
Large language models encode clinical knowledge
Singhal, K., Azizi, S., Tu, T., Mahdavi, S. S., Wei, J., Chung, H. W., Scales, N., Tanwani, A., Cole-Lewis, H., Pfohl, S., et al. (2023) · Nature · doi:10.1038/s41586-023-06291-2 · Cited by 4,083
Rajpurkar, P., Chen, E., Banerjee, O., & Topol, E. J. (2022) · Nature Medicine · doi:10.1038/s41591-021-01614-0 · Cited by 3,212
Self-citationArtificial intelligence in healthcare
Yu, K.-H., Beam, A. L., & Kohane, I. S. (2018) · Nature Biomedical Engineering · doi:10.1038/s41551-018-0305-z · Cited by 2,817
On the Opportunities and Risks of Foundation Models
Bommasani, R., Hudson, D. A., Adeli, E., Altman, R., Arora, S., von Arx, S., Bernstein, M. S., Bohg, J., Bosselut, A., Brunskill, E., et al. (2021) · arXiv · doi:10.48550/arxiv.2108.07258 · Cited by 2,676
Clinically applicable deep learning for diagnosis and referral in retinal disease
De Fauw, J., Ledsam, J. R., Romera-Paredes, B., Nikolov, S., Tomasev, N., Blackwell, S., Askham, H., Glorot, X., O’Donoghue, B., Visentin, D., et al. (2018) · Nature Medicine · doi:10.1038/s41591-018-0107-6 · Cited by 2,639
Self-citationUnsupervised Visual Representation Learning by Context Prediction
Doersch, C., Gupta, A., & Efros, A. A. (2015) · 2015 IEEE International Conference on Computer Vision (ICCV) · doi:10.1109/iccv.2015.167 · Cited by 2,629
Unsupervised Learning of Visual Features by Contrasting Cluster Assignments
Caron, M., Misra, I., Mairal, J., Goyal, P., Bojanowski, P., & Joulin, A. (2020) · arXiv · doi:10.48550/arxiv.2006.09882 · Cited by 2,499
Self-Supervised Visual Feature Learning With Deep Neural Networks: A Survey
Jing, L., & Tian, Y. (2021) · IEEE Transactions on Pattern Analysis and Machine Intelligence · doi:10.1109/tpami.2020.2992393 · Cited by 2,036
Foundation models for generalist medical artificial intelligence
Moor, M., Banerjee, O., Abad, Z. S. H., Krumholz, H. M., Leskovec, J., Topol, E. J., & Rajpurkar, P. (2023) · Nature · doi:10.1038/s41586-023-05881-4 · Cited by 2,028
Self-citationLiu, X., Faes, L., Kale, A. U., Wagner, S. K., Fu, D. J., Bruynseels, A., Mahendiran, T., Moraes, G., Shamdas, M., Kern, C., et al. (2019) · The Lancet Digital Health · doi:10.1016/s2589-7500(19)30123-2 · Cited by 1,883
Self-citationToward expert-level medical question answering with large language models
Singhal, K., Tu, T., Gottweis, J., Sayres, R., Wulczyn, E., Amin, M., Hou, L., Clark, K., Pfohl, S. R., Cole-Lewis, H., et al. (2025) · Nature Medicine · doi:10.1038/s41591-024-03423-7 · Cited by 1,734
An Empirical Study of Training Self-Supervised Vision Transformers
Chen, X., Xie, S., & He, K. (2021) · 2021 IEEE/CVF International Conference on Computer Vision (ICCV) · doi:10.1109/iccv48922.2021.00950 · Cited by 1,648
FEEDBACK ON A PUBLICLY DISTRIBUTED IMAGE DATABASE: THE MESSIDOR DATABASE
Decencière, É., Zhang, X., Cazuguel, G., Laÿ, B., Cochener, B., Trone, C., Gain, P., Ordonez, R., Massin, P., Erginay, A., et al. (2014) · Image Analysis & Stereology · doi:10.5566/ias.1155 · Cited by 1,433
Preparing Medical Imaging Data for Machine Learning
Willemink, M. J., Koszek, W. A., Hardell, C., Wu, J., Fleischmann, D., Harvey, H., Folio, L. R., Summers, R. M., Rubin, D. L., & Lungren, M. P. (2020) · Radiology · doi:10.1148/radiol.2020192224 · Cited by 1,020
Transformer Interpretability Beyond Attention Visualization
Chefer, H., Gur, S., & Wolf, L. (2021) · 2021 IEEE/CVF Conference on Computer Vision and Pattern Recognition (CVPR) · doi:10.1109/cvpr46437.2021.00084 · Cited by 903
Wong, T. Y., & Mitchell, P. (2004) · New England Journal of Medicine · doi:10.1056/nejmra032865 · Cited by 703
Self-supervised learning in medicine and healthcare
Krishnan, R., Rajpurkar, P., & Topol, E. J. (2022) · Nature Biomedical Engineering · doi:10.1038/s41551-022-00914-1 · Cited by 605
Self-citationKrause, J., Gulshan, V., Rahimy, E., Karth, P., Widner, K., Corrado, G. S., Peng, L., & Webster, D. R. (2018) · Ophthalmology · doi:10.1016/j.ophtha.2018.01.034 · Cited by 564
Automated Analysis of Retinal Images for Detection of Referable Diabetic Retinopathy
Abràmoff, M. D., Folk, J. C., Han, D. P., Walker, J. D., Williams, D. F., Russell, S. R., Massin, P., Cochener, B., Gain, P., Tang, L., et al. (2013) · JAMA Ophthalmology · doi:10.1001/jamaophthalmol.2013.1743 · Cited by 474
Tiu, E., Talius, E., Patel, P., Langlotz, C. P., Ng, A. Y., & Rajpurkar, P. (2022) · Nature Biomedical Engineering · doi:10.1038/s41551-022-00936-9 · Cited by 442
Self-citationIDRiD: Diabetic Retinopathy – Segmentation and Grading Challenge
Porwal, P., Pachade, S., Kokare, M., Deshmukh, G., Son, J., Bae, W., Liu, L., Wang, J., Liu, X., Gao, L., et al. (2019) · Medical Image Analysis · doi:10.1016/j.media.2019.101561 · Cited by 377
Self-citationCen, L., Ji, J., Lin, J., Ju, S.-T., Lin, H.-J., Li, T.-P., Wang, Y., Yang, J.-F., Liu, Y.-F., Tan, S., et al. (2021) · Nature Communications · doi:10.1038/s41467-021-25138-w · Cited by 377
Meta-analysis: Retinal Vessel Caliber and Risk for Coronary Heart Disease
McGeechan, K., Liew, G., Macaskill, P., Irwig, L., Klein, R., Klein, B. E. K., Wang, J. J., Mitchell, P., Vingerling, J. R., deJong, P. T. V. M., et al. (2009) · Annals of Internal Medicine · doi:10.7326/0003-4819-151-6-200909150-00005 · Cited by 342
Towards Expert-Level Medical Question Answering with Large Language Models
Singhal, K., Tu, T., Gottweis, J., Sayres, R., Wulczyn, E., Hou, L., Clark, K., Pfohl, S., Cole-Lewis, H., Neal, D., et al. (2023) · arXiv · doi:10.48550/arxiv.2305.09617 · Cited by 338
Insights into Systemic Disease through Retinal Imaging-Based Oculomics
Wagner, S. K., Fu, D. J., Faes, L., Liu, X., Huemer, J. C., Khalid, H., Ferraz, D., Korot, E., Kelly, C. J., Balaskas, K., et al. (2020) · Translational Vision Science & Technology · doi:10.1167/tvst.9.2.6 · Cited by 328
Self-citationRetinal Vessel Diameters and Their Associations with Age and Blood Pressure
Wong, T. Y., Klein, R., Klein, B. E. K., Meuer, S. M., & Hubbard, L. D. (2003) · Investigative Ophthalmology & Visual Science · doi:10.1167/iovs.03-0079 · Cited by 322
Cheung, C. Y.-L., Xu, D., Cheng, C., Sabanayagam, C., Tham, Y. C., Yu, M., Rim, T. H., Chai, C. Y., Gopinath, B., Mitchell, P. L. R., et al. (2020) · Nature Biomedical Engineering · doi:10.1038/s41551-020-00626-4 · Cited by 311
Robust and data-efficient generalization of self-supervised machine learning for diagnostic imaging
Azizi, S., Culp, L., Freyberg, J., Mustafa, B., Baur, S., Kornblith, S., Chen, T., Tomasev, N., Mitrović, J., Strachan, P., et al. (2023) · Nature Biomedical Engineering · doi:10.1038/s41551-023-01049-7 · Cited by 250
A deep learning model for the detection of both advanced and early glaucoma using fundus photography
Ahn, J. M., Kim, S., Ahn, K.-S., Cho, S., Lee, K. B., & Kim, U. S. (2018) · PLoS ONE · doi:10.1371/journal.pone.0207982 · Cited by 248
Association of Retinal Nerve Fiber Layer Thinning With Current and Future Cognitive Decline
Ko, F., Muthy, Z. A., Gallacher, J., Sudlow, C. L. M., Rees, G. E., Yang, Q., Keane, P. A., Petzold, A., Khaw, P. T., Reisman, C. A., et al. (2018) · JAMA Neurology · doi:10.1001/jamaneurol.2018.1578 · Cited by 247
Self-citationAssociation of Retinal Neurodegeneration on Optical Coherence Tomography With Dementia
Mutlu, Ü., Colijn, J. M., Ikram, M. A., Bonnemaijer, P. W. M., Licher, S., Wolters, F. J., Tiemeier, H. W., Koudstaal, P. J., Klaver, C. C. W., & Ikram, M. K. (2018) · JAMA Neurology · doi:10.1001/jamaneurol.2018.1563 · Cited by 247
Sung, K. R., Wollstein, G., Bilonick, R. A., Townsend, K. A., Ishikawa, H., Kagemann, L. E., Noecker, R. J., Fujimoto, J. G., & Schuman, J. S. (2009) · Ophthalmology · doi:10.1016/j.ophtha.2009.01.004 · Cited by 228
OCTID: Optical coherence tomography image database
Gholami, P., Roy, P., Parthasarathy, M. K., & Lakshminarayanan, V. (2019) · Computers & Electrical Engineering · doi:10.1016/j.compeleceng.2019.106532 · Cited by 195
Thomson, K. L., Yeo, J. M., Waddell, B., Cameron, J. R., & Pal, S. (2015) · Alzheimer s & Dementia Diagnosis Assessment & Disease Monitoring · doi:10.1016/j.dadm.2015.03.001 · Cited by 193
Retinal vessel diameters and function in cardiovascular risk and disease
Hanssen, H., Streese, L., & Vilser, W. (2022) · Progress in Retinal and Eye Research · doi:10.1016/j.preteyeres.2022.101095 · Cited by 166
AutoMorph: Automated Retinal Vascular Morphology Quantification Via a Deep Learning Pipeline
Zhou, Y., Wagner, S. K., Chia, M. A., Zhao, A., Woodward-Court, P., Xu, M., Struyven, R., Alexander, D. C., & Keane, P. A. (2022) · Translational Vision Science & Technology · doi:10.1167/tvst.11.7.12 · Cited by 162
Self-citationKovalyk, O., Morales‐Sánchez, J., Verdú‐Monedero, R., Sellés-Navarro, I., Palazón-Cabanes, A., & Sancho‐Gómez, J. (2022) · Scientific Data · doi:10.1038/s41597-022-01388-1 · Cited by 160
Self-Supervised Feature Learning via Exploiting Multi-Modal Data for Retinal Disease Diagnosis
Li, X., Jia, M. J., Islam, M. T., Yu, L., & Xing, L. (2020) · IEEE Transactions on Medical Imaging · doi:10.1109/tmi.2020.3008871 · Cited by 150
Predicting myocardial infarction through retinal scans and minimal personal information
Diaz‐Pinto, A., Ravikumar, N., Attar, R., Suinesiaputra, A., Zhao, Y., Levelt, E., Dall’Armellina, E., Lorenzi, M., Chen, Q., Keenan, T. D. L., et al. (2022) · Nature Machine Intelligence · doi:10.1038/s42256-021-00427-7 · Cited by 107
Ayhan, M. S., Kuehlewein, L., Aliyeva, G., INHOFFEN, W., Ziemssen, F., & Berens, P. (2020) · Medical Image Analysis · doi:10.1016/j.media.2020.101724 · Cited by 90
Self-citationHolmberg, O., Köhler, N., Martins, T. G. D. S., Siedlecki, J., Herold, T., Keidel, L. F., Asani, B., Schiefelbein, J. B., Priglinger, S. G., Kortuem, K., et al. (2020) · Nature Machine Intelligence · doi:10.1038/s42256-020-00247-1 · Cited by 88
On the Opportunities and Risks of Foundation Models for Natural Language Processing in Radiology
Wiggins, W. F., & Tejani, A. S. (2022) · Radiology Artificial Intelligence · doi:10.1148/ryai.220119 · Cited by 87
Robust and Efficient Medical Imaging with Self-SupervisionPreprint
Azizi, S., Culp, L., Freyberg, J., Mustafa, B., Baur, S., Kornblith, S., Chen, T., MacWilliams, P., Mahdavi, S. S., Wulczyn, E., et al. (2022) · arXiv (Cornell University) · doi:10.48550/arxiv.2205.09723 · Cited by 79
Impaired Retinal Vessel Dilation Predicts Mortality in End-Stage Renal Disease
Günthner, R., Hanssen, H., Hauser, C., Angermann, S., Lorenz, G., Kemmner, S., Matschkal, J., Braunisch, M. C., Küchle, C., Renders, L., et al. (2019) · Circulation Research · doi:10.1161/circresaha.118.314318 · Cited by 64
Wagner, S. K., Hughes, F., Cortina‐Borja, M., Pontikos, N., Struyven, R., Liu, X., Montgomery, H., Alexander, D. C., Topol, E. J., Petersen, S. E., et al. (2022) · BMJ Open · doi:10.1136/bmjopen-2021-058552 · Cited by 63
Self-citationBurlina, P., Paul, W., Liu, T. Y. A., & Bressler, N. M. (2021) · JAMA Ophthalmology · doi:10.1001/jamaophthalmol.2021.5557 · Cited by 37
Self-citationAyhan, M. S., Kuehlewein, L., Aliyeva, G., et al. (2019) · medRxiv · doi:10.1101/19002154 · Cited by 9
Self-citationAutoMorph: Automated Retinal Vascular Morphology Quantification via a Deep Learning PipelinePreprint
Zhou, Y., Wagner, S. K., Chia, M. A., et al. (2022) · medRxiv · doi:10.1101/2022.05.26.22274795 · Cited by 9
Self-citation
Research works printed but not linked: 5
- Chen, T., Kornblith, S., Swersky, K., Norouzi, M. & Hinton, G. Big self-supervised models are strong semi-supervised learners. In Proc. 34th International Conference on Neural Information Processing Systems (ed. Ranzato, M.) 22243–22255 (Neurips, 2020).
- Chen, T., Kornblith, S., Norouzi, M. & Hinton, G. A simple framework for contrastive learning of visual representations. In Proc. 37th International Conference on Machine Learning (eds Iii, H. D. & Singh, A.) 1597–1607 (PMLR, 2020).
- Truong, T., Mohammadi, S. & Lenga, M. How transferable are self-supervised features in medical image classification tasks? In Proc. 2021 Machine Learning for Health (eds Roy, S. et al.) 54–74 (PMLR, 2021)
- Guo, C., Pleiss, G., Sun, Y. & Weinberger, K. Q. On calibration of modern neural networks. In Proc. 34th International Conference on Machine Learning (eds Precup, D. & Teh, Y. W.) Vol. 70, 1321–1330 (PMLR, 2017).
- Dosovitskiy, A. et al. An image is worth 16×16 words: transformers for image recognition at scale. In Proc. 9th International Conference on Learning Representations (eds Hofmann, K. et al.) https://openreview.net/forum?id=YicbFdNTTy (ICLR 2021).
Cited by
Sorted by citations
A whole-slide foundation model for digital pathology from real-world data
Xu, H., Usuyama, N., Bagga, J., Zhang, S., Rao, R., Naumann, T., Wong, C., Gero, Z., González, J., Gu, Y., et al. (2024) · Nature · doi:10.1038/s41586-024-07441-w · Cited by 921
A pathology foundation model for cancer diagnosis and prognosis prediction
Wang, X., Zhao, J., Marostica, E., Yuan, W., Jin, J., Zhang, J., Li, R., Tang, H., Wang, K., Li, Y., et al. (2024) · Nature · doi:10.1038/s41586-024-07894-z · Cited by 580
A deep learning system for predicting time to progression of diabetic retinopathy
Dai, L., Sheng, B., Chen, T., Wu, Q., Liu, R., Cai, C., Wu, L., Yang, D., Hamzah, H., Liu, Y., et al. (2024) · Nature Medicine · doi:10.1038/s41591-023-02702-z · Cited by 339
Self-citationJoshi, G., Jain, A., Araveeti, S. R., Adhikari, S., Garg, H., & Bhandari, M. (2024) · Electronics · doi:10.3390/electronics13030498 · Cited by 294
On the challenges and perspectives of foundation models for medical image analysis
Zhang, S., & Metaxas, D. (2023) · Medical Image Analysis · doi:10.1016/j.media.2023.102996 · Cited by 340
Metadata
- Authors
- Zhou, Y., Chia, M. A., Wagner, S. K., Ayhan, M. S., Williamson, D. J., Struyven, R. R., Liu, T., Xu, M., Lozano, M. G., Woodward-Court, P., Kihara, Y., UK Biobank Eye & Vision Consortium, Allen, N., Gallacher, J. E. J., Littlejohns, T., Aslam, T., Bishop, P., Black, G., Sergouniotis, P., Atan, D., Dick, A. D., Williams, C., Barman, S., Barrett, J. H., Mackie, S., Braithwaite, T., Carare, R. O., Ennis, S., Gibson, J., Lotery, A. J., Self, J., Chakravarthy, U., Hogg, R. E., Paterson, E., Woodside, J., Peto, T., Mckay, G., Mcguinness, B., Foster, P. J., Balaskas, K., Khawaja, A. P., Pontikos, N., Rahi, J. S., Lascaratos, G., Patel, P. J., Chan, M., Chua, S. Y. L., Day, A., Desai, P., Egan, C., Fruttiger, M., Garway-Heath, D. F., Hardcastle, A., Khaw, S. P. T., Moore, T., Sivaprasad, S., Strouthidis, N., Thomas, D., Tufail, A., Viswanathan, A. C., Dhillon, B., Macgillivray, T., Sudlow, C., Vitart, V., Doney, A., Trucco, E., Guggeinheim, J. A., Morgan, J. E., Hammond, C. J., Williams, K., Hysi, P., Harding, S. P., Zheng, Y., Luben, R., Luthert, P., Sun, Z., McKibbin, M., O’Sullivan, E., Oram, R., Weedon, M., Owen, C. G., Rudnicka, A. R., Sattar, N., Steel, D., Stratton, I., Tapp, R., Yates, M. M., Petzold, A., Madhusudhan, S., Altmann, A., Lee, A. Y., Topol, E. J., Denniston, A. K., Alexander, D. C., & Keane, P. A.
- Affiliations
- Moorfields Eye Hospital NHS Foundation Trust (GB)
- University College London (GB)
- Universidade da Coruña (ES)
- University of Washington (US)
- University of Oxford (GB)
- University of Manchester (GB)
- University of Bristol (GB)
- Kingston University London (GB)
- University of Leeds (GB)
- St Thomas' Hospital (GB)
- University of Southampton (GB)
- Queen's University Belfast (GB)
- University of Edinburgh (GB)
- University of Dundee (GB)
- Cardiff University (GB)
- King's College London (GB)
- University of Liverpool (GB)
- Leeds Teaching Hospitals NHS Trust (GB)
- King's College Hospital NHS Foundation Trust (GB)
- University of Exeter (GB)
- University of London (GB)
- University of Glasgow (GB)
- Newcastle University (GB)
- Gloucestershire Hospitals NHS Foundation Trust (GB)
- St George's, University of London (GB)
- University of East Anglia (GB)
- UCL Queen Square Institute of Neurology (GB)
- Royal Liverpool University Hospital (GB)
- University Hospitals Birmingham NHS Foundation Trust (GB)
- Corresponding author
- Zhou, Yukun
- Keane, Pearse A.
- ORCID
- Zhou, Yukun
- Chia, Mark A.
- Wagner, Siegfried K.
- Ayhan, Murat S.
- Williamson, Dominic J.
- Struyven, Robbert R.
- Liu, Timing
- Xu, Moucheng
- Lozano, Mateo G.
- Woodward-Court, Peter
- Kihara, Yuka
- Allen, Naomi
- Gallacher, John E. J.
- Littlejohns, Thomas
- Aslam, Tariq
- Black, Graeme
- Sergouniotis, Panagiotis
- Atan, Denize
- Dick, Andrew D.
- Williams, Cathy
- Barman, Sarah
- Mackie, Sarah
- Braithwaite, Tasanee
- Carare, Roxana O.
- Ennis, Sarah
- Lotery, Andrew J.
- Self, Jay
- Chakravarthy, Usha
- Hogg, Ruth E.
- Paterson, Euan
- Woodside, Jayne
- Mckay, Gareth
- Mcguinness, Bernadette
- Foster, Paul J.
- Balaskas, Konstantinos
- Khawaja, Anthony P.
- Pontikos, Nikolas
- Rahi, Jugnoo S.
- Lascaratos, Gerassimos
- Patel, Praveen J.
- Chan, Michelle
- Chua, Sharon Y. L.
- Day, Alexander
- Desai, Parul
- Fruttiger, Marcus
- Hardcastle, Alison
- Moore, Tony
- Sivaprasad, Sobha
- Strouthidis, Nicholas
- Thomas, Dhanes
- Tufail, Adnan
- Viswanathan, Ananth C.
- Dhillon, Bal
- Macgillivray, Tom
- Sudlow, Cathie
- Trucco, Emanuele
- Williams, Katie
- Hysi, Pirro
- Harding, Simon P.
- Zheng, Yalin
- Luben, Robert
- Sun, Zihan
- McKibbin, Martin
- Oram, Richard
- Rudnicka, Alicja R.
- Sattar, Naveed
- Steel, David
- Stratton, Irene
- Tapp, Robyn
- Yates, Max M.
- Petzold, Axel
- Madhusudhan, Savita
- Altmann, Andre
- Lee, Aaron Y.
- Topol, Eric J.
- Denniston, Alastair K.
- Alexander, Daniel C.
- Keane, Pearse A.
- Venue
- Nature
- Published
- 2023-09-13
- Volume
- 622
- Issue
- 7981
- Pages
- 156-163
- ISSN
- 0028-0836 (ISSN-L)
- 1476-4687
- PMC
- PMC10550819
- OpenAlex
- W4386697749
- Cited by
- 1,014
- References
- 55
- Citations by year
- 2026: 388 · 2025: 389 · 2024: 214 · 2023: 21
- FWCI
- 166.84
- Type
- journal article
- Language
- en
- Open access
- hybrid
- doi.org
- Locations
- Nature (publishedVersion, cc-by)
- PubMed Central (publishedVersion, cc-by)
- PubMed (publishedVersion)
- Discovery Research Portal (University of Dundee) (publishedVersion, cc-by)
- Pure Amsterdam UMC (publishedVersion, cc-by)
- Amsterdam UMC (VU Amsterdam) - Institutional Repository (publishedVersion, other-oa)
- Research Portal (Queen's University Belfast) (publishedVersion, cc-by)
- Explore Bristol Research (publishedVersion, cc-by)
- ORCA Online Research @Cardiff (Cardiff University) (acceptedVersion)
- ePrints Soton (University of Southampton) (acceptedVersion)
- RePEc: Research Papers in Economics (submittedVersion)
- UCL Discovery (University College London) (submittedVersion)
- University of Birmingham Research Portal (University of Birmingham) (submittedVersion, other-oa)
- RUC (Universidade Da Coruña) (submittedVersion, cc-by)
- RUNA. Repositorio Institucional del Sergas (Servicio Gallego de Salud (SERGAS)) (submittedVersion, cc-by)
- Newcastle University ePrints (Newcastle Univesity) (cc-by)
- Funders
- National Institute for Health and Care Research (NIHR205103, NF-SI-0515-10020, NIHR205096, NIHR205109)
- University College London Hospitals NHS Foundation Trust
- Moorfields Eye Hospital NHS Foundation Trust
- Moorfields Eye Charity (R190028A)
- Medical Research Council (MR/K003364/1, MR/TR000953/1, MC_UU_00007/10, MR/T019050/1)
- Engineering and Physical Sciences Research Council (EP/M020533/1, EP/V034537/1, M020533/1, M020533, EP/R014019/1, V034537, R014019)
- Topics
- Health Sciences › Medicine › Radiology, Nuclear Medicine and Imaging › Retinal Imaging and Analysis
- Health Sciences › Medicine › Ophthalmology › Ophthalmology and Visual Health Research
- Health Sciences › Medicine › Health Informatics › Artificial Intelligence in Healthcare and Education
- Keywords
- RETFound, foundation models, fundus images, self-supervised learning, eye disease detection, heart failure, myocardial infarction, artificial intelligence in healthcare, annotation workload reduction
- MeSH terms
- Supervised Machine Learning, Artificial Intelligence, Eye Diseases, Heart Failure, Humans, Myocardial Infarction, Retina
About these checks
Registry, retraction, Cites and statistics results are computed, not judged, with one exception: a printed reference that no index lists is read once by a model before it counts as a citation error. Claims are extracted by a model and kept only when their quote appears verbatim in the text; each cited source is then checked, with a model’s help, for whether it says what the claim relies on. Those verdicts can be wrong — read the claim’s quote and the cited source before relying on one.
Statistics and arithmetic are recomputed, not judged.
Confidence bands are shown only for fields calibrated on our annotated test set. None is calibrated yet, so no band is shown.
What counts as a claim ›How we measure confidence ›How we check this ›
Are you an author, or do you see a problem with this page? Request a review
