Cited by 129

The DOI matches its Crossref record; 15 of the 15 references it cites were found in a registry or an index.

Identification of constrained sequence elements across 239 primate genomes

Kuderna, Lukas F. K., Ulirsch, Jacob C., Rashid, Sabrina, Ameen, Mohamed, Sundaram, Laksshman, Hickey, Glenn, Cox, Anthony J., Gao, Hong, Kumar, Arvind, Aguet, Francois, Christmas, Matthew J., Clawson, Hiram, Haeussler, Maximilian, Janiak, Mareike C., Kuhlwilm, Martin, Orkin, Joseph D., Bataillon, Thomas, Manu, Shivakumara, Valenzuela, Alejandro, Bergman, Juraj, Rouselle, Marjolaine, Silva, Felipe Ennes, Agueda, Lidia, Blanc, Julie, Gut, Marta, de Vries, Dorien, Goodhead, Ian, Harris, R. Alan, Raveendran, Muthuswamy, Jensen, Axel, Chuma, Idriss S., Horvath, Julie E., Hvilsom, Christina, Juan, David, Frandsen, Peter, Schraiber, Joshua G., de Melo, Fabiano R., Bertuol, Fabrício, Byrne, Hazel, Sampaio, Iracilda, Farias, Izeni, Valsecchi, João, Messias, Malu, da Silva, Maria N. F., Trivedi, Mihir, Rossi, Rogerio, Hrbek, Tomas, Andriaholinirina, Nicole, Rabarivola, Clément J., Zaramody, Alphonse, Jolly, Clifford J., Phillips-Conroy, Jane, Wilkerson, Gregory, Abee, Christian, Simmons, Joe H., Fernandez-Duque, Eduardo, Kanthaswamy, Sree, Shiferaw, Fekadu, Wu, Dongdong, Zhou, Long, Shao, Yong, Zhang, Guojie, Keyyu, Julius D., Knauf, Sascha, Le, Minh D., Lizano, Esther, Merker, Stefan, Navarro, Arcadi, Nadler, Tilo, Khor, Chiea Chuen, Lee, Jessica, Tan, Patrick, Lim, Weng Khong, Kitchener, Andrew C., Zinner, Dietmar, Gut, Ivo, Melin, Amanda D., Guschanski, Katerina, Schierup, Mikkel Heide, Beck, Robin M. D., Karakikes, Ioannis, Wang, Kevin C., Umapathy, Govindhaswamy, Roos, Christian, Boubli, Jean P., Siepel, Adam, Kundaje, Anshul, Paten, Benedict, Lindblad-Toh, Kerstin, Rogers, Jeffrey, Marques Bonet, Tomas, Farh, Kyle Kai-How·2024·Nature

Abstract

Noncoding DNA is central to our understanding of human gene regulation and complex diseases 1,2 , and measuring the evolutionary sequence constraint can establish the functional relevance of putative regulatory elements in the human genome 3–9 . Identifying the genomic elements that have become constrained specifically in primates has been hampered by the faster evolution of noncoding DNA compared to protein-coding DNA 10 , the relatively short timescales separating primate species 11 , and the previously limited availability of whole-genome sequences 12 . Here we construct a whole-genome alignment of 239 species, representing nearly half of all extant species in the primate order. Using this resource, we identified human regulatory elements that are under selective constraint across primates and other mammals at a 5% false discovery rate. We detected 111,318 DNase I hypersensitivity sites and 267,410 transcription factor binding sites that are constrained specifically in primates but not across other placental mammals and validate their cis -regulatory effects on gene expression. These regulatory elements are enriched for human genetic variants that affect gene expression and complex traits and diseases. Our results highlight the important role of recent evolution in regulatory sequence elements differentiating primates, including humans, from other placental mammals.

Overview

The claims and statistics of this paper haven’t been checked yet.

Run the check — free, no account needed. It reads the open-access text and checks the sources it cites.

A few free checks a day · papers already verified open instantly · results are public

Integrity signals

Registry

Crossref · 10.1038/s41586-023-06798-8

Cites

15 of 15 references verified0 citation errors · 0 not checkable

Statistics

Figures

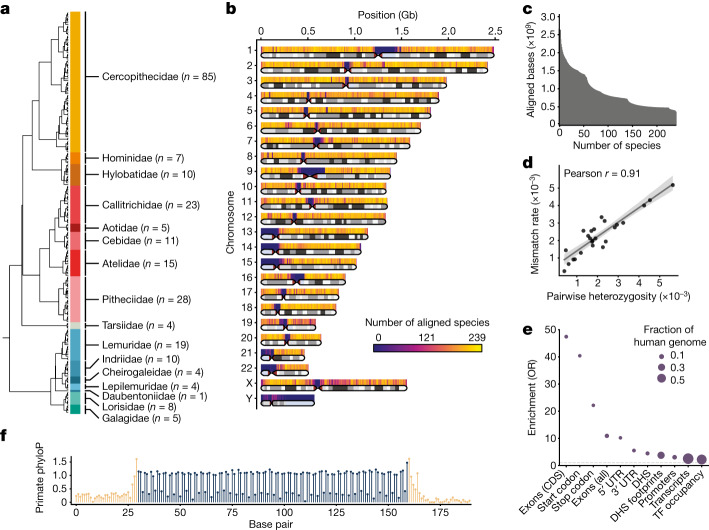
Fig. 1 MSA of 239 primate species. a, Cladogram of primate species included in the MSA. The number of sampled species per family is given in parenthesis. b, Ideogram of the human genome depicting the average number of species covered by the MSA at 500-kb resolution. Telomeric, centromeric and heterochromatic regions (light blue) are indicated. c, Cumulative primate species coverage of the human genome in the 239-way primate MSA. d, Per-base mismatch rate between newly generated short-read contigs and species with previously published high-quality reference assemblies. A linear regression fit with a corresponding 95% confidence interval ribbon is shown. e, Enrichment of primate phastCons elements for coding and noncoding genomic elements. The size of the circle represents the fraction of the human genome. The dashed grey line indicates an odds ratio (OR) of 1. CDS, coding sequence; TF, transcription factor; UTR, untranslated region. (f) Codon periodicity in the mean primate phyloP scores across 482 protein-coding exons exactly 130 nucleotides in length. Coding sequences are shown in dark blue and flanking intronic sequences in beige.
Fig. 1 MSA of 239 primate species. a, Cladogram of primate species included in the MSA. The number of sampled species per family is given in parenthesis. b, Ideogram of the human genome depicting the average number of species covered by the MSA at 500-kb resolution. Telomeric, centromeric and heterochromatic regions (light blue) are indicated. c, Cumulative primate species coverage of the human genome in the 239-way primate MSA. d, Per-base mismatch rate between newly generated short-read contigs and species with previously published high-quality reference assemblies. A linear regression fit with a corresponding 95% confidence interval ribbon is shown. e, Enrichment of primate phastCons elements for coding and noncoding genomic elements. The size of the circle represents the fraction of the human genome. The dashed grey line indicates an odds ratio (OR) of 1. CDS, coding sequence; TF, transcription factor; UTR, untranslated region. (f) Codon periodicity in the mean primate phyloP scores across 482 protein-coding exons exactly 130 nucleotides in length. Coding sequences are shown in dark blue and flanking intronic sequences in beige.CC BY · PubMed Central
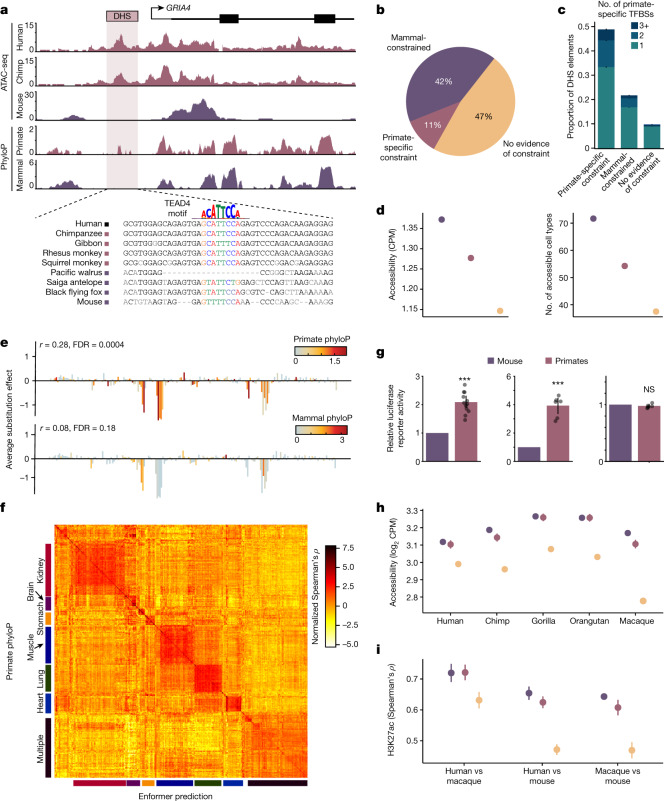
Fig. 2 Identification of noncoding regulatory elements with primate-specific constraint. a, Example of a primate-specific constrained DHS element in the GRIA4 locus (hg38; chromosome (chr.) 11:105608279–105612792). Assay for transposase-accessible chromatin with sequencing (ATAC-seq) insertions from human, chimpanzee and mouse iPS cells and phyloP constraint in primates and mammals. A putative TEAD4 binding motif that better matches primate sequences than non-primate mammal sequences is indicated. b, Proportion of constrained DHS elements across clades. c, Number of primate-specific constrained footprints (TFBSs) in DHS elements, stratified by constraint across the entire DHS. Error bars represent 95% confidence intervals. d, Average chromatin accessibility and the number of accessible cell types is higher at more constrained DHS elements. Colours indicate constraint categories from b. Error bars represent 95% confidence intervals. CPM, counts per million. e, A saturation mutagenesis experiment (MPRA) of a DHS element at chr. 2:191049304–191045304 (hg38). Average effects of substitutions at each nucleotide on transcriptional activity are correlated with phyloP scores from primates but not from mammals. f, Heat map of normalized correlation values (Spearman’s ρ) between primate phyloP and sequence-based Enformer predictions of regulatory activity across 438 ENCODE cell types. Categories of similar cell types corresponding to specific tissues are indicated. g, Normalized luciferase reporter activity in human iPS cells for three selected sets of primate-specific constrained DHS elements at orthologous primate and mouse sequences. Colours indicate constraint categories from b. Bars represent mean and error bars represent 95% confidence intervals; n = 36 across 3 elements. P values: 1.4 × 10⁻⁵ (left), 2.8 × 10⁻⁴ (middle) and 0.54 (right). Raw data are provided in Supplementary Data 6. h, Average chromatin accessibility in fibroblasts for five primate species at orthologous sequence elements stratified by sequence constraint. Colours indicate constraint categories from b. Error bars represent 95% confidence intervals; n = 90,827 DHS elements. i, Average Spearman ρ of H3K27ac levels at orthologous CREs for three pairs of species. Colours indicate constraint categories from b. Error bars represent 95% confidence intervals. n = 12 for human versus mouse, n = 10 for all other comparisons. ***P < 0.001; NS, not significant.
Fig. 2 Identification of noncoding regulatory elements with primate-specific constraint. a, Example of a primate-specific constrained DHS element in the GRIA4 locus (hg38; chromosome (chr.) 11:105608279–105612792). Assay for transposase-accessible chromatin with sequencing (ATAC-seq) insertions from human, chimpanzee and mouse iPS cells and phyloP constraint in primates and mammals. A putative TEAD4 binding motif that better matches primate sequences than non-primate mammal sequences is indicated. b, Proportion of constrained DHS elements across clades. c, Number of primate-specific constrained footprints (TFBSs) in DHS elements, stratified by constraint across the entire DHS. Error bars represent 95% confidence intervals. d, Average chromatin accessibility and the number of accessible cell types is higher at more constrained DHS elements. Colours indicate constraint categories from b. Error bars represent 95% confidence intervals. CPM, counts per million. e, A saturation mutagenesis experiment (MPRA) of a DHS element at chr. 2:191049304–191045304 (hg38). Average effects of substitutions at each nucleotide on transcriptional activity are correlated with phyloP scores from primates but not from mammals. f, Heat map of normalized correlation values (Spearman’s ρ) between primate phyloP and sequence-based Enformer predictions of regulatory activity across 438 ENCODE cell types. Categories of similar cell types corresponding to specific tissues are indicated. g, Normalized luciferase reporter activity in human iPS cells for three selected sets of primate-specific constrained DHS elements at orthologous primate and mouse sequences. Colours indicate constraint categories from b. Bars represent mean and error bars represent 95% confidence intervals; n = 36 across 3 elements. P values: 1.4 × 10⁻⁵ (left), 2.8 × 10⁻⁴ (middle) and 0.54 (right). Raw data are provided in Supplementary Data 6. h, Average chromatin accessibility in fibroblasts for five primate species at orthologous sequence elements stratified by sequence constraint. Colours indicate constraint categories from b. Error bars represent 95% confidence intervals; n = 90,827 DHS elements. i, Average Spearman ρ of H3K27ac levels at orthologous CREs for three pairs of species. Colours indicate constraint categories from b. Error bars represent 95% confidence intervals. n = 12 for human versus mouse, n = 10 for all other comparisons. ***P < 0.001; NS, not significant.CC BY · PubMed Central
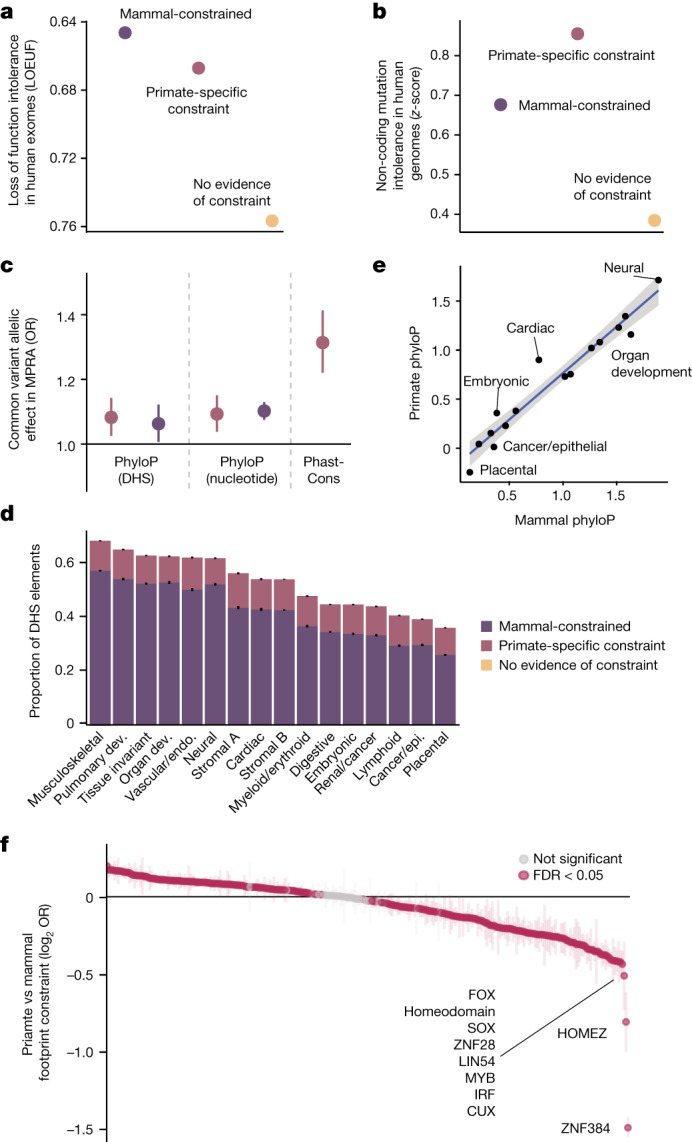
Fig. 3 Characterization of constrained regulatory elements. a, Predicted target genes have fewer loss-of-function mutations in humans than expected at constrained DHS elements. Error bars represent 95% confidence intervals. b, Constrained DHS elements have fewer mutations in human populations than unconstrained elements. Error bars represent 95% confidence intervals. c, Enrichment of allele-specific regulatory activity (MPRA) for 27,023 common variants, stratified by type of constraint. A colour legend for constraint categories is shown in d. Error bars represent 95% confidence intervals, the central dot represents point estimates; n = 27,023 variants. d, Proportion of constrained DHS elements across 16 broad cellular contexts. Error bars represent 95% confidence intervals, centre represents proportion. n = 1,029,688 DHS elements. Dev., development; endo., endothelial; epi., epithelial. e, Scatter plot of mean primate and mammal phyloP scores at DHS elements, stratified by cell types. A linear fit is shown with a corresponding 95% confidence interval ribbon. Putative outlier cell types with higher primate phyloP than mammal phyloP scores are indicated. f, Differences in the proportion of primate and mammalian constrained footprints in human DHS elements, for each of 283 transcription factor family motifs. Positive values indicate a higher proportion of constrained TFBSs in primates, negative values indicate a lower proportion of constrained TFBSs in primates. Transcription factors that are the least constrained in primates compared to mammals are labelled, and significantly different transcription factors are coloured in magenta (FDR < 5%). Error bars represent 95% confidence intervals.
Fig. 3 Characterization of constrained regulatory elements. a, Predicted target genes have fewer loss-of-function mutations in humans than expected at constrained DHS elements. Error bars represent 95% confidence intervals. b, Constrained DHS elements have fewer mutations in human populations than unconstrained elements. Error bars represent 95% confidence intervals. c, Enrichment of allele-specific regulatory activity (MPRA) for 27,023 common variants, stratified by type of constraint. A colour legend for constraint categories is shown in d. Error bars represent 95% confidence intervals, the central dot represents point estimates; n = 27,023 variants. d, Proportion of constrained DHS elements across 16 broad cellular contexts. Error bars represent 95% confidence intervals, centre represents proportion. n = 1,029,688 DHS elements. Dev., development; endo., endothelial; epi., epithelial. e, Scatter plot of mean primate and mammal phyloP scores at DHS elements, stratified by cell types. A linear fit is shown with a corresponding 95% confidence interval ribbon. Putative outlier cell types with higher primate phyloP than mammal phyloP scores are indicated. f, Differences in the proportion of primate and mammalian constrained footprints in human DHS elements, for each of 283 transcription factor family motifs. Positive values indicate a higher proportion of constrained TFBSs in primates, negative values indicate a lower proportion of constrained TFBSs in primates. Transcription factors that are the least constrained in primates compared to mammals are labelled, and significantly different transcription factors are coloured in magenta (FDR < 5%). Error bars represent 95% confidence intervals.CC BY · PubMed Central
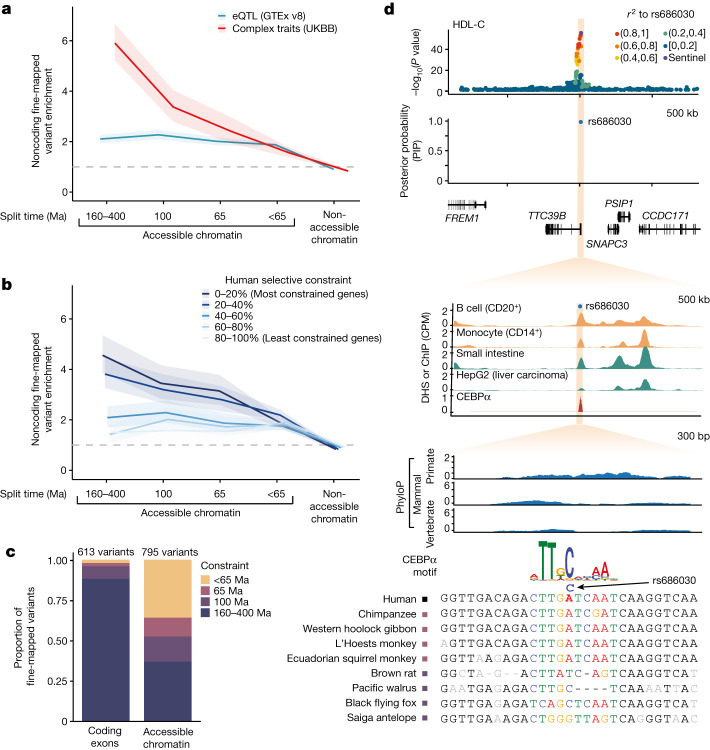
Fig. 4 Enrichment of complex trait variants at constrained noncoding CREs. a, Enrichment of fine-mapped GWAS variants from 96 UK Biobank (UKBB) complex traits and clinical phenotypes (red) or eQTLs for 49 GTEx tissues (blue) in DHS elements, stratified by sequence constraint of the element. Approximate split times for vertebrates (160–400 Ma), placental mammals (100 Ma) and primates (65 Ma) are shown. Enrichments are computed as the ratio of the proportion of variants with PIP > 0.5 compared to the proportion of variants with PIP < 0.01. Ribbons represent 95% confidence intervals and the centre represents the point estimate. The grey dashed line indicates an OR of 1. b, Enrichment of fine-mapped eQTL variants within DHS elements as in a, with genes separated into five bins based on their selective population constraint (LOEUF). Ribbons represent 95% confidence intervals and the centre represents the point estimate. c, Total count of fine-mapped variants for 96 UK Biobank phenotypes in protein-coding exons or accessible chromatin sites, stratified by extent of constraint as in a. d, Example of a fine-mapped variant (rs686030) for HDL-C and cholelithiasis at a primate-specific constrained DHS element. GWAS signal at the locus, fine-mapping probability, DNase signal, CEBPα chromatin immunoprecipitation with sequencing (ChIP–seq) signal, constraint scores and MSAs of primate (blue) and mammal (green) species are shown.
Fig. 4 Enrichment of complex trait variants at constrained noncoding CREs. a, Enrichment of fine-mapped GWAS variants from 96 UK Biobank (UKBB) complex traits and clinical phenotypes (red) or eQTLs for 49 GTEx tissues (blue) in DHS elements, stratified by sequence constraint of the element. Approximate split times for vertebrates (160–400 Ma), placental mammals (100 Ma) and primates (65 Ma) are shown. Enrichments are computed as the ratio of the proportion of variants with PIP > 0.5 compared to the proportion of variants with PIP < 0.01. Ribbons represent 95% confidence intervals and the centre represents the point estimate. The grey dashed line indicates an OR of 1. b, Enrichment of fine-mapped eQTL variants within DHS elements as in a, with genes separated into five bins based on their selective population constraint (LOEUF). Ribbons represent 95% confidence intervals and the centre represents the point estimate. c, Total count of fine-mapped variants for 96 UK Biobank phenotypes in protein-coding exons or accessible chromatin sites, stratified by extent of constraint as in a. d, Example of a fine-mapped variant (rs686030) for HDL-C and cholelithiasis at a primate-specific constrained DHS element. GWAS signal at the locus, fine-mapping probability, DNase signal, CEBPα chromatin immunoprecipitation with sequencing (ChIP–seq) signal, constraint scores and MSAs of primate (blue) and mammal (green) species are shown.CC BY · PubMed Central
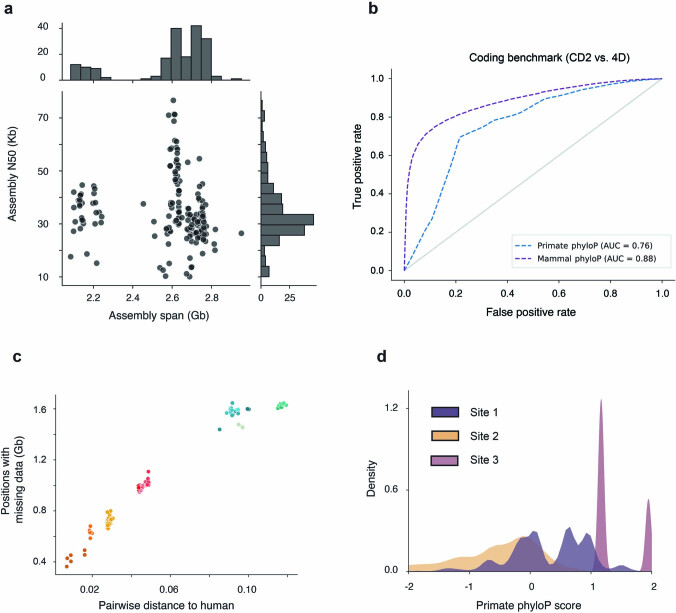
Extended Data Fig. 1 Genome assemblies and constraint metrics. (a) Distribution of genome assembly span and contiguity for newly assembled primate species in this project. The cluster with assembly spans <2.3 Gb corresponds to Strepsirrhines, which have smaller genomes sizes then remaining primate species. (b) ROC-curves for coding benchmark across mammal and primate phyloP, comparing codon positions 2 (CD2) as putatively constrained positive cases, and human four-fold degenerate sites (4D) as negative cases. Both primate and mammal phyloP distinguish well between non-synonymous CD2 and 4-fold degenerate sites, while mammal phyloP achieves expectedly higher performance due to the larger total branch-length covered by the MSA. (c) Scatterplot showing the proportion of bases in the human genome with missing data in the filtered MSA, after excluding ambiguous alignments and duplications for a given species, versus the pairwise phylogenetic distance to human. The proportion of resolved bases has a strong phylogenetic clustering, points are colored by the corresponding primate family following the color scheme presented in Fig. 1a. (d) Effect of alignment composition on phyloP scores for 3 different scenarios: Site 1 contains positions with perfectly matching alignments in 151-171 species and missing alignments in the remaining ones, Site 2 contains positions with perfectly matching alignments in 151-171 species but mismatches in over 50 species, Site 3 contains perfect alignments across all species. Distributions for Site1 and Site 2 are significantly different (P = 1.4 × 10−66, two-sided Rank Sum Test).
Extended Data Fig. 1 Genome assemblies and constraint metrics. (a) Distribution of genome assembly span and contiguity for newly assembled primate species in this project. The cluster with assembly spans <2.3 Gb corresponds to Strepsirrhines, which have smaller genomes sizes then remaining primate species. (b) ROC-curves for coding benchmark across mammal and primate phyloP, comparing codon positions 2 (CD2) as putatively constrained positive cases, and human four-fold degenerate sites (4D) as negative cases. Both primate and mammal phyloP distinguish well between non-synonymous CD2 and 4-fold degenerate sites, while mammal phyloP achieves expectedly higher performance due to the larger total branch-length covered by the MSA. (c) Scatterplot showing the proportion of bases in the human genome with missing data in the filtered MSA, after excluding ambiguous alignments and duplications for a given species, versus the pairwise phylogenetic distance to human. The proportion of resolved bases has a strong phylogenetic clustering, points are colored by the corresponding primate family following the color scheme presented in Fig. 1a. (d) Effect of alignment composition on phyloP scores for 3 different scenarios: Site 1 contains positions with perfectly matching alignments in 151-171 species and missing alignments in the remaining ones, Site 2 contains positions with perfectly matching alignments in 151-171 species but mismatches in over 50 species, Site 3 contains perfect alignments across all species. Distributions for Site1 and Site 2 are significantly different (P = 1.4 × 10−66, two-sided Rank Sum Test).CC BY · PubMed Central
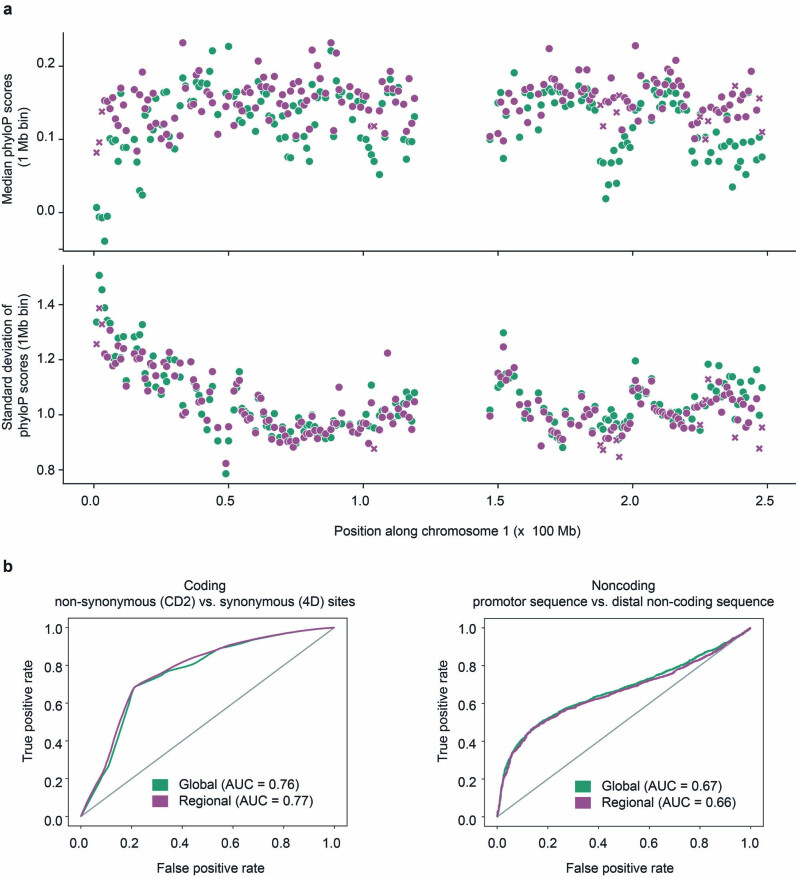
Extended Data Fig. 2 Regional and global substitution models. (a) Comparison of neutral background models with genome-wide random sampling of ancestral repeats from all autosomes (green) versus regional modeling of substitution rates at a 1 Mb scale (purple). The upper panel shows median phyloP scores in 1 Mb windows along chromosome 1, the lower panel the corresponding standard deviations. Median scores and dispersion are very similar between global and regional neutral models, values of larger discrepancy tend to fall within windows that containe a limited number of ancestral repeat sequences used to calibrate the regional model, resulting in less reliable estimates of local substitution rates (<50 kb, annotated as purple crosses). (b) Comparison of performance of global versus regional model at separating codon position 2 (amino acid-altering positions) versus 4-fold degenerate sites (synonymous positions), and promoters versus matched distal non-coding sequence. Global and regional models achieve similar performance on both coding and non-coding benchmarks.
Extended Data Fig. 2 Regional and global substitution models. (a) Comparison of neutral background models with genome-wide random sampling of ancestral repeats from all autosomes (green) versus regional modeling of substitution rates at a 1 Mb scale (purple). The upper panel shows median phyloP scores in 1 Mb windows along chromosome 1, the lower panel the corresponding standard deviations. Median scores and dispersion are very similar between global and regional neutral models, values of larger discrepancy tend to fall within windows that containe a limited number of ancestral repeat sequences used to calibrate the regional model, resulting in less reliable estimates of local substitution rates (<50 kb, annotated as purple crosses). (b) Comparison of performance of global versus regional model at separating codon position 2 (amino acid-altering positions) versus 4-fold degenerate sites (synonymous positions), and promoters versus matched distal non-coding sequence. Global and regional models achieve similar performance on both coding and non-coding benchmarks.CC BY · PubMed Central
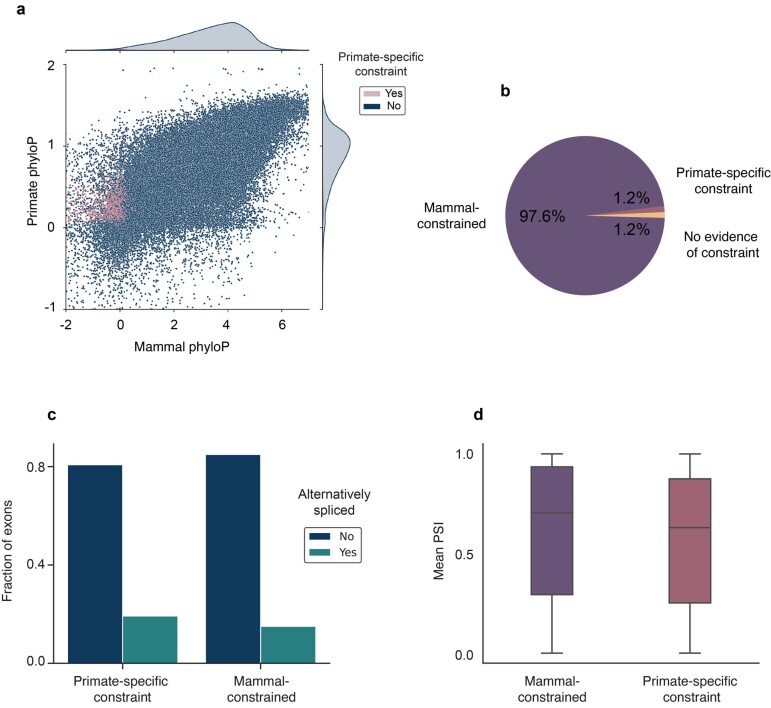
Extended Data Fig. 3 Constraint in human protein-coding exons. (a) Average per-base mammal and primate phyloP scores for human canonical protein-coding exons classified by primate-specific constraint. (b) Distribution of constraint across clades for 185,275 protein-coding exons. Most human protein coding exons are deeply constrained. (c) Fraction of alternatively spliced exons for exons constrained either specifically in primates, or broadly across mammals. Exons with primate-specific constraint are alternatively spliced significantly more often than broadly constrained ones (OR = 1.35, P = 1.3 × 10⁻⁷, two-sided Fisher’s Exact Test). (d) Mean exon inclusion rates (PSI) of alternatively spliced exons across GTEx tissues. Exons constrained specifically in primates have significantly lower inclusion rates than broadly constrained ones (P = 8.6 × 10⁻⁶, two-sided Rank Sum Test, n = 28,127 exons). Boxes show mean and interquartile range (IQR), whiskers delimit +/− 1.5 x IQR.
Extended Data Fig. 3 Constraint in human protein-coding exons. (a) Average per-base mammal and primate phyloP scores for human canonical protein-coding exons classified by primate-specific constraint. (b) Distribution of constraint across clades for 185,275 protein-coding exons. Most human protein coding exons are deeply constrained. (c) Fraction of alternatively spliced exons for exons constrained either specifically in primates, or broadly across mammals. Exons with primate-specific constraint are alternatively spliced significantly more often than broadly constrained ones (OR = 1.35, P = 1.3 × 10⁻⁷, two-sided Fisher’s Exact Test). (d) Mean exon inclusion rates (PSI) of alternatively spliced exons across GTEx tissues. Exons constrained specifically in primates have significantly lower inclusion rates than broadly constrained ones (P = 8.6 × 10⁻⁶, two-sided Rank Sum Test, n = 28,127 exons). Boxes show mean and interquartile range (IQR), whiskers delimit +/− 1.5 x IQR.CC BY · PubMed Central
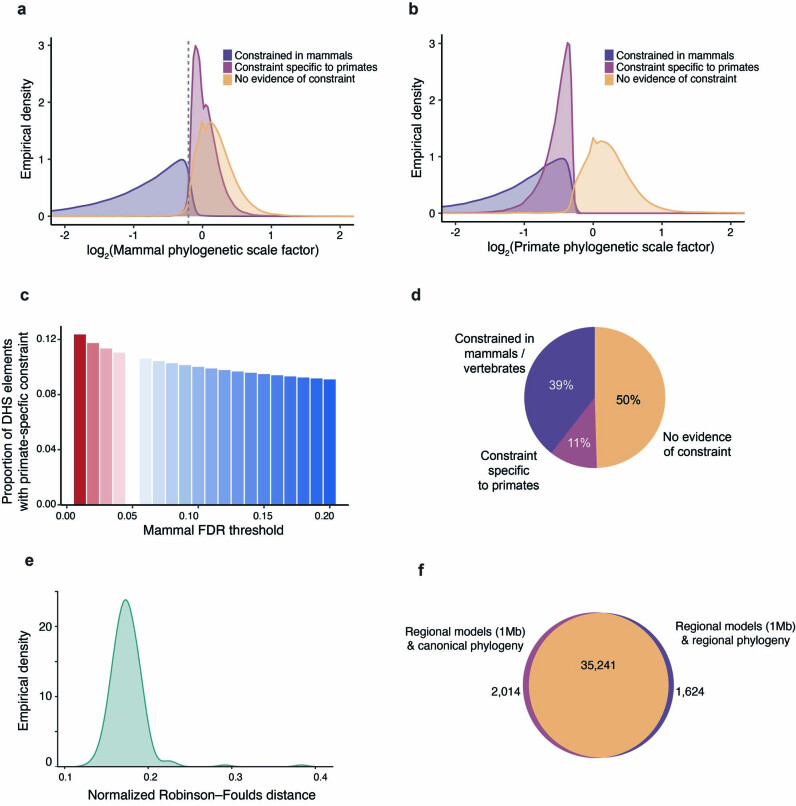
Extended Data Fig. 4 Sensitivity analysis of constraint in DHS elements. (a) Distribution of non-primate mammalian scaling factors for DHS elements stratified by clade-specificity of constraint. The dashed gray line denotes where the mammal-constrained and primate-specific constrained distributions intersect. (b) Distribution of primate scaling factors for DHS elements stratified by clade-specificity of constraint. (c) Proportion of DHS with primate-specific constraint for variable FDR cutoffs in mammals excluding primates. Primate FDR is fixed at 5%. (d) Proportion of constrained DHS elements across clades when modeling substitution rates at a 1 Mb scale, compare to Fig. 2b. The estimated proportions are robust to differences between neutral substitution rates modeled in a regional 1 Mb context and a genome-wide averaged model. (e) Normalized Robinson–Foulds distance between 1 Mb scale phylogeny and canonical phylogeny along human chromosome 1. (f) Venn diagram intersecting DHS elements on chr1 classified as constrained in primates using regional substitution rate models and a fixed, canonical topology, or regional substitution rate models and a variable, regional topology. Models that accounting for regional differences in topology due to e.g. incomplete lineage sorting are highly concordant to those that use a single genome-wide topology (OR = 806.5, P ≈ 0, two-sided Fisher’s Exact Test).
Extended Data Fig. 4 Sensitivity analysis of constraint in DHS elements. (a) Distribution of non-primate mammalian scaling factors for DHS elements stratified by clade-specificity of constraint. The dashed gray line denotes where the mammal-constrained and primate-specific constrained distributions intersect. (b) Distribution of primate scaling factors for DHS elements stratified by clade-specificity of constraint. (c) Proportion of DHS with primate-specific constraint for variable FDR cutoffs in mammals excluding primates. Primate FDR is fixed at 5%. (d) Proportion of constrained DHS elements across clades when modeling substitution rates at a 1 Mb scale, compare to Fig. 2b. The estimated proportions are robust to differences between neutral substitution rates modeled in a regional 1 Mb context and a genome-wide averaged model. (e) Normalized Robinson–Foulds distance between 1 Mb scale phylogeny and canonical phylogeny along human chromosome 1. (f) Venn diagram intersecting DHS elements on chr1 classified as constrained in primates using regional substitution rate models and a fixed, canonical topology, or regional substitution rate models and a variable, regional topology. Models that accounting for regional differences in topology due to e.g. incomplete lineage sorting are highly concordant to those that use a single genome-wide topology (OR = 806.5, P ≈ 0, two-sided Fisher’s Exact Test).CC BY · PubMed Central
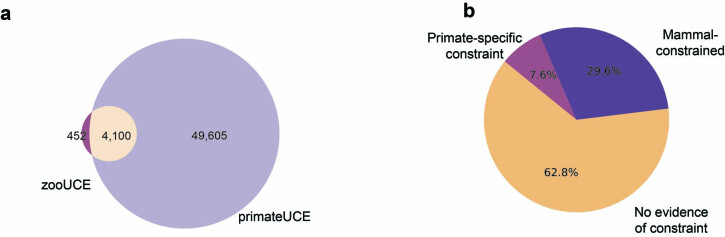
Extended Data Fig. 5 UCEs and constrained TF footprints. (a) Overlap between ultraconserved elements as recently defined by Zoonomia (zooUCEs) and primate UCEs allowing up to 1% missing data. (b) Distribution of constraint across clades for TF footprints assessed in this study.
Extended Data Fig. 5 UCEs and constrained TF footprints. (a) Overlap between ultraconserved elements as recently defined by Zoonomia (zooUCEs) and primate UCEs allowing up to 1% missing data. (b) Distribution of constraint across clades for TF footprints assessed in this study.CC BY · PubMed Central
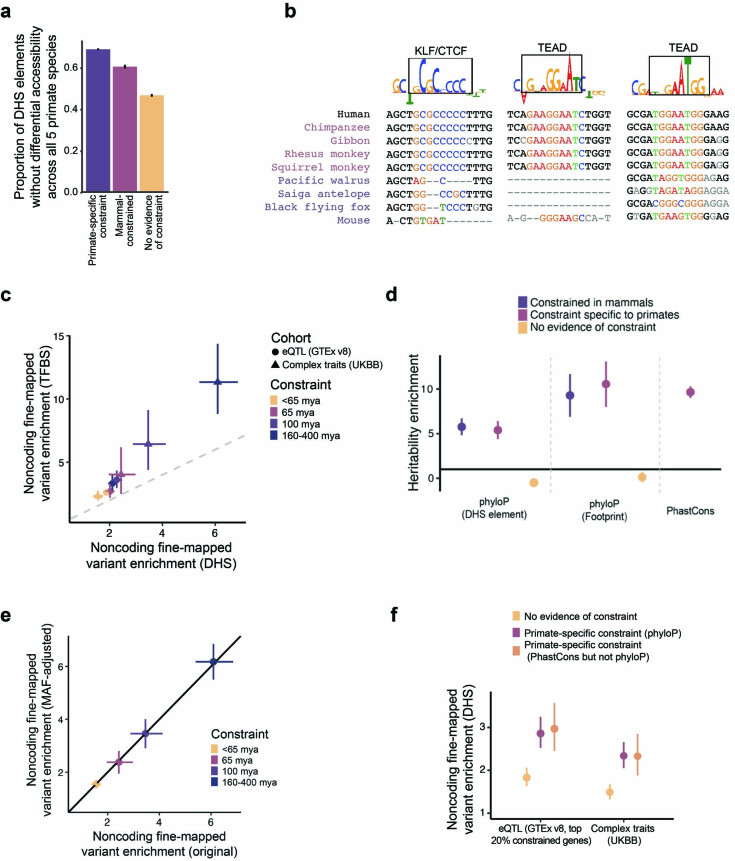
Extended Data Fig. 6 Extended characterization of constrained noncoding regulatory elements. (a) Differential chromatin accessibility at orthologous sequence elements across 5 primate species. The y-axis indicates the proportion of elements where differential accessibility was not detected in (37), stratified by sequence constraint. (b) For elements tested by Luciferase reporter in Fig. 2g, multiple sequence alignments for select primate and mammal species are shown for a subsequence of tested elements. Subsequences with high DeepLift contribution scores that had matching TF motifs were selected and these data are shown. (c) Comparison between the enrichment of fine-mapped variants (PIP > 0.5) in DHS elements or further restricted to TFBSs is shown, related to Fig. 4a,b. Error bars represent 95% CIs, centers represent point estimates. A grey dashed line indicates y = x. The shape of the point indicates whether the enrichment is for eQTLs or complex traits. Colors indicate sequence constraint. n = 3,221 on x-axis and 3,447 on y-axis fine-mapped variants. (d) Heritability enrichment as measured by LD Score regression for 6 regulatory constraint annotations and primate Phastcons. n = 69 traits. Error bars represent 95% CIs. (e) Comparison of noncoding fine-mapped variant enrichment with and without adjustment for MAF distributions between the set of variants with PIP > 0.5 and the set with PIP < 0.01. Error bars represent 95% CIs, centers represent point estimates. n = 3,221 fine-mapped variants. (f) Enrichment of fine-mapped variants (PIP > 0.5) in DHS elements, related to Fig. 4a,b. Error bars represent 95% CIs, centers represent point estimates. Colors indicate sequence constraint, including primate specific constraint as defined by phyloP and by phastCons but not phyloP. n = 3,221 for UKBB and 48,183 for GTEx fine-mapped variants.
Extended Data Fig. 6 Extended characterization of constrained noncoding regulatory elements. (a) Differential chromatin accessibility at orthologous sequence elements across 5 primate species. The y-axis indicates the proportion of elements where differential accessibility was not detected in (37), stratified by sequence constraint. (b) For elements tested by Luciferase reporter in Fig. 2g, multiple sequence alignments for select primate and mammal species are shown for a subsequence of tested elements. Subsequences with high DeepLift contribution scores that had matching TF motifs were selected and these data are shown. (c) Comparison between the enrichment of fine-mapped variants (PIP > 0.5) in DHS elements or further restricted to TFBSs is shown, related to Fig. 4a,b. Error bars represent 95% CIs, centers represent point estimates. A grey dashed line indicates y = x. The shape of the point indicates whether the enrichment is for eQTLs or complex traits. Colors indicate sequence constraint. n = 3,221 on x-axis and 3,447 on y-axis fine-mapped variants. (d) Heritability enrichment as measured by LD Score regression for 6 regulatory constraint annotations and primate Phastcons. n = 69 traits. Error bars represent 95% CIs. (e) Comparison of noncoding fine-mapped variant enrichment with and without adjustment for MAF distributions between the set of variants with PIP > 0.5 and the set with PIP < 0.01. Error bars represent 95% CIs, centers represent point estimates. n = 3,221 fine-mapped variants. (f) Enrichment of fine-mapped variants (PIP > 0.5) in DHS elements, related to Fig. 4a,b. Error bars represent 95% CIs, centers represent point estimates. Colors indicate sequence constraint, including primate specific constraint as defined by phyloP and by phastCons but not phyloP. n = 3,221 for UKBB and 48,183 for GTEx fine-mapped variants.CC BY · PubMed Central

Verification

Claims the paper makes

The claims and statistics of this paper haven’t been checked yet.

Run the check — free, no account needed. It reads the open-access text and checks the sources it cites.

A few free checks a day · papers already verified open instantly · results are public

Claims other papers make about this one

Each is checked against this paper’s own text: does it say what the citing paper says it does?

Self-check

Percentages, sums and reported differences re-computed from the paper’s own numbers.

The self-check needs the paper’s full text.

Citations

Cites

Show all 15 references

Research works printed but not linked: 60

  1. Lappalainen, T. & MacArthur, D. G. From variant to function in human disease genetics. Science 373, 1464–1468 (2021). · DOI
  2. Thomas, J. W. et al. Comparative analyses of multi-species sequences from targeted genomic regions. Nature 424, 788–793 (2003). · DOI
  3. Boffelli, D., Nobrega, M. A. & Rubin, E. M. Comparative genomics at the vertebrate extremes. Nat. Rev. Genet. 5, 456–465 (2004). · DOI
  4. Margulies, E. H. et al. Analyses of deep mammalian sequence alignments and constraint predictions for 1% of the human genome. Genome Res. 17, 760–774 (2007). · DOI
  5. Sullivan, P. F. et al. Leveraging base-pair mammalian constraint to understand genetic variation and human disease. Science 380, eabn2937 (2023). · DOI
  6. ENCODE Project Consortium. An integrated encyclopedia of DNA elements in the human genome. Nature 489, 57–74 (2012). · DOI · Paper page
  7. King, M. C. & Wilson, A. C. Evolution at two levels in humans and chimpanzees. Science 188, 107–116 (1975). · DOI · Paper page
  8. Kuderna, L. F. K. et al. A global catalog of whole-genome diversity from 233 primate species. Science 380, 906–913 (2023). · DOI
  9. Juan, D., Santpere, G., Kelley, J. L., Cornejo, O. E. & Marques-Bonet, T. Current advances in primate genomics: novel approaches for understanding evolution and disease. Nat. Rev. Genet. 24, 314–331 (2023). · DOI
  10. Boffelli, D. et al. Phylogenetic shadowing of primate sequences to find functional regions of the human genome. Science 299, 1391–1394 (2003). · DOI · Paper page
  11. Gilad, Y., Oshlack, A., Smyth, G. K., Speed, T. P. & White, K. P. Expression profiling in primates reveals a rapid evolution of human transcription factors. Nature 440, 242–245 (2006). · DOI
  12. Orkin, J. D., Kuderna, L. F. K. & Marques-Bonet, T. The diversity of primates: from biomedicine to conservation genomics. Annu. Rev. Anim. Biosci. 9, 103–124 (2021). · DOI
  13. Sousa, A. M. M., Meyer, K. A., Santpere, G., Gulden, F. O. & Sestan, N. Evolution of the human nervous system function, structure, and development. Cell 170, 226–247 (2017). · DOI · Paper page
  14. Christmas, M. J. et al. Evolutionary constraint and innovation across hundreds of placental mammals. Science 380, eabn3943 (2023). · DOI · Paper page
  15. Wilson, D. E. & Reeder, D. M. Mammal Species of the World: A Taxonomic and Geographic Reference (JHU Press, 2005).
  16. Zoonomia Consortium. A comparative genomics multitool for scientific discovery and conservation. Nature 587, 240–245 (2020). · DOI · Paper page
  17. Sørensen, E. F. et al. Genome-wide coancestry reveals details of ancient and recent male-driven reticulation in baboons. Science 380, eabn8153 (2023). · DOI
  18. Gao, H. et al. The landscape of tolerated genetic variation in humans and primates. Science 380, eabn8153 (2023). · DOI
  19. Fiziev, P. P. et al. Rare penetrant mutations confer severe risk of common diseases. Science 380, eabo1131 (2023). · DOI
  20. Li, D., Liu, C.-M., Luo, R., Sadakane, K. & Lam, T.-W. MEGAHIT: an ultra-fast single-node solution for large and complex metagenomics assembly via succinct de Bruijn graph. Bioinformatics 31, 1674–1676 (2015). · DOI
  21. Pollard, K. S., Hubisz, M. J., Rosenbloom, K. R. & Siepel, A. Detection of nonneutral substitution rates on mammalian phylogenies. Genome Res. 20, 110–121 (2010). · DOI · Paper page
  22. Frankish, A., Diekhans, M., Jungreis, I. & Lagarde, J. GENCODE 2021. Nucleic Acids Res. 49, D916–D923 (2021). · DOI · Paper page
  23. Pan, Q. et al. Alternative splicing of conserved exons is frequently species-specific in human and mouse. Trends Genet. 21, 73–77 (2005). · DOI
  24. Xiong, J. et al. Predominant patterns of splicing evolution on human, chimpanzee and macaque evolutionary lineages. Hum. Mol. Genet. 27, 1474–1485 (2018). · DOI
  25. Suntsova, M. V. & Buzdin, A. A. Differences between human and chimpanzee genomes and their implications in gene expression, protein functions and biochemical properties of the two species. BMC Genomics 21, 535 (2020). · DOI
  26. Kondrashov, F. A. & Koonin, E. V. Origin of alternative splicing by tandem exon duplication. Hum. Mol. Genet. 10, 2661–2669 (2001). · DOI
  27. Mikkelsen, T. S. et al. Comparative epigenomic analysis of murine and human adipogenesis. Cell 143, 156–169 (2010). · DOI
  28. Ward, L. D. & Kellis, M. Evidence of abundant purifying selection in humans for recently acquired regulatory functions. Science 337, 1675–1678 (2012). · DOI · Paper page
  29. Necsulea, A. & Kaessmann, H. Evolutionary dynamics of coding and non-coding transcriptomes. Nat. Rev. Genet. 15, 734–748 (2014). · DOI
  30. Villar, D. et al. Enhancer evolution across 20 mammalian species. Cell 160, 554–566 (2015). · DOI · Paper page
  31. Fong, S. L. & Capra, J. A. Modeling the evolutionary architectures of transcribed human enhancer sequences reveals distinct origins, functions, and associations with human trait variation. Mol. Biol. Evol. 38, 3681–3696 (2021). · DOI
  32. Kircher, M. et al. Saturation mutagenesis of twenty disease-associated regulatory elements at single base-pair resolution. Nat. Commun. 10, 3583 (2019). · DOI · Paper page
  33. Edsall, L. E. et al. Evaluating chromatin accessibility differences across multiple primate species using a joint modeling approach. Genome Biol. Evol. 11, 3035–3053 (2019). · DOI
  34. Reilly, S. K. et al. Evolutionary genomics. Evolutionary changes in promoter and enhancer activity during human corticogenesis. Science 347, 1155–1159 (2015). · DOI · Paper page
  35. Drake, J. A. et al. Conserved noncoding sequences are selectively constrained and not mutation cold spots. Nat. Genet. 38, 223–227 (2006). · DOI
  36. Karczewski, K. J. et al. The mutational constraint spectrum quantified from variation in 141,456 humans. Nature 581, 434–443 (2020). · DOI · Paper page
  37. Cardoso-Moreira, M. et al. Gene expression across mammalian organ development. Nature 571, 505–509 (2019). · DOI · Paper page
  38. Pontis, J. et al. Primate-specific transposable elements shape transcriptional networks during human development. Nat. Commun. 13, 7178 (2022). · DOI
  39. Nowick, K. et al. Gain, loss and divergence in primate zinc-finger genes: a rich resource for evolution of gene regulatory differences between species. PLoS ONE 6, e21553 (2011). · DOI
  40. Vierstra, J. et al. Mouse regulatory DNA landscapes reveal global principles of cis-regulatory evolution. Science 346, 1007–1012 (2014). · DOI
  41. Cui, R. et al. Improving fine-mapping by modeling infinitesimal effects. Preprint at bioRxiv https://doi.org/10.1101/2022.10.21.513123 (2022). · DOI
  42. Hardison, R. C. et al. Covariation in frequencies of substitution, deletion, transposition, and recombination during eutherian evolution. Genome Res. 13, 13–26 (2003). · DOI
  43. Kuderna, L. F., Esteller-Cucala, P. & Marques-Bonet, T. Branching out: what omics can tell us about primate evolution. Curr. Opin. Genet. Dev. 62, 65–71 (2020). · DOI
  44. Shao, Y. et al. Phylogenomic analyses provide insights into primate evolution. Science 380, 913–924 (2023). · DOI
  45. Li, H. New strategies to improve minimap2 alignment accuracy. Bioinformatics 37, 4572–4574 (2021). · DOI
  46. Hubisz, M. J., Pollard, K. S. & Siepel, A. PHAST and RPHAST: phylogenetic analysis with space/time models. Brief. Bioinform. 12, 41–51 (2011). · DOI · Paper page
  47. Storey, J. D. A direct approach to false discovery rates. J. R. Stat. Soc. B 64, 479–498 (2002). · DOI · Paper page
  48. Thomas, P. D. et al. PANTHER: Making genome-scale phylogenetics accessible to all. Protein Sci. 31, 8–22 (2022). · DOI · Paper page
  49. Bycroft, C. et al. The UK Biobank resource with deep phenotyping and genomic data. Nature 562, 203–209 (2018). · DOI · Paper page
  50. Kanai, M. et al. Insights from complex trait fine-mapping across diverse populations. Preprint at bioRxiv https://doi.org/10.1101/2021.09.03.21262975 (2021). · DOI
  51. Benner, C. et al. FINEMAP: efficient variable selection using summary data from genome-wide association studies. Bioinformatics 32, 1493–1501 (2016). · DOI · Paper page
  52. Benner, C., Havulinna, A. S., Salomaa, V., Ripatti, S. & Pirinen, M. Refining fine-mapping: effect sizes and regional heritability. Preprint at bioRxiv https://doi.org/10.1101/318618 (2018). · DOI
  53. Wang, G., Sarkar, A., Carbonetto, P. & Stephens, M. A simple new approach to variable selection in regression, with application to genetic fine mapping. J. R. Stat. Soc. B 82, 1273–1300 (2020). · DOI · Paper page
  54. Benner, C. et al. Prospects of fine-mapping trait-associated genomic regions by using summary statistics from genome-wide association studies. Am. J. Hum. Genet. 101, 539–551 (2017). · DOI
  55. ENCODE Project Consortium. Expanded encyclopaedias of DNA elements in the human and mouse genomes. Nature 583, 699–710 (2020). · DOI · Paper page
  56. McLaren, W. et al. The ensembl variant effect predictor. Genome Biol. 17, 122 (2016). · DOI · Paper page
  57. Finucane, H. K. et al. Partitioning heritability by functional annotation using genome-wide association summary statistics. Nat. Genet. 47, 1228–1235 (2015). · DOI · Paper page
  58. Coetzee, S. G., Coetzee, G. A. & Hazelett, D. J. motifbreakR: an R/Bioconductor package for predicting variant effects at transcription factor binding sites. Bioinformatics 31, 3847–3849 (2015). · DOI
  59. Kulakovskiy, I. V. et al. HOCOMOCO: towards a complete collection of transcription factor binding models for human and mouse via large-scale ChIP-seq analysis. Nucleic Acids Res. 46, D252–D259 (2018). · DOI
  60. García-Pérez, R. et al. Epigenomic profiling of primate lymphoblastoid cell lines reveals the evolutionary patterns of epigenetic activities in gene regulatory architectures. Nat. Commun. 12, 3116 (2021). · DOI

Cited by

Sorted by citations

Metadata

Authors
Kuderna, L. F. K., Ulirsch, J. C., Rashid, S., Ameen, M., Sundaram, L., Hickey, G., Cox, A. J., Gao, H., Kumar, A., Aguet, F., Christmas, M. J., Clawson, H., Haeussler, M., Janiak, M. C., Kuhlwilm, M., Orkin, J. D., Bataillon, T., Manu, S., Valenzuela, A., Bergman, J., Rouselle, M., Silva, F. E., Agueda, L., Blanc, J., Gut, M., de Vries, D., Goodhead, I., Harris, R. A., Raveendran, M., Jensen, A., Chuma, I. S., Horvath, J. E., Hvilsom, C., Juan, D., Frandsen, P., Schraiber, J. G., de Melo, F. R., Bertuol, F., Byrne, H., Sampaio, I., Farias, I., Valsecchi, J., Messias, M., da Silva, M. N. F., Trivedi, M., Rossi, R., Hrbek, T., Andriaholinirina, N., Rabarivola, C. J., Zaramody, A., Jolly, C. J., Phillips-Conroy, J., Wilkerson, G., Abee, C., Simmons, J. H., Fernandez-Duque, E., Kanthaswamy, S., Shiferaw, F., Wu, D., Zhou, L., Shao, Y., Zhang, G., Keyyu, J. D., Knauf, S., Le, M. D., Lizano, E., Merker, S., Navarro, A., Nadler, T., Khor, C. C., Lee, J., Tan, P., Lim, W. K., Kitchener, A. C., Zinner, D., Gut, I., Melin, A. D., Guschanski, K., Schierup, M. H., Beck, R. M. D., Karakikes, I., Wang, K. C., Umapathy, G., Roos, C., Boubli, J. P., Siepel, A., Kundaje, A., Paten, B., Lindblad-Toh, K., Rogers, J., Marques Bonet, T., & Farh, K. K.-H.
Venue
Nature
Published
2023-11-29
Volume
625
Issue
7996
Pages
735-742
ISSN
  • 0028-0836
  • 1476-4687
Cited by
129
References
15
Language
en

About these checks

Registry, retraction, Cites and statistics results are computed, not judged, with one exception: a printed reference that no index lists is read once by a model before it counts as a citation error. Claims are extracted by a model and kept only when their quote appears verbatim in the text; each cited source is then checked, with a model’s help, for whether it says what the claim relies on. Those verdicts can be wrong — read the claim’s quote and the cited source before relying on one.

Statistics and arithmetic are recomputed, not judged.

Confidence bands are shown only for fields calibrated on our annotated test set. None is calibrated yet, so no band is shown.

What counts as a claim ›How we measure confidence ›How we check this ›

Are you an author, or do you see a problem with this page? Request a review