

The DOI matches its Crossref record; 63 of the 63 references it cites were found in a registry or an index.
Engineered phage with antibacterial CRISPR–Cas selectively reduce E. coli burden in mice
Open accessAbstract
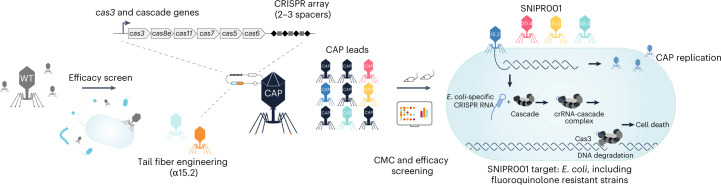
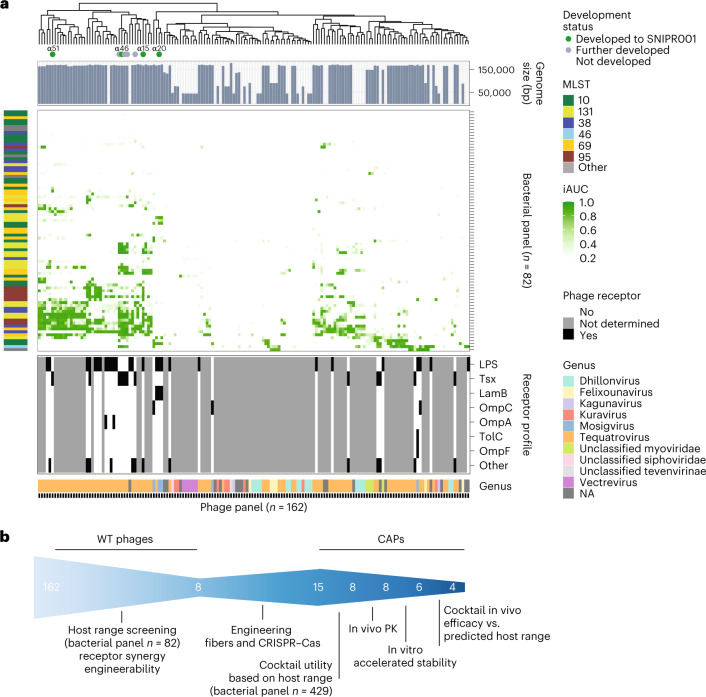
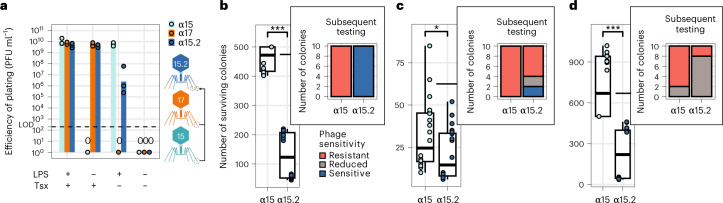
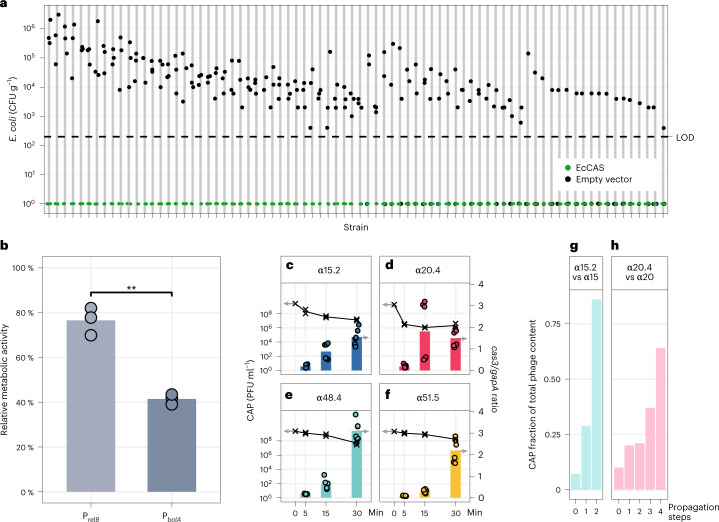
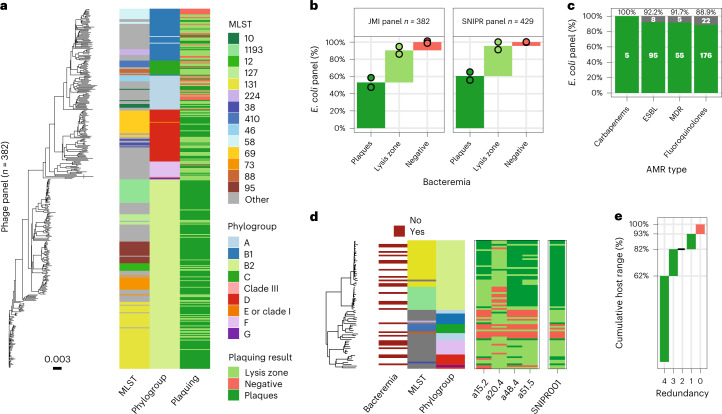
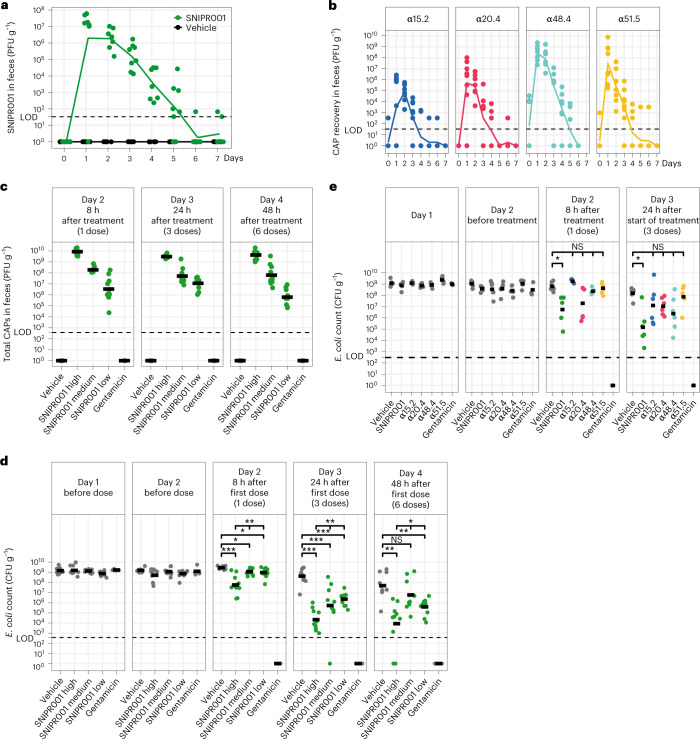
Antibiotic treatments have detrimental effects on the microbiome and lead to antibiotic resistance. To develop a phage therapy against a diverse range of clinically relevant Escherichia coli , we screened a library of 162 wild-type (WT) phages, identifying eight phages with broad coverage of E. coli , complementary binding to bacterial surface receptors, and the capability to stably carry inserted cargo. Selected phages were engineered with tail fibers and CRISPR–Cas machinery to specifically target E. coli . We show that engineered phages target bacteria in biofilms, reduce the emergence of phage-tolerant E. coli and out-compete their ancestral WT phages in coculture experiments. A combination of the four most complementary bacteriophages, called SNIPR001, is well tolerated in both mouse models and minipigs and reduces E. coli load in the mouse gut better than its constituent components separately. SNIPR001 is in clinical development to selectively kill E. coli , which may cause fatal infections in hematological cancer patients.
Overview
The claims and statistics of this paper haven’t been checked yet.
Run the check — free, no account needed. It reads the open-access text and checks the sources it cites.
Integrity signals
Registry
Cites
Statistics
Figures
Verification
Claims the paper makes
The claims and statistics of this paper haven’t been checked yet.
Run the check — free, no account needed. It reads the open-access text and checks the sources it cites.
Claims other papers make about this one
Each is checked against this paper’s own text: does it say what the citing paper says it does?
The source backs part of the claim, not all of it — or backs it for a different population, condition or comparison.
In the citing paper
“Overall, these studies have established encouraging safety profiles and provided preliminary pharmacokinetic and immunogenicity data in immunocompromised populations, laying an important foundation for oncology-directed applications.”
From Phage therapy in oncology: opportunities for cancer prevention and treatment (2026) · cites this paper as [129]
Experimental — accuracy not yet measuredThe source backs part of the claim, not all of it — or backs it for a different population, condition or comparison.
In the citing paper
“SNIPR001 was recovered from fecal samples in a dose-dependent manner and corresponded with a numerical reduction in gut E. coli levels, demonstrating clinical proof of concept for this targeted approach.”
From Phage therapy in oncology: opportunities for cancer prevention and treatment (2026) · cites this paper as [129]
Experimental — accuracy not yet measuredThe source backs part of the claim, not all of it — or backs it for a different population, condition or comparison.
In the citing paper
“In a Phase 1 randomized, double-blind, placebo-controlled, multiple-dose, dose-escalation study trial (NCT05277350i) involving 36 healthy volunteers across three dose levels, 7-day oral administration of SNIPR001 was well tolerated, with only mild to moderate adverse events and no treatment-related discontinuations.”
From Phage therapy in oncology: opportunities for cancer prevention and treatment (2026) · cites this paper as [129]
Experimental — accuracy not yet measuredThe cited source says what the claim attributes to it.
In the citing paper
“SNIPR001 was recovered from fecal samples in a dose-dependent manner and corresponded with a numerical reduction in gut E. coli levels, demonstrating clinical proof of concept for this targeted approach.”
From Phage therapy in oncology: opportunities for cancer prevention and treatment (2026) · cites this paper as [129]
The cited source says what the claim attributes to it.
In the citing paper
“Building on this foundation, SNIPR001 represents a next-generation, orally administered CRISPR–phage therapeutic designed to selectively reduce gut colonization by E. coli, a major source of bloodstream infections in patients with hematological malignancies [129]”
From Phage therapy in oncology: opportunities for cancer prevention and treatment (2026) · cites this paper as [129]
The cited source says what the claim attributes to it.
In the citing paper
“Building on this foundation, SNIPR001 represents a next-generation, orally administered CRISPR–phage therapeutic designed to selectively reduce gut colonization by E. coli, a major source of bloodstream infections in patients with hematological malignancies [129]”
From Phage therapy in oncology: opportunities for cancer prevention and treatment (2026) · cites this paper as [129]
The cited source says what the claim attributes to it.
In the citing paper
“SNIPR001 was recovered from fecal samples in a dose-dependent manner and corresponded with a numerical reduction in gut E. coli levels, demonstrating clinical proof of concept for this targeted approach.”
From Phage therapy in oncology: opportunities for cancer prevention and treatment (2026) · cites this paper as [129]
Self-check
Percentages, sums and reported differences re-computed from the paper’s own numbers.
The self-check needs the paper’s full text.
Citations
Cites
Trimmomatic: a flexible trimmer for Illumina sequence data
Bolger, A. M., Lohse, M., & Usadel, B. (2014) · Bioinformatics · doi:10.1093/bioinformatics/btu170 · Cited by 65,548
SPAdes: A New Genome Assembly Algorithm and Its Applications to Single-Cell Sequencing
Bankevich, A., Nurk, S., Antipov, D., Gurevich, A. A., Dvorkin, M. V., Kulikov, A. S., Lesin, V. M., Nikolenko, S., Pham, S., Prjibelski, A. D., et al. (2012) · Journal of Computational Biology · doi:10.1089/cmb.2012.0021 · Cited by 26,312
Global burden of bacterial antimicrobial resistance in 2019: a systematic analysis
Murray, C. J. L., Ikuta, K. S., Sharara, F., Swetschinski, L., Robles Aguilar, G., Gray, A., Han, C., Bisignano, C., Rao, P., Wool, E., et al. (2022) · The Lancet · doi:10.1016/s0140-6736(21)02724-0 · Cited by 16,316
Mash: fast genome and metagenome distance estimation using MinHash
Ondov, B. D., Treangen, T. J., Melsted, P., Mallonee, A. B., Bergman, N. H., Koren, S., & Phillippy, A. M. (2016) · Genome biology · doi:10.1186/s13059-016-0997-x · Cited by 3,373
Small CRISPR RNAs Guide Antiviral Defense in Prokaryotes
Brouns, S. J. J., Jore, M. M., Lundgren, M., Westra, E. R., Slijkhuis, R. J. H., Snijders, A. P. L., Dickman, M. J., Makarova, K. S., Koonin, E. V., & van der Oost, J. (2008) · Science · doi:10.1126/science.1159689 · Cited by 2,460
Multilocus Sequence Typing of Total-Genome-Sequenced Bacteria
Larsen, M. V., Cosentino, S., Rasmussen, S., Friis, C., Hasman, H., Marvig, R. L., Jelsbak, L., Sicheritz‐Pontén, T., Ussery, D. W., Aarestrup, F. M., et al. (2012) · Journal of Clinical Microbiology · doi:10.1128/jcm.06094-11 · Cited by 2,333
Lutz, R. (1997) · Nucleic Acids Research · doi:10.1093/nar/25.6.1203 · Cited by 1,694
Dedrick, R. M., Guerrero-Bustamante, C. A., Garlena, R. A., Russell, D. A., Ford, K., Harris, K., Gilmour, K. C., Soothill, J. S., Jacobs‐Sera, D., Schooley, R. T., et al. (2019) · Nature Medicine · doi:10.1038/s41591-019-0437-z · Cited by 1,418
Using ggtree to Visualize Data on Tree‐Like Structures
Yu, G. (2020) · Current Protocols in Bioinformatics · doi:10.1002/cpbi.96 · Cited by 1,388
Schooley, R. T., Biswas, B., Gill, J. J., Hernandez-Morales, A., Lancaster, J., Lessor, L., Barr, J. J., Reed, S. L., Rohwer, F., Benler, S., et al. (2017) · Antimicrobial Agents and Chemotherapy · doi:10.1128/aac.00954-17 · Cited by 1,254
Cited by
Sorted by citations
Past, present, and future of CRISPR genome editing technologies
Pacesa, M., Pelea, O., & Jinek, M. (2024) · Cell · doi:10.1016/j.cell.2024.01.042 · Cited by 609
Role of the microbiota in response to and recovery from cancer therapy
Blake, S. J., Wolf, Y., Boursi, B., & Lynn, D. J. (2023) · Nature reviews. Immunology · doi:10.1038/s41577-023-00951-0 · Cited by 151
In situ targeted base editing of bacteria in the mouse gut
Brödel, A. K., Charpenay, L. H., Galtier, M., Fuche, F. J., Terrasse, R., Poquet, C., Havránek, J., Pignotti, S., Krawczyk, A. O., Arraou, M., et al. (2024) · Nature · doi:10.1038/s41586-024-07681-w · Cited by 141
The gut microbiota in cancer immunity and immunotherapy
Xie, M., Li, X., Lau, H. C.-H., & Yu, J. (2025) · Cellular and Molecular Immunology · doi:10.1038/s41423-025-01326-2 · Cited by 132
Kim, P., Sanchez, A. M., Penke, T. J. R., Tuson, H. H., Kime, J., McKee, R. W., Slone, W. L., Conley, N. R., McMillan, L. J., Prybol, C. J., et al. (2024) · The Lancet Infectious Diseases · doi:10.1016/s1473-3099(24)00424-9 · Cited by 121
Renganathan, P., Gaysina, L. A., García-Gutiérrez, C., Puente, E. O. R., & Hernández, J. C. S. (2025) · Journal of Xenobiotics · doi:10.3390/jox15040133 · Cited by 85
Colibactin-driven colon cancer requires adhesin-mediated epithelial binding
Jans, M., Kolata, M., Blancke, G., D’Hondt, A., Gräf, C., Ciers, M., Sze, M., Thiran, A., Petta, I., Andries, V., et al. (2024) · Nature · doi:10.1038/s41586-024-08135-z · Cited by 84
The global resistance problem and the clinical antibacterial pipeline
Theuretzbacher, U. (2025) · Nature Reviews Microbiology · doi:10.1038/s41579-025-01169-8 · Cited by 80
Koncz, M., Stirling, T., Mehdi, H. H., Méhi, O., Eszenyi, B., Asbóth, A., Apjok, G., Tóth, Á., Orosz, L. I., Vásárhelyi, B. M., et al. (2024) · Cell · doi:10.1016/j.cell.2024.09.009 · Cited by 69
Skurnik, M., Alkalay‐Oren, S., Boon, M., Clokie, M. R. J., Sicheritz‐Pontén, T., Dąbrowska, K., Hatfull, G. F., Hazan, R., Jalasvuori, M., Kiljunen, S., et al. (2025) · Nature Reviews Methods Primers · doi:10.1038/s43586-024-00377-5 · Cited by 71
Du, J., Meile, S., Baggenstos, J., Jaggi, T., Piffaretti, P., Hunold, L., Matter, C. I., Leitner, L., Kessler, T. M., Loessner, M. J., et al. (2023) · Nature Communications · doi:10.1038/s41467-023-39612-0 · Cited by 60
Antibiotics re-booted—time to kick back against drug resistance
Blaskovich, M. A. T., & Cooper, M. A. (2025) · npj Antimicrobials and Resistance · doi:10.1038/s44259-025-00096-1 · Cited by 64
Modern microbiology: Embracing complexity through integration across scales
Eren, A. M., & Banfield, J. F. (2024) · Cell · doi:10.1016/j.cell.2024.08.028 · Cited by 57
Li, Z., Tang, J., Wang, X., Ma, X., Yuan, H., Gao, C., Guo, Q., Guo, X., Wan, J., & Dagot, C. (2025) · Microorganisms · doi:10.3390/microorganisms13092113 · Cited by 54
Phage cocktails: state-of-the-art technologies and strategies for effective design
Kaneko, T., Nakatsuka, K., & Tsuneda, S. (2025) · FEMS Microbiology Reviews · doi:10.1093/femsre/fuaf061 · Cited by 53
CRISPR innovations in tissue engineering and gene editing
Razavi, Z.-S., Soltani, M., Souri, M., & van Wijnen, A. J. (2024) · Life Sciences · doi:10.1016/j.lfs.2024.123120 · Cited by 51
Optimizing phage therapy with artificial intelligence: a perspective
Doud, M. B., Robertson, J. M., & Strathdee, S. A. (2025) · Frontiers in Cellular and Infection Microbiology · doi:10.3389/fcimb.2025.1611857 · Cited by 54
Rotman, E. R., McClure, S., Glazier, J., Fuerte-Stone, J., Foldi, J., Erani, A., McGann, R., Arnold, J. H., Lin, H., Valaitis, S. R., et al. (2024) · Cell Host & Microbe · doi:10.1016/j.chom.2024.09.004 · Cited by 48
Antibacterial agents active against Gram Negative Bacilli in phase I, II, or III clinical trials
Paterson, D. L. (2024) · Expert Opinion on Investigational Drugs · doi:10.1080/13543784.2024.2326028 · Cited by 44
Role of the gut microbiota in tumorigenesis and treatment
Liu, Q., Yang, Y., Pan, M., Yang, F., Yu, Y., & Qian, Z. (2024) · Theranostics · doi:10.7150/thno.91700 · Cited by 46
Zhang, Y., Sharma, S., Tom, L., Liao, Y., & Wu, V. C. H. (2023) · Microorganisms · doi:10.3390/microorganisms11102454 · Cited by 45
Bacteriophages as Targeted Therapeutic Vehicles: Challenges and Opportunities
Venkataraman, S., Shahgolzari, M., Yavari, A., & Hefferon, K. (2025) · Bioengineering · doi:10.3390/bioengineering12050469 · Cited by 38
Multi-year analysis of the global preclinical antibacterial pipeline: trends and gaps
Gigante, V., Alm, R. A., Melchiorri, D., Rocke, T. P., Arias, C. A., Czaplewski, L. G., FERNANDES, P. B., Franceschi, F. J., Harbarth, S., Kozlov, R. S., et al. (2024) · Antimicrobial Agents and Chemotherapy · doi:10.1128/aac.00535-24 · Cited by 39
A CRISPR-Cas9 system protecting E. coli against acquisition of antibiotic resistance genes
Lee, D., Muir, P., Lundberg, S., Lundholm, A., Sandegren, L., & Koskiniemi, S. (2025) · Scientific Reports · doi:10.1038/s41598-025-85334-2 · Cited by 38
Humolli, D., Piel, D., Maffei, E., Heyer, Y., Agustoni, E., Shaidullina, A., Willi, L., Imwinkelried, P., Estermann, F., Cuénod, A., et al. (2025) · PLOS Biology · doi:10.1371/journal.pbio.3003063 · Cited by 36
The Future of Microbiome Therapeutics
Pitashny, M., Kesten, I., Shlon, D., Hur, D. B., & Bar‐Yoseph, H. (2025) · Drugs · doi:10.1007/s40265-024-02107-3 · Cited by 36
Metagenomic editing of commensal bacteria in vivo using CRISPR-associated transposases
Gelsinger, D. R., Ronda, C., Ma, J., Kar, O. B., Edwards, M., Huang, Y., Mavros, C. F., Sun, Y., Perdue, T., Vo, P. L. H., et al. (2025) · Science · doi:10.1126/science.adx7604 · Cited by 37
Raigani, M., Eftekhari, Z., Adeli, A., & Kazemi‐Lomedasht, F. (2025) · Molecular Therapy — Nucleic Acids · doi:10.1016/j.omtn.2025.102666 · Cited by 36
Sun, X., Xue, F., Cong, C., Murtaza, B., Wang, L., Li, X., Li, S., & Xu, Y. (2024) · Food Research International · doi:10.1016/j.foodres.2024.114607 · Cited by 34
Kang, D., Bagchi, D., & Chen, I. A. (2023) · Advanced Therapeutics · doi:10.1002/adtp.202300355 · Cited by 33
Physiological drivers of pks+ E. coli in colorectal cancer
Jans, M., & Vereecke, L. (2025) · Trends in Microbiology · doi:10.1016/j.tim.2025.04.010 · Cited by 33
Phage-based delivery of CRISPR-associated transposases for targeted bacterial editing
Roberts, A., Adler, B. A., Cress, B. F., Doudna, J. A., & Barrangou, R. (2025) · Proceedings of the National Academy of Sciences · doi:10.1073/pnas.2504853122 · Cited by 33
Plasmid targeting and destruction by the DdmDE bacterial defence system
Bravo, J. P. K., Ramos, D., Ocampo, R. F., Ingram, C., & Taylor, D. W. (2024) · Nature · doi:10.1038/s41586-024-07515-9 · Cited by 32
Continuous multiplexed phage genome editing using recombitrons
Fishman, C. B., Crawford, K. D., Bhattarai-Kline, S., Poola, D., Zhang, K. H., González-Delgado, A., Rojas-Montero, M., & Shipman, S. L. (2024) · Nature Biotechnology · doi:10.1038/s41587-024-02370-5 · Cited by 32
Current application and future prospects of CRISPR-Cas in lactic acid Bacteria: A review
Xin, Y., Guo, T., & Qiao, M. (2025) · Food Research International · doi:10.1016/j.foodres.2025.116315 · Cited by 32
Chen, Y., Wu, X., Xu, C., Huang, J., Zhang, L., Qiu, P., Zheng, D., Chen, W., & Zhang, S. (2025) · International Journal of Molecular Medicine · doi:10.3892/ijmm.2025.5614 · Cited by 31
Fang, M., Zhang, R., Wang, C., Liu, Z.-Z., Fei, M., Tang, B., Yang, H., & Sun, D. (2024) · Applied and Environmental Microbiology · doi:10.1128/aem.00811-24 · Cited by 32
Microbiome-based therapeutics for Parkinson's disease
Hamilton, A. M., Krout, I. N., White, A. C., & Sampson, T. R. (2024) · Neurotherapeutics · doi:10.1016/j.neurot.2024.e00462 · Cited by 31
Mangalea, M. R., Halpin, A. L., Haile, M., Elkins, C. A., & McDonald, L. C. (2024) · Emerging infectious diseases · doi:10.3201/eid3006.231338 · Cited by 32
From Microbial Switches to Metabolic Sensors: Rewiring the Gut–Brain Kynurenine Circuit
Tanaka, M., & Vécsei, L. (2025) · Biomedicines · doi:10.3390/biomedicines13082020 · Cited by 31
Pacia, D. M., Brown, B. L., Minssen, T., & Darrow, J. J. (2024) · Journal of Law and the Biosciences · doi:10.1093/jlb/lsad030 · Cited by 28
Addressing the Research and Development Gaps in Modern Phage Therapy
Turner, P. E., Azeredo, J., Buurman, E. T., Green, S. I., Haaber, J., Haggstrom, D., Kameda, K., Kirchhelle, C., Moreno, M. G., Pirnay, J., et al. (2024) · PHAGE · doi:10.1089/phage.2023.0045 · Cited by 28
Self-citationAntimicrobial resistance at a turning point: microbial drivers, one health, and global futures
Elbehiry, A., Marzouk, E., & Abalkhail, A. (2025) · Frontiers in Microbiology · doi:10.3389/fmicb.2025.1698809 · Cited by 35
Evaluating phage lytic activity: from plaque assays to single-cell technologies
Panteleev, V., Kulbachinskiy, A. V., & Gelfenbein, D. M. (2025) · Frontiers in Microbiology · doi:10.3389/fmicb.2025.1659093 · Cited by 29
Chapadgaonkar, S. S., Bajpai, S., & Godbole, M. S. (2023) · Cancer Reports · doi:10.1002/cnr2.1847 · Cited by 28
Phage therapy in noncommunicable diseases
Kviatcovsky, D., Valdés‐Mas, R., Federici, S., & Elinav, E. (2023) · Science · doi:10.1126/science.adh2718 · Cited by 29
CRISPR–Cas therapies targeting bacteria
Benz, F., Beamud, B., Laurenceau, R., Maire, A., Duportet, X., Decrulle, A. L., & Bikard, D. (2025) · Nature Reviews Bioengineering · doi:10.1038/s44222-025-00311-8 · Cited by 26
Wang, L., Jiang, W., Yang, M., Danzeng, Q., Liu, S., & Cui, M. (2025) · Cell Communication and Signaling · doi:10.1186/s12964-025-02275-z · Cited by 28
Armed Phages: A New Weapon in the Battle Against Antimicrobial Resistance
Anastassopoulou, C. G., Tsakri, D., Panagiotopoulos, A.-P., Saldari, C., Sagona, A. P., & Tsakris, A. (2025) · Viruses · doi:10.3390/v17070911 · Cited by 29
Recent Advances in Antimicrobial Resistance: Insights from Escherichia coli as a Model Organism
Zhang, Z., Wei, M., Jia, B., & Yuan, Y. (2024) · Microorganisms · doi:10.3390/microorganisms13010051 · Cited by 25
Liu, C., Rosen, E. A., Stohs, E. J., Imlay, H. N., Nigo, M., Gottesdiener, L. S., So, M., Tverdek, F. P., Dadwal, S., Gudiol, C., et al. (2025) · The Lancet Infectious Diseases · doi:10.1016/s1473-3099(25)00311-1 · Cited by 25
Self-citationAdvanced Strategies in Phage Research: Innovations, Applications, and Challenges
Wu, P., Li, W., Zhang, W., Li, S., Deng, B., Xu, S., & Li, Z. (2025) · Microorganisms · doi:10.3390/microorganisms13081960 · Cited by 25
Gut microbiome and its metabolites in liver cirrhosis: mechanisms and clinical implications
Chang, L., Liu, Y., Li, H., Yan, J., Wu, W., Chen, N., Ma, C., Zhao, X., Chen, J., & Zhang, J. (2025) · Frontiers in Cellular and Infection Microbiology · doi:10.3389/fcimb.2025.1717696 · Cited by 26
Strain dynamics of contaminating bacteria modulate the yield of ethanol biorefineries
Lino, F. S. D. O., Garg, S., Li, S. S., Misiakou, M.-A., Kang, K., da Costa, B. L. V., Beyer-Pedersen, T. S.-A., Giacon, T. G., Basso, T. O., Panagiotou, G., et al. (2024) · Nature Communications · doi:10.1038/s41467-024-49683-2 · Cited by 25
Self-citationCRISPR-Cas-assisted phage engineering for personalized antibacterial treatments
Chaudhary, N., Sharma, K., Kaur, H., Prajapati, S., Mohan, B., & Taneja, N. (2024) · Indian Journal of Medical Microbiology · doi:10.1016/j.ijmmb.2024.100771 · Cited by 24
Personalized bacteriophage therapy for chronic biliary tract Pseudomonas aeruginosa infections
Li, N., Li, L., He, B., Li, D., Jin, W., Wu, Y. S., Zhu, B., Cheng, M., Wu, N., Tan, D., et al. (2025) · hLife · doi:10.1016/j.hlife.2025.03.004 · Cited by 24
Reconstructing the Antibiotic Pipeline: Natural Alternatives to Antibacterial Agents
Ekwueme, C. T., Anyiam, I. V., Ekwueme, D. C., Anumudu, C. K., & Onyeaka, H. N. (2025) · Biomolecules · doi:10.3390/biom15081182 · Cited by 25
Quorum sensing in bacteria: insights into communication and inhibition strategies—a review
Das, A., Biswas, R., Najiar, R., Thatharaju, P., Biswas, S., & Mohan, U. (2026) · Archives of Microbiology · doi:10.1007/s00203-025-04610-x · Cited by 24
Zhao, Y., Zhu, M., Ling, Y., Zhao, Y., Lu, X., Chu, B., He, Y., & Wang, H. (2025) · Advanced Materials · doi:10.1002/adma.202417334 · Cited by 25
Roson-Calero, N., Ballesté‐Delpierre, C., Fernández, J., & Vilà, J. (2023) · Antibiotics · doi:10.3390/antibiotics12061074 · Cited by 24
Advanced Bioinspired Multifunctional Platforms Focusing on Gut Microbiota Regulation
Li, M., Wang, L., Lin, D., Liu, Z., Wang, H., Yang, Y., Sun, C., Ye, J., & Liu, Y. (2024) · ACS Nano · doi:10.1021/acsnano.4c05013 · Cited by 24
Qi, M., & Tay, A. K. P. (2025) · Nanoscale · doi:10.1039/d5nr02249e · Cited by 22
Alessa, O., Aiba, Y., Arbaah, M., Hidaka, Y., Watanabe, S., Miyanaga, K., Wannigama, D. L., & Cui, L. (2025) · Molecules · doi:10.3390/molecules30153132 · Cited by 21
Yu, Y., Wang, M., Ju, L., Li, M., Zhao, M., Deng, H., Rensing, C., Yang, Q., & Zhou, S. (2024) · mBio · doi:10.1128/mbio.02957-24 · Cited by 21
The gut virome and human health: From diversity to personalized medicine
Lathakumari, R. H., Vajravelu, L. K., Gopinathan, A., Vimala, P. B., Panneerselvam, V. P., Ravi, S. S. S., & Thulukanam, J. (2025) · Engineering Microbiology · doi:10.1016/j.engmic.2025.100191 · Cited by 22
Ronda, C., Perdue, T., Schwanz, L. T., Gelsinger, D. R., Brockmann, L., Kaufman, A., Huang, Y., Sternberg, S. H., & Wang, H. H. (2025) · Nature Biomedical Engineering · doi:10.1038/s41551-025-01453-1 · Cited by 21
Bacterial small molecule metabolites implicated in gastrointestinal cancer development
Turocy, T., & Crawford, J. M. (2024) · Nature Reviews Microbiology · doi:10.1038/s41579-024-01103-4 · Cited by 22
Synthetic Biology‐Based Engineering Living Therapeutics for Antimicrobial Application
Huang, S., Zhao, S., Zhao, H., Wen, M., & Guo, Z. (2025) · Exploration · doi:10.1002/exp.20240045 · Cited by 21
CRISPR-based genetic tools for the study of host-microbe interactions
Galindo, M. E., & Lai, Y. (2025) · Infection and Immunity · doi:10.1128/iai.00510-24 · Cited by 20
Engineering bacteriophages for gut health: precision antimicrobials and beyond
Xu, M., Chen, S., Pei, H., Hu, L., & Zhang, Y. (2026) · Journal of Nanobiotechnology · doi:10.1186/s12951-026-04038-5 · Cited by 19
Vialetto, E., Miele, S., Goren, M. G., Yu, J., Yu, Y., Collias, D., Beamud, B., Osbelt, L., Lourenço, M., Strowig, T., et al. (2024) · Nucleic Acids Research · doi:10.1093/nar/gkae281 · Cited by 19
A review of bacteriophage and their application in domestic animals in a post-antibiotic era
Guo, X., Luo, G., Hou, F., Zhou, C., Liu, X., Lei, Z., Niu, D. X., Ran, T., & Tan, Z. (2024) · The Science of The Total Environment · doi:10.1016/j.scitotenv.2024.174931 · Cited by 18
Applications of bacteriophages in precision engineering of the human gut microbiome
Kuang, X., Shen, J., Zheng, L., Duan, Y., Ma, Y., Leung, E. L., & Dai, L. (2025) · Engineering Microbiology · doi:10.1016/j.engmic.2025.100189 · Cited by 19
Li, P., Ma, W., Cheng, J., Zhan, C., Lu, H., Shen, J., & Zhou, X. (2025) · Emerging Microbes & Infections · doi:10.1080/22221751.2025.2455592 · Cited by 18
The rise, fall, and resurgence of phage therapy for urinary tract infection
Zulk, J. J., Patras, K. A., & Maresso, A. W. (2024) · EcoSal Plus · doi:10.1128/ecosalplus.esp-0029-2023 · Cited by 18
Targeted delivery of genome editors in vivo
Ngo, W., Wu, J. L. Y., Wasko, K. M., & Doudna, J. A. (2026) · Nature Biotechnology · doi:10.1038/s41587-025-02945-w · Cited by 18
Genome engineering of the human gut microbiome
Zheng, L., Shen, J., Chen, R., Hu, Y., Zhao, W., Leung, E. L., & Dai, L. (2024) · Journal of genetics and genomics/Journal of Genetics and Genomics · doi:10.1016/j.jgg.2024.01.002 · Cited by 17
Zheng, J., & Chen, H. (2024) · Frontiers in Oncology · doi:10.3389/fonc.2024.1429722 · Cited by 19
Yuan, X., Fan, L., Jin, H., Wu, Q., & Ding, Y. (2025) · Current Opinion in Food Science · doi:10.1016/j.cofs.2025.101274 · Cited by 17
Avian Pathogenic Escherichia coli: Advances in Pathogenesis, Diagnosis, and Control
Kamal, O. M., Kneuper, H., Cogan, T. A., & Woodward, M. J. (2025) · Veterinary Sciences · doi:10.3390/vetsci13010019 · Cited by 16
The Role of Genomics in Advancing and Standardising Bacteriophage Therapy
Абдраймова, Н. К., Shitikov, E. A., & Kornienko, M. A. (2026) · Antibiotics · doi:10.3390/antibiotics15010055 · Cited by 16
Wang, J., Su, X., Zhu, Q., Zhai, Y., Dai, X., Tang, N., Pan, W., Xiang, H., & Zhu, M. (2024) · Chemical Engineering Journal · doi:10.1016/j.cej.2024.152246 · Cited by 16
Peng, S., Xu, Y., Qu, H., Nong, F., Shu, F., Yuan, G., Ruan, L., & Zheng, D. (2024) · mBio · doi:10.1128/mbio.00619-24 · Cited by 16
Mu, Y., Song, Y., Tian, X., Ding, Z., Yao, S., Li, Y., Wang, C., Wei, D., Vollmer, W., Zhang, G., et al. (2025) · mLife · doi:10.1002/mlf2.70003 · Cited by 15
Thakur, D., & Kumar, L. (2025) · Critical Reviews in Microbiology · doi:10.1080/1040841x.2025.2548490 · Cited by 17
Yang, Y., Xu, Z., Soteyome, T., Premarathna, M., Yin, X., & Liu, J. (2025) · Pharmaceuticals · doi:10.3390/ph18111688 · Cited by 17
Gulig, P. A., Swindle, S., Fields, M. A., & Eisenman, D. (2024) · Applied Biosafety · doi:10.1089/apb.2024.0002 · Cited by 19
Lewis, J. M., Williams, J., & Sagona, A. P. (2024) · Biochemical Society Transactions · doi:10.1042/bst20231289 · Cited by 16
Gut microbiota — bidirectional modulator: role in inflammatory bowel disease and colorectal cancer
Cui, X., Li, C., Zhong, J., Liu, Y., Xiao, P., Liu, C., Zhao, M., & Yang, W. (2025) · Frontiers in Immunology · doi:10.3389/fimmu.2025.1523584 · Cited by 16
Phage Therapy for Urinary Tract Infections: Progress and Challenges Ahead
Morgan, C. J., Atkins, H., Wolfe, A. J., Brubaker, L. T., Aslam, S., Putonti, C., Doud, M. B., & Burnett, L. A. (2025) · International Urogynecology Journal · doi:10.1007/s00192-025-06136-8 · Cited by 15
Recent advances of engineered bacteria for therapeutic applications
Xiang, X., Zhou, Z., Rao, X., & Jiang, X. (2025) · Molecular Therapy · doi:10.1016/j.ymthe.2025.11.013 · Cited by 17
Kristensen, C. S., Petersen, A. Ø., Kilstrup, M., van der Helm, E., & Takos, A. M. (2024) · Synthetic Biology · doi:10.1093/synbio/ysae012 · Cited by 14
Self-citationAdvancements in CRISPR-Cas-based strategies for combating antimicrobial resistance
Zhang, R., Zhou, Q., Huang, S., Zhang, N., & Sun, D. (2025) · Microbiological Research · doi:10.1016/j.micres.2025.128232 · Cited by 15
Bacteriophage Therapy to Combat Microbial Infections and Antimicrobial Resistance
Sharma, D., Singh, I., Sharma, J., Verma, I. K., & Ratn, A. (2025) · Journal of Basic Microbiology · doi:10.1002/jobm.70090 · Cited by 14
Petersen, A. Ø., Damholt, B. B., Grove, M. F., Hink, J., Marotte-Hurbon, T., Söderqvist, J., Troy, A., Zdravkovic, M., Bayer, L., Brunner, K., et al. (2026) · The Lancet Microbe · doi:10.1016/j.lanmic.2025.101257 · Cited by 13
Self-citationOpportunities and challenges in phage therapy for cardiometabolic diseases
Wortelboer, K., & Herrema, H. (2024) · Trends in Endocrinology and Metabolism · doi:10.1016/j.tem.2024.03.007 · Cited by 13
Raza, A., Fatima, P., Yasmeen, B., Rana, Z. A., & Ellakwa, D. E. (2024) · Naunyn-Schmiedeberg s Archives of Pharmacology · doi:10.1007/s00210-024-03509-6 · Cited by 15
Cutting-edge tools for unveiling the dynamics of plasmid–host interactions
Yang, Q., Gao, J. T., Zhou, S. G., & Walsh, T. R. (2025) · Trends in Microbiology · doi:10.1016/j.tim.2024.12.013 · Cited by 14
Liu, L., Zhao, W., Zhang, H., Shang, Y., Huang, W., & Cheng, Q. (2025) · Frontiers in Microbiology · doi:10.3389/fmicb.2025.1550783 · Cited by 13
Yin, J., Sun, W., Xiong, H., Yao, W., Liu, X., Jiang, H., & Wang, X. (2025) · Biomaterials · doi:10.1016/j.biomaterials.2025.123388 · Cited by 13
Metadata
- Authors
- Gencay, Y. E., Jasinskytė, D., Robert, C., Semsey, S., Martínez, V., Petersen, A. Ø., Brunner, K., de Santiago Torio, A., Salazar, A., Turcu, I. C., Eriksen, M. K., Koval, L., Takos, A., Pascal, R., Schou, T. S., Bayer, L., Bryde, T., Johansen, K. C., Bak, E. G., Smrekar, F., Doyle, T. B., Satlin, M. J., Gram, A., Carvalho, J., Jessen, L., Hallström, B., Hink, J., Damholt, B., Troy, A., Grove, M., Clube, J., Grøndahl, C., Haaber, J. K., van der Helm, E., Zdravkovic, M., & Sommer, M. O. A.
- Affiliations
- JMI Laboratories (US)
- Weill Cornell Medicine (US)
- Novo Nordisk Foundation (DK)
- Corresponding author
- Sommer, Morten Otto Alexander
- ORCID
- Venue
- Nature Biotechnology
- Published
- 2023-05-04
- Volume
- 42
- Issue
- 2
- Pages
- 265-274
- ISSN
- 0733-222X (ISSN-L)
- 1087-0156
- 1546-1696
- PMC
- PMC10869271
- OpenAlex
- W4372330661
- Cited by
- 282
- References
- 63
- Citations by year
- 2026: 92 · 2025: 114 · 2024: 59 · 2023: 17
- FWCI
- 45.54
- Type
- journal article
- Language
- en
- Open access
- hybrid
- doi.org
- Locations
- Nature Biotechnology (publishedVersion, cc-by)
- PubMed Central (publishedVersion, cc-by)
- PubMed (publishedVersion)
- Technical University of Denmark, DTU Orbit (Technical University of Denmark, DTU) (submittedVersion, other-oa)
- Funders
- Wellcome Trust
- Combating Antibiotic-Resistant Bacteria Biopharmaceutical Accelerator (IDSEP160030)
- Lundbeckfonden (R77-2010-6772, R140-2013-13496)
- Novo Nordisk Fonden (NNF21OC0070455, NNF22OC0081058, NNF21OC0072832, NNF14OC0011335, NNF17OC0028232, NNF10CC1016517, NNF22OC0080975, NNF21OC0069281)
- Biomedical Advanced Research and Development Authority (IDSEP160030)
- Topics
- Life Sciences › Immunology and Microbiology › Virology › Bacteriophages and microbial interactions
- Life Sciences › Biochemistry, Genetics and Molecular Biology › Molecular Biology › CRISPR and Genetic Engineering
- Life Sciences › Biochemistry, Genetics and Molecular Biology › Genetics › Virus-based gene therapy research
- Keywords
- phage therapy, CRISPR-Cas, Escherichia coli, bacteriophages, phage engineering, biofilm, gut microbiota, antibiotic resistance, minipig model, phage cocktail
- MeSH terms
- Animals, Anti-Bacterial Agents, Bacteriophages, Escherichia coli, Humans, Swine, Swine, Miniature, Mice, CRISPR-Cas Systems
About these checks
Registry, retraction, Cites and statistics results are computed, not judged, with one exception: a printed reference that no index lists is read once by a model before it counts as a citation error. Claims are extracted by a model and kept only when their quote appears verbatim in the text; each cited source is then checked, with a model’s help, for whether it says what the claim relies on. Those verdicts can be wrong — read the claim’s quote and the cited source before relying on one.
Statistics and arithmetic are recomputed, not judged.
Confidence bands are shown only for fields calibrated on our annotated test set. None is calibrated yet, so no band is shown.
What counts as a claim ›How we measure confidence ›How we check this ›
Are you an author, or do you see a problem with this page? Request a review
