

The DOI matches its Crossref record; 57 of the 57 references it cites were found in a registry or an index.
Chemical acylation of an acquired serine suppresses oncogenic signaling of K-Ras(G12S)
Open accessAbstract
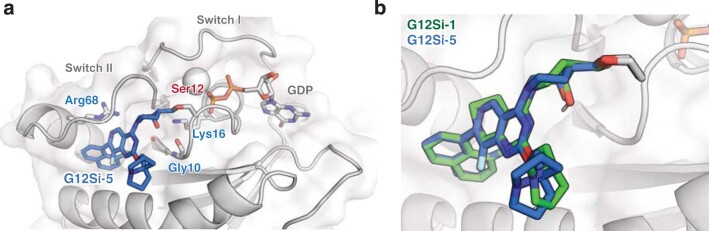
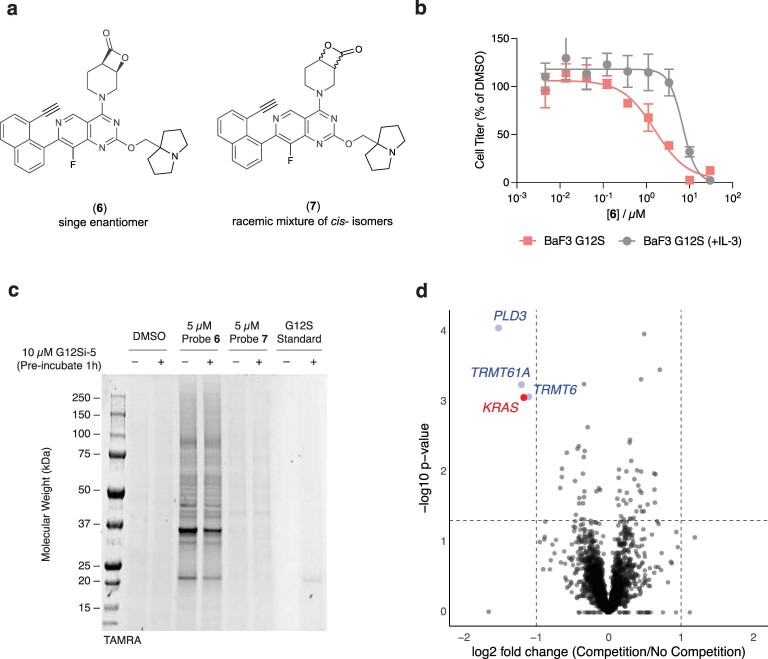
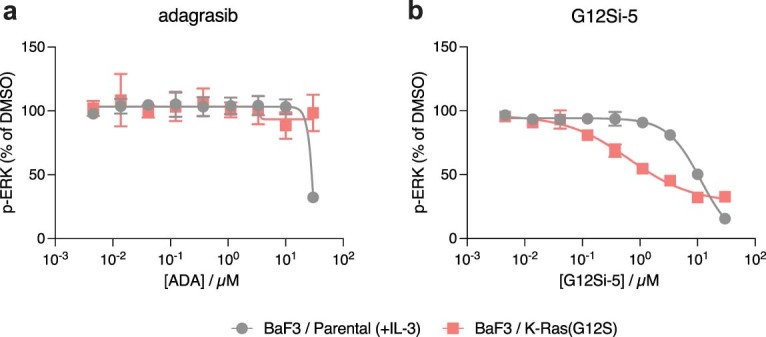
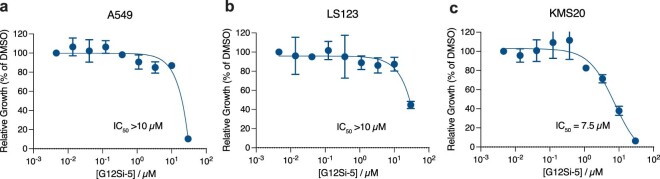
Drugs that directly impede the function of driver oncogenes offer exceptional efficacy and a therapeutic window. The recently approved mutant selective small-molecule cysteine-reactive covalent inhibitor of the G12C mutant of K-Ras, sotorasib, provides a case in point. KRAS is the most frequently mutated proto-oncogene in human cancer, yet despite success targeting the G12C allele, targeted therapy for other hotspot mutants of KRAS has not been described. Here we report the discovery of small molecules that covalently target a G12S somatic mutation in K-Ras and suppress its oncogenic signaling. We show that these molecules are active in cells expressing K-Ras(G12S) but spare the wild-type protein. Our results provide a path to targeting a second somatic mutation in the oncogene KRAS by overcoming the weak nucleophilicity of an acquired serine residue. The chemistry we describe may serve as a basis for the selective targeting of other unactivated serines.
Overview
The claims and statistics of this paper haven’t been checked yet.
Run the check — free, no account needed. It reads the open-access text and checks the sources it cites.
Integrity signals
Registry
Cites
Statistics
Figures
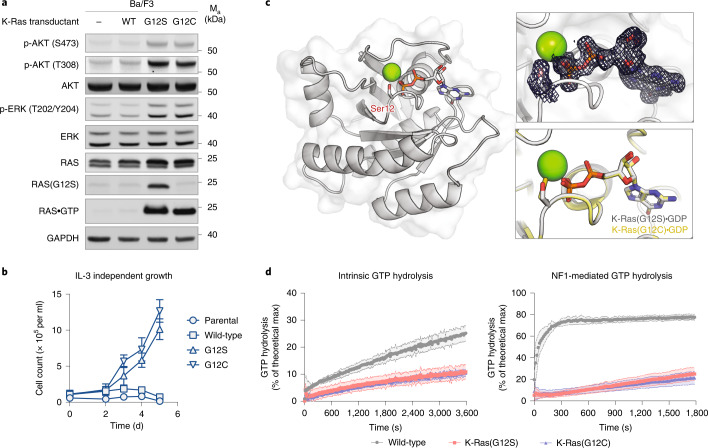
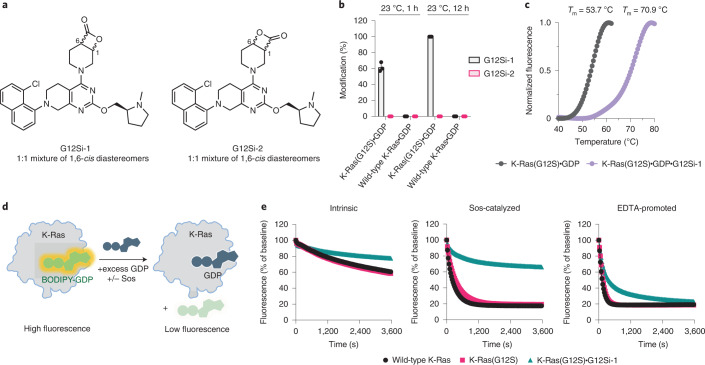
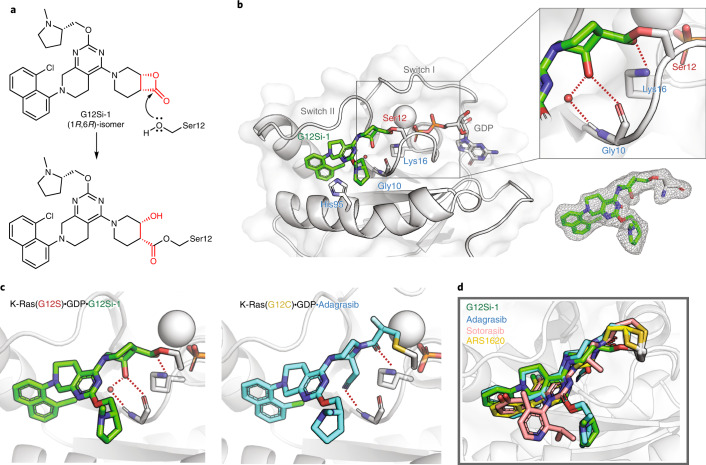
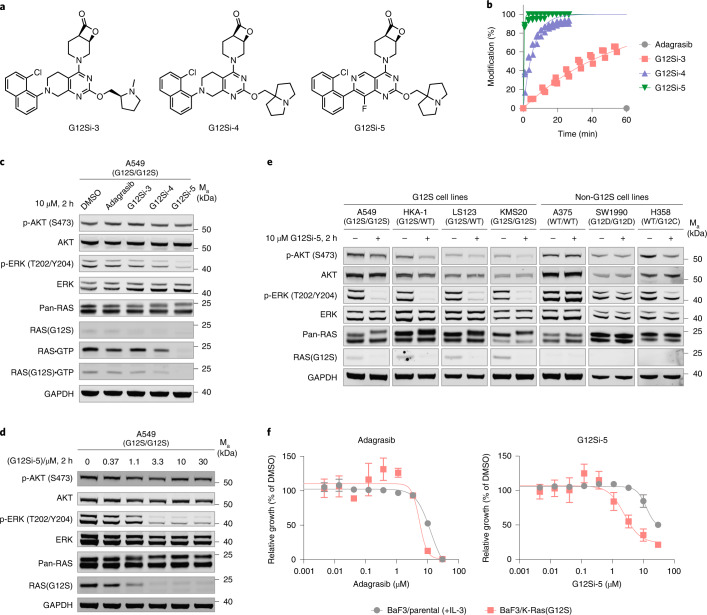
Verification
Claims the paper makes
The claims and statistics of this paper haven’t been checked yet.
Run the check — free, no account needed. It reads the open-access text and checks the sources it cites.
Claims other papers make about this one
Each is checked against this paper’s own text: does it say what the citing paper says it does?
The source backs part of the claim, not all of it — or backs it for a different population, condition or comparison.
In the citing paper
“These compounds showed GDP-bound KRAS selectivity.”
From KRAS: Biology, Inhibition, and Mechanisms of Inhibitor Resistance (2024) · cites this paper as [59]
Experimental — accuracy not yet measuredThe source backs part of the claim, not all of it — or backs it for a different population, condition or comparison.
In the citing paper
“These molecules were effective at halting the growth of cells expressing KRAS G12S at concentrations greater than 10 μM.”
From KRAS: Biology, Inhibition, and Mechanisms of Inhibitor Resistance (2024) · cites this paper as [59]
Experimental — accuracy not yet measuredThe cited source says what the claim attributes to it.
In the citing paper
“Compounds containing β-lactone electrophiles, designed to mimic the chemistry of natural proteasome inhibitors, covalently acylate the mutant serine of G12S in the switch II pocket.”
From KRAS: Biology, Inhibition, and Mechanisms of Inhibitor Resistance (2024) · cites this paper as [59]
The cited source says what the claim attributes to it.
In the citing paper
“In 2022, the Shokat lab introduced a novel KRAS G12S-selective covalent inhibitor [59].”
From KRAS: Biology, Inhibition, and Mechanisms of Inhibitor Resistance (2024) · cites this paper as [59]
In the citing paper
“Using adagrasib as the parent core, they introduced a, β-lactone structure that can covalently target serine and successfully developed the first selective covalent inhibitor G12Si-5 (24) targeting KRASG12S mutants.”
From Recent advances in targeting the “undruggable” proteins: from drug discovery to clinical trials (2023) · cites this paper as [93]
In the citing paper
“G12Si-5 binds to the S-II P domain and inhibits oncogenic signaling, reducing ERK phosphorylation in KRASG12S mutant cells.”
From Recent advances in targeting the “undruggable” proteins: from drug discovery to clinical trials (2023) · cites this paper as [93]
In the citing paper
“In 2022, Shokat and colleagues reported the development of covalent inhibitors of KRASG12S mutants and KRASG12R mutants.93,94”
From Recent advances in targeting the “undruggable” proteins: from drug discovery to clinical trials (2023) · cites this paper as [93]
In the citing paper
“The IC50 value of G12Si-5 in A549 cell line was 2.4 μM.93”
From Recent advances in targeting the “undruggable” proteins: from drug discovery to clinical trials (2023) · cites this paper as [93]
Self-check
Percentages, sums and reported differences re-computed from the paper’s own numbers.
The self-check needs the paper’s full text.
Citations
Cites
Features and development of Coot
Emsley, P., Lohkamp, B., Scott, W. G., & Cowtan, K. (2010) · Acta Crystallographica Section D Biological Crystallography · doi:10.1107/s0907444910007493 · Cited by 29,915
PHENIX : a comprehensive Python-based system for macromolecular structure solution
Adams, P. D., Afonine, P. V., Bunkóczi, G., Chen, V. B., Davis, I. W., Echols, N., Headd, J. J., Hung, L.-W., Kapral, G. J., Grosse-Kunstleve, R. W., et al. (2010) · Acta Crystallographica Section D Biological Crystallography · doi:10.1107/s0907444909052925 · Cited by 23,716
Phaser crystallographic software
McCoy, A. J., Grosse-Kunstleve, R. W., Adams, P. D., Winn, M. D., Storoni, L. C., & Read, R. J. (2007) · Journal of Applied Crystallography · doi:10.1107/s0021889807021206 · Cited by 20,612
Overview of the CCP 4 suite and current developments
Winn, M. D., Ballard, C. C., Cowtan, K. D., Dodson, E. J., Emsley, P., Evans, P. R., Keegan, R. M., Krissinel, E. B., Leslie, A. G. W., McCoy, A., et al. (2011) · Acta Crystallographica Section D Biological Crystallography · doi:10.1107/s0907444910045749 · Cited by 12,353
Enzymatic assembly of DNA molecules up to several hundred kilobases
Gibson, D. G., Young, L., Chuang, R.-Y., Venter, J. C., Hutchison, C. A., & Smith, H. O. (2009) · Nature Methods · doi:10.1038/nmeth.1318 · Cited by 10,088 · cited 1×
“…amino acids 1–169), human K-Ras (G12S, amino acids 1–169), human K-Ras G12S Cyslight (G12S/C51S/C80L/C118S, amino acids 1–169) and human NF1-GRD (amino acids 1,203–1,530) were codon optimized, synthesized by Twist Biosciences and cloned into pJExpress411 vector using the Gibson assembly method 51 .”
How good are my data and what is the resolution?
Evans, P. R., & Murshudov, G. N. (2013) · Acta Crystallographica Section D Biological Crystallography · doi:10.1107/s0907444913000061 · Cited by 4,743
iMOSFLM: a new graphical interface for diffraction-image processing withMOSFLM
Battye, T. G. G., Kontogiannis, L., Johnson, O., Powell, H. R., & Leslie, A. G. W. (2011) · Acta Crystallographica Section D Biological Crystallography · doi:10.1107/s0907444910048675 · Cited by 2,880
K-Ras(G12C) inhibitors allosterically control GTP affinity and effector interactions
Ostrem, J. M., Peters, U., Sos, M. L., Wells, J. A., & Shokat, K. M. (2013) · Nature · doi:10.1038/nature12796 · Cited by 2,557 · cited 1×
“To design compounds targeting K-Ras(G12S), we drew lessons from the successful drug discovery efforts directed against K-Ras (G12C) 9,11,15,40 , as well as a family of β -lactone-containing natural products (for example, salinosporamide A, omuralide) that inhibit the 20S proteasome by forming a…”
Self-citationThe Clinical KRAS(G12C) Inhibitor AMG 510 Drives Anti-Tumour Immunity
Canon, J., Rex, K., Saiki, A. Y., Mohr, C., Cooke, K., Bagal, D., Gaida, K., Holt, T., Knutson, C. G., Koppada, N., et al. (2019) · Nature · doi:10.1038/s41586-019-1694-1 · Cited by 2,277
AACR Project GENIE: Powering Precision Medicine through an International Consortium
The AACR Project GENIE Consortium, The AACR Project GENIE Consortium, André, F., Arnedos, M., Baras, A. S., Baselga, J., Bedard, P. L., Berger, M. F., Bierkens, M., Calvo, F., et al. (2017) · Cancer Discovery · doi:10.1158/2159-8290.cd-17-0151 · Cited by 1,964
Cited by
Sorted by citations
Recent advances in targeting the “undruggable” proteins: from drug discovery to clinical trials
Xie, X., Yu, T., Li, X., Zhang, N., Foster, L. J., Peng, C., Huang, W., & He, G. (2023) · Signal Transduction and Targeted Therapy · doi:10.1038/s41392-023-01589-z · Cited by 396
Emerging and Re-emerging Warheads for Targeted Covalent Inhibitors: An Update
Hillebrand, L., Liang, X. J., Serafim, R. A. M., & Gehringer, M. (2024) · Journal of Medicinal Chemistry · doi:10.1021/acs.jmedchem.3c01825 · Cited by 222
Drugging KRAS: Current perspectives and state-of-art review
Parikh, K., Banna, G., Liu, S. V., Friedlaender, A., Desai, A., Subbiah, V., & Addeo, A. (2022) · Journal of Hematology & Oncology · doi:10.1186/s13045-022-01375-4 · Cited by 164
Exploiting the therapeutic implications of KRAS inhibition on tumor immunity
Molina-Arcas, M., & Downward, J. (2024) · Cancer Cell · doi:10.1016/j.ccell.2024.02.012 · Cited by 152
KRAS G12D targeted therapies for pancreatic cancer: Has the fortress been conquered?
Bannoura, S. F., Khan, H. Y., & Azmi, A. S. (2022) · Frontiers in Oncology · doi:10.3389/fonc.2022.1013902 · Cited by 122
“Less prevalent in PDAC, the G12S mutation in KRAS has also been targeted recently with compounds that acylate the noncatalytic mutant serine 12 residue (62).”
Background
Metadata
- Authors
- Zhang, Z., Guiley, K. Z., & Shokat, K. M.
- Affiliations
- Howard Hughes Medical Institute (US)
- Corresponding author
- Shokat, Kevan M.
- Venue
- Nature Chemical Biology
- Published
- 2022-07-21
- Volume
- 18
- Issue
- 11
- Pages
- 1177-1183
- ISSN
- 1552-4450 (ISSN-L)
- 1552-4469
- PMC
- PMC9596369
- OpenAlex
- W4286203125
- Cited by
- 153
- References
- 57
- Citations by year
- 2026: 23 · 2025: 36 · 2024: 51 · 2023: 34 · 2022: 9
- FWCI
- 10.70
- Type
- journal article
- Language
- en
- Open access
- hybrid
- doi.org
- Locations
- Nature Chemical Biology (publishedVersion, cc-by)
- PubMed Central (publishedVersion, cc-by)
- PubMed (publishedVersion)
- eScholarship (California Digital Library) (submittedVersion, cc-by)
- Funders
- Samuel Waxman Cancer Research Foundation
- Howard Hughes Medical Institute
- U.S. Department of Health & Human Services | National Institutes of Health (R01CA244550)
- The Emerald Foundation The Mark Foundation
- Damon Runyon Cancer Research Foundation (DRG-2281-17, DRG-2399-20)
- Topics
- Life Sciences › Biochemistry, Genetics and Molecular Biology › Molecular Biology › Protein Kinase Regulation and GTPase Signaling
- Life Sciences › Biochemistry, Genetics and Molecular Biology › Molecular Biology › Protein Tyrosine Phosphatases
- Life Sciences › Biochemistry, Genetics and Molecular Biology › Molecular Biology › Protein Degradation and Inhibitors
- Keywords
- KRAS oncogenic signaling, covalent inhibitors, small molecule inhibitors, sotorasib
- MeSH terms
- Acylation, Cysteine, Humans, Mutation, Oncogenes, Serine, Proto-Oncogene Proteins p21(ras)
About these checks
Registry, retraction, Cites and statistics results are computed, not judged, with one exception: a printed reference that no index lists is read once by a model before it counts as a citation error. Claims are extracted by a model and kept only when their quote appears verbatim in the text; each cited source is then checked, with a model’s help, for whether it says what the claim relies on. Those verdicts can be wrong — read the claim’s quote and the cited source before relying on one.
Statistics and arithmetic are recomputed, not judged.
Confidence bands are shown only for fields calibrated on our annotated test set. None is calibrated yet, so no band is shown.
What counts as a claim ›How we measure confidence ›How we check this ›
Are you an author, or do you see a problem with this page? Request a review
