

The DOI matches its Crossref record; 40 of the 41 references it cites were found in a registry or an index; 1 of the 6 sources its claims cite were checked for support.
Correlates of protection against symptomatic and asymptomatic SARS-CoV-2 infection
Open accessAbstract
The global supply of COVID-19 vaccines remains limited. An understanding of the immune response that is predictive of protection could facilitate rapid licensure of new vaccines. Data from a randomized efficacy trial of the ChAdOx1 nCoV-19 (AZD1222) vaccine in the United Kingdom was analyzed to determine the antibody levels associated with protection against SARS-CoV-2. Binding and neutralizing antibodies at 28 days after the second dose were measured in infected and noninfected vaccine recipients. Higher levels of all immune markers were correlated with a reduced risk of symptomatic infection. A vaccine efficacy of 80% against symptomatic infection with majority Alpha (B.1.1.7) variant of SARS-CoV-2 was achieved with 264 (95% CI: 108, 806) binding antibody units (BAU)/ml: and 506 (95% CI: 135, not computed (beyond data range) (NC)) BAU/ml for anti-spike and anti-RBD antibodies, and 26 (95% CI: NC, NC) international unit (IU)/ml and 247 (95% CI: 101, NC) normalized neutralization titers (NF 50) for pseudovirus and live-virus neutralization, respectively. Immune markers were not correlated with asymptomatic infections at the 5% significance level. These data can be used to bridge to new populations using validated assays, and allow extrapolation of efficacy estimates to new COVID-19 vaccines.
Overview
AI snapshot
Written from the paper’s full text.
TL;DR
In the UK COV002 trial, higher anti-spike IgG, anti-RBD IgG, pseudovirus neutralizing, and live-virus neutralizing antibody levels at 28 days after a second ChAdOx1 nCoV-19 dose were associated with lower risk of symptomatic COVID-19, but not asymptomatic infection. Antibody values corresponding to 80% vaccine efficacy against primary symptomatic COVID-19 were 264 BAU/ml for anti-spike IgG, 506 BAU/ml for anti-RBD IgG, 26 IU/ml for pseudovirus neutralization, and 247 NF50 for live-virus neutralization.
Key findings
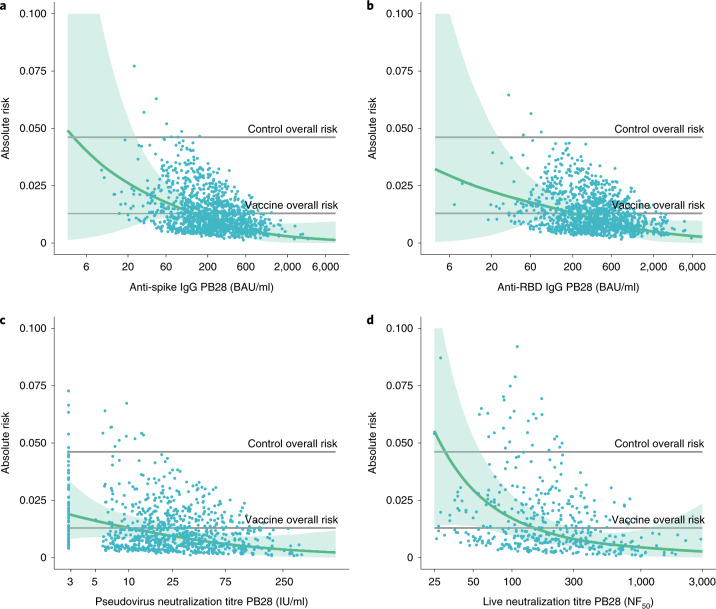
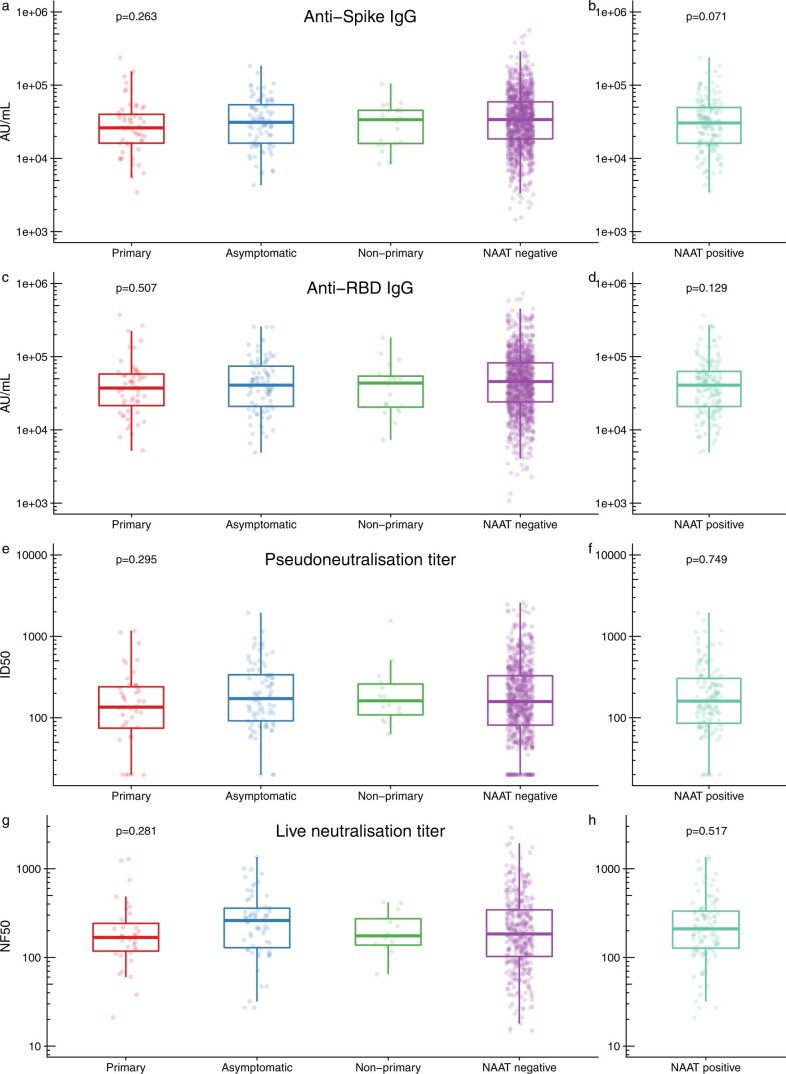
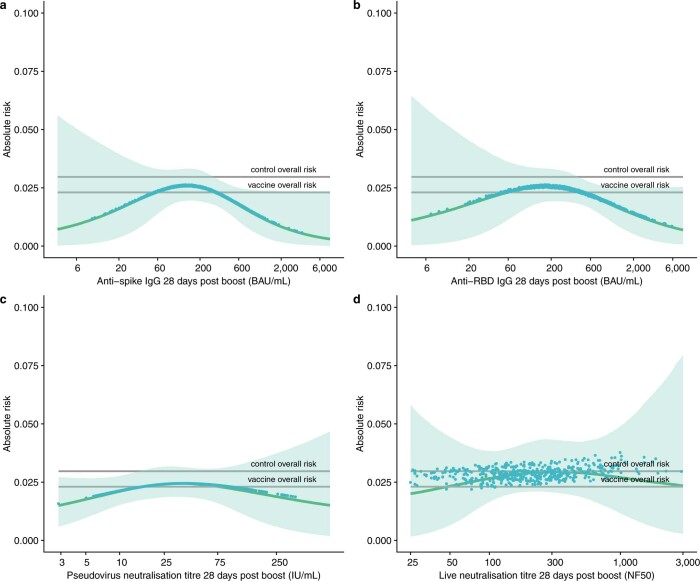
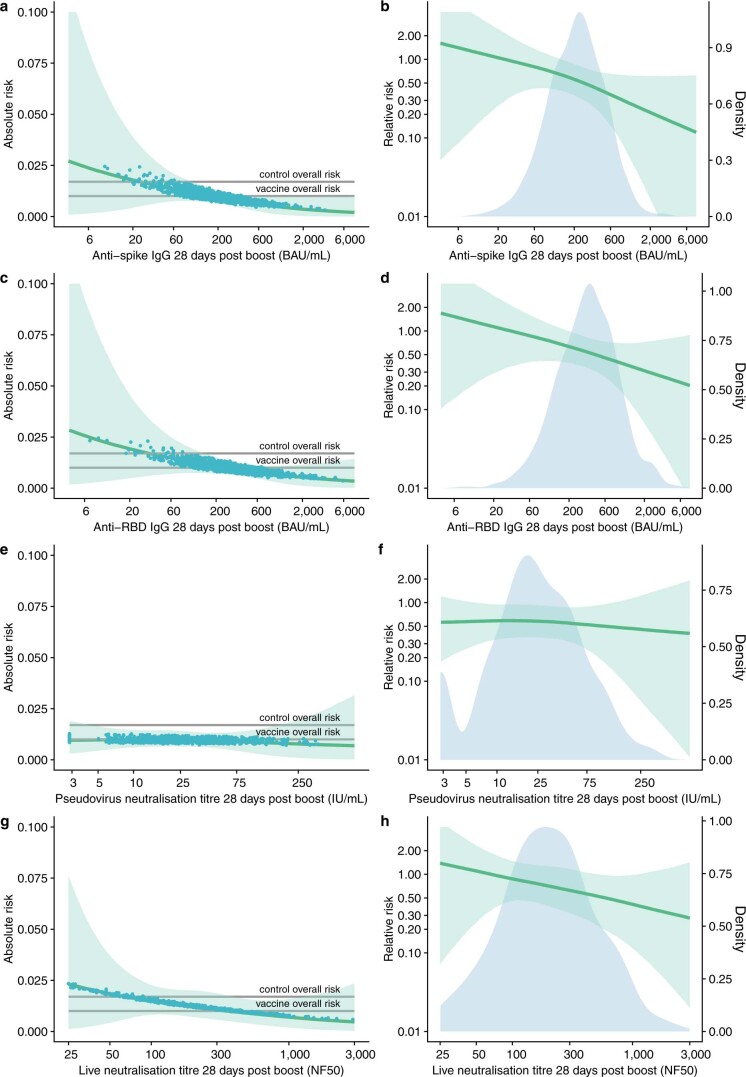
- Among 4,372 participants in the correlates population, there were 174 breakthrough NAAT+ SARS-CoV-2 infections; correlates analysis included 171 cases and 1,404 noncases with at least one assay readout. Risk of symptomatic COVID-19 decreased with increasing anti-spike IgG (P = 0.003), anti-RBD IgG (P = 0.018), pseudovirus neutralization titer (P = 0.005), and live-virus neutralization titer (P < 0.001).
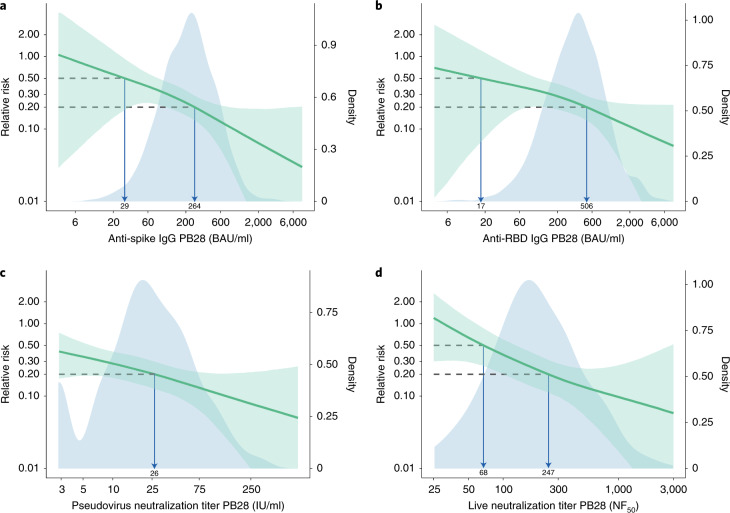
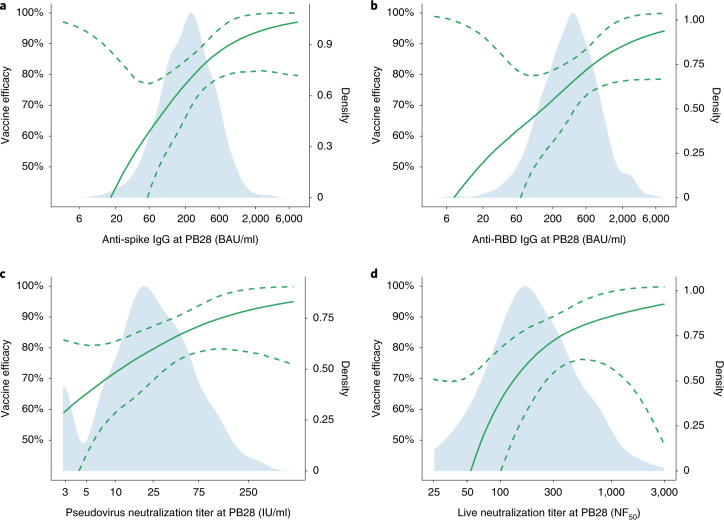
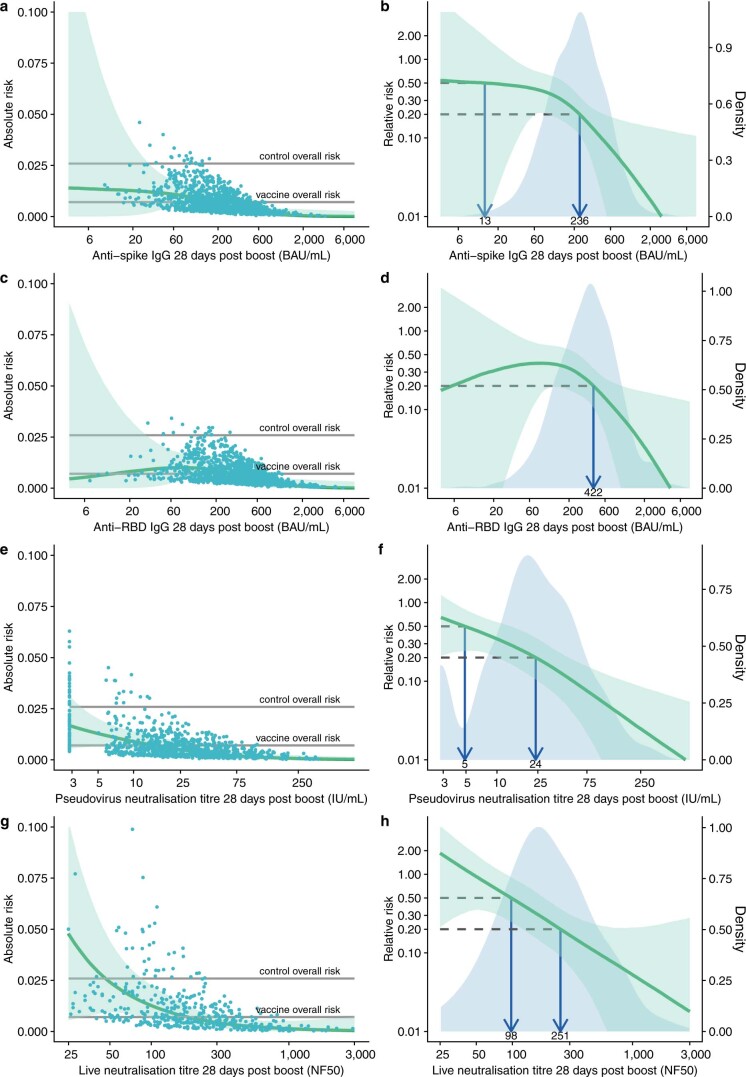
- The antibody level associated with 80% VE against primary symptomatic COVID-19 was 40,923 AU/ml anti-spike IgG, equivalent to 264 BAU/ml (95% CI: 108, 806); 506 BAU/ml anti-RBD IgG (95% CI: 135, NC); 26 IU/ml pseudovirus neutralization (95% CI: NC, NC); and 247 NF50 live-virus neutralization (95% CI: 101, NC).
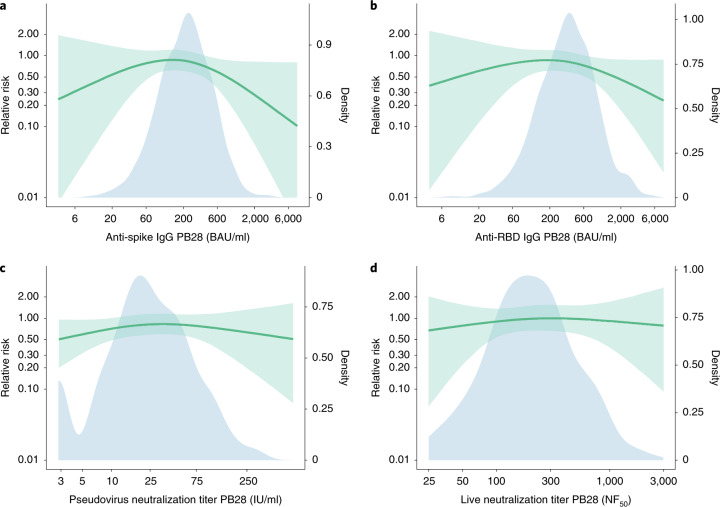
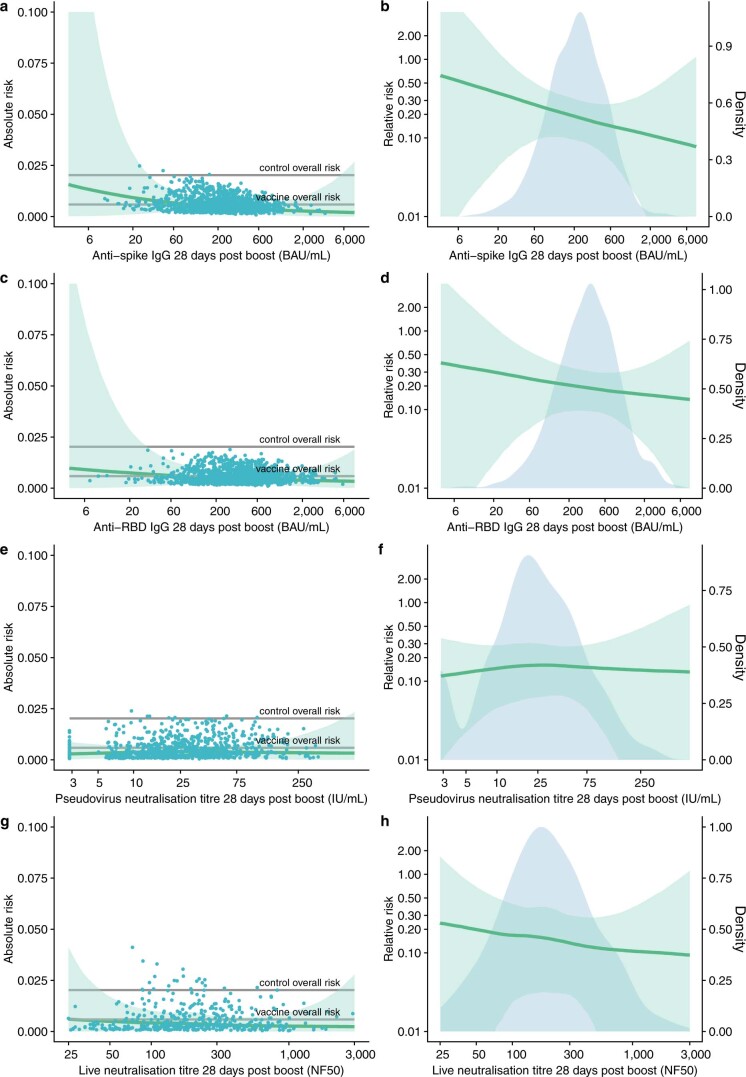
- No significant associations were found between any assay and protection against asymptomatic infection, including in sensitivity analysis restricting to high viral load (all P > 0.05).
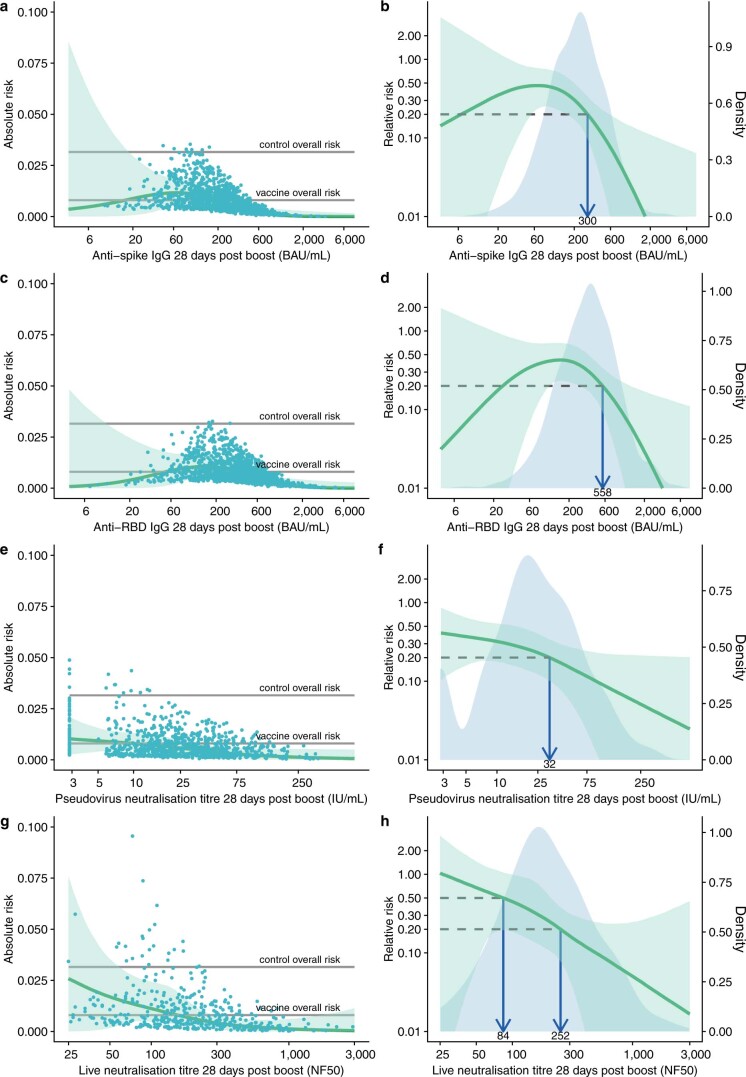
- For symptomatic cases with shortness of breath, 80% VE was achieved at lower immune marker levels than for symptomatic cases in general; no significant associations were observed for symptomatic cases without shortness of breath (all P > 0.05).
Methods
- Data came from COV002, a phase 2/3 randomized single-blind vaccine efficacy trial across 19 UK sites; participants were randomized to ChAdOx1 nCoV-19 or MenACWY control. The correlates population included baseline SARS-CoV-2 N-protein-seronegative participants with a PB28 visit within 14–42 days after the second dose and follow-up to at least 7 days after PB28; the correlates cohort comprised those with biomarker data.
- Immune markers measured at PB28 were anti-spike IgG, anti-RBD IgG, pseudovirus neutralization, and live-virus neutralization, converted to WHO international standard units. Outcomes were primary symptomatic COVID-19 (NAAT+ with at least one qualifying symptom) and asymptomatic infection (NAAT+ on weekly self-swab with no symptoms).
- Log-transformed immune markers were analyzed with generalized additive models for binary outcomes using cubic spline smooths, adjusted for baseline exposure risk and weighted by inverse probability weights for sample availability. Correlates of VE were derived by comparing predicted absolute risk with the MenACWY control population risk; 95% CIs used 10,000 bootstrap samples.
Limitations
- Stated: analyses were based on a mainly white UK population with cases mostly due to B.1.177 and B.1.1.7 variants, so modeled relationships may not apply where other variants dominate or different neutralization strains are used. Many analyses were conducted and P values are unadjusted for multiple comparisons. Results apply to two doses of ChAdOx1 nCoV-19 and may not apply to a single dose or other COVID-19 vaccines. Age profile was not explored due to few older adults; T cells and humoral–cellular interactions were not evaluated; mechanistic versus nonmechanistic correlates could not be determined. No vaccinated participants were hospitalized, so correlates against severe disease or hospitalization could not be assessed. Wide CIs around estimates should be noted, and no single threshold indicated sterilizing immunity.
- Evident from the text: the correlates relate to protection against mild disease, defined as NAAT+ with at least one symptom, during the subsequent 4- to 6-month period, and represent antibody levels at 28 days after a second dose rather than at the time of exposure.
Model-written summary. Check it against the paper before relying on it.
Integrity signals
Registry
Cites
Statistics
Figures
Verification
Claims the paper makes
29 Own result · 18 Own method · 7 Own interpretation · 5 Not checked yet · 3 No basis given · 1 Partly supported · accuracy not yet measured
A result the paper reports from its own data — it cites no other source for it, so there is none to check. The quote shows it is in the paper.
In the paper
“The risk of symptomatic COVID-19 decreased with increasing levels of anti-spike IgG (P = 0.003), anti-RBD IgG (P = 0.018), pseudovirus neutralization titer (P = 0.005), and live-virus neutralization titer (P < 0.001)”
§ Correlates of protection > Results
plaincorrelational- Asserted: passes — The authors put it forward as true.
- Checkable: passes — It can be checked against evidence.
- Load-bearing: passes — The paper’s conclusions depend on it.
- Based: passes — The paper gives a reason why it holds.
A result the paper reports from its own data — it cites no other source for it, so there is none to check. The quote shows it is in the paper.
In the paper
“The risk of symptomatic COVID-19 decreased with increasing levels of anti-spike IgG (P = 0.003)”
§ Correlates of protection > Results
plaincorrelational- Asserted: passes — The authors put it forward as true.
- Checkable: passes — It can be checked against evidence.
- Load-bearing: passes — The paper’s conclusions depend on it.
- Based: passes — The paper gives a reason why it holds.
A result the paper reports from its own data — it cites no other source for it, so there is none to check. The quote shows it is in the paper.
In the paper
“The risk of symptomatic COVID-19 decreased with increasing levels of anti-spike IgG (P = 0.003), anti-RBD IgG (P = 0.018), pseudovirus neutralization titer (P = 0.005), and live-virus neutralization titer (P < 0.001)”
§ Correlates of protection > Results
plaincorrelational- Asserted: passes — The authors put it forward as true.
- Checkable: passes — It can be checked against evidence.
- Load-bearing: passes — The paper’s conclusions depend on it.
- Based: passes — The paper gives a reason why it holds.
A result the paper reports from its own data — it cites no other source for it, so there is none to check. The quote shows it is in the paper.
In the paper
“The risk of symptomatic COVID-19 decreased with increasing levels of anti-spike IgG (P = 0.003), anti-RBD IgG (P = 0.018), pseudovirus neutralization titer (P = 0.005), and live-virus neutralization titer (P < 0.001)”
§ Correlates of protection > Results
plaincorrelational- Asserted: passes — The authors put it forward as true.
- Checkable: passes — It can be checked against evidence.
- Load-bearing: passes — The paper’s conclusions depend on it.
- Based: passes — The paper gives a reason why it holds.
The paper states this without a source or data behind it here, so there is nothing to check it against. The quote shows it is in the paper.
In the paper
“Not all participants with results from the pseudovirus neutralization titer also have results from the anti-spike, anti-RBD, and live neutralizing antibody titers.”
§ Correlates of protection > Imputation of censored antibody values.
plain- Asserted: passes — The authors put it forward as true.
- Checkable: passes — It can be checked against evidence.
- Load-bearing: unclear — It is unclear whether the paper’s conclusions depend on it.
- Based: passes — The paper gives a reason why it holds.
A result the paper reports from its own data — it cites no other source for it, so there is none to check. The quote shows it is in the paper.
In the paper
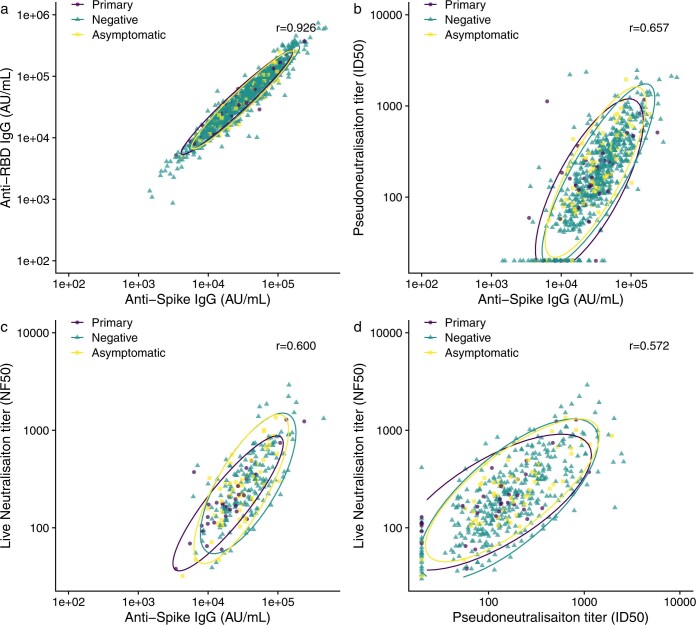
“Non-normalized live-virus neutralization titers (ND 50 ) were less highly correlated with anti-spike IgG (r = 0.411) and pseudovirus neutralization titers (r = 0.305).”
§ Correlates of protection > Results
plaincorrelational- Asserted: passes — The authors put it forward as true.
- Checkable: passes — It can be checked against evidence.
- Load-bearing: unclear — It is unclear whether the paper’s conclusions depend on it.
- Based: passes — The paper gives a reason why it holds.
A result the paper reports from its own data — it cites no other source for it, so there is none to check. The quote shows it is in the paper.
In the paper
“For anti-RBD IgG, 80% efficacy was achieved with median antibody level of 506 (95% CI: 135, not computed (NC)) BAU/ml”
§ Correlates of protection > Results
plaincorrelational- Asserted: passes — The authors put it forward as true.
- Checkable: passes — It can be checked against evidence.
- Load-bearing: passes — The paper’s conclusions depend on it.
- Based: passes — The paper gives a reason why it holds.
A result the paper reports from its own data — it cites no other source for it, so there is none to check. The quote shows it is in the paper.
In the paper
“For pseudovirus and live-virus neutralizing antibody titers, values of 26 (95% CI: NC, NC) IU/ml and 247 (95% CI: 101, NC) normalized neutralization titers (NF 50 ), respectively, were associated with 80% VE against symptomatic infection”
§ Correlates of protection > Results
plaincorrelational- Asserted: passes — The authors put it forward as true.
- Checkable: passes — It can be checked against evidence.
- Load-bearing: passes — The paper’s conclusions depend on it.
- Based: passes — The paper gives a reason why it holds.
A result the paper reports from its own data — it cites no other source for it, so there is none to check. The quote shows it is in the paper.
In the paper
“No values from these assays were associated with protection against asymptomatic infection (Supplementary Table 4)”
§ Correlates of protection > Results
plain- Asserted: passes — The authors put it forward as true.
- Checkable: passes — It can be checked against evidence.
- Load-bearing: passes — The paper’s conclusions depend on it.
- Based: passes — The paper gives a reason why it holds.
A result the paper reports from its own data — it cites no other source for it, so there is none to check. The quote shows it is in the paper.
In the paper
“the results presented here show that there is no single threshold value for any of the assays investigated that was indicative of sterilizing immunity in our data.”
§ Correlates of protection > Discussion
plain- Asserted: passes — The authors put it forward as true.
- Checkable: passes — It can be checked against evidence.
- Load-bearing: passes — The paper’s conclusions depend on it.
- Based: passes — The paper gives a reason why it holds.
- Probably not a substantial claim. 23
- It may state two separate claims as one. 10
The cited sources support only part of this claim — read each source’s verdict below.
In the paper
“When a bootstrap is required for missing data, Brand et al. found single imputation embedded inside a bootstrap showed better statistical properties than other methods 43 .”
§ Correlates of protection > Imputation of censored antibody values.
What the sources say
- Partly supportedcites [43] Brand, J., van Buuren, S., le Cessie, S. & van den Hout, W. Combining multiple imputation and bootstrap in the analysis of cost‐effectiveness trial data. Stat. Med. 38, 210–220 (2019). sourceExperimental — accuracy not yet measured
The Conclusion (§5) says single imputation embedded in the bootstrap percentile method had the best statistical properties, provided noise was added to reflect imputation uncertainty. The claim omits those conditions: the Discussion (§4) reports that single imputation embedded in the bootstrap-t method produced intervals that were too narrow and had considerable undercoverage. (LLM, conf=0.88)
plaincorrelational- Asserted: passes — The authors put it forward as true.
- Checkable: passes — It can be checked against evidence.
- Load-bearing: fails — The paper’s conclusions may not depend on it.
- Based: passes — The paper gives a reason why it holds.
Probably not a substantial claim. The paper’s conclusions may not depend on it.
- Partly supported
A result the paper reports from its own data — it cites no other source for it, so there is none to check. The quote shows it is in the paper.
In the paper
“In our baseline exposure model developed among the MenACWY control group, younger age and being a healthcare worker facing more than one patient with COVID-19 per day were associated with a higher risk of being NAAT+.”
§ Correlates of protection > Results
plaincorrelational- Asserted: passes — The authors put it forward as true.
- Checkable: passes — It can be checked against evidence.
- Load-bearing: unclear — It is unclear whether the paper’s conclusions depend on it.
- Based: passes — The paper gives a reason why it holds.
It may state two separate claims as one.
A result the paper reports from its own data — it cites no other source for it, so there is none to check. The quote shows it is in the paper.
In the paper
“VE against primary symptomatic COVID-19 as a function of immune markers measured at PB28.”
§ Correlates of protection > Reporting Summary.
plaincorrelationaln = 52- Asserted: passes — The authors put it forward as true.
- Checkable: passes — It can be checked against evidence.
- Load-bearing: passes — The paper’s conclusions depend on it.
- Based: passes — The paper gives a reason why it holds.
Probably not a substantial claim.
A result the paper reports from its own data — it cites no other source for it, so there is none to check. The quote shows it is in the paper.
In the paper
“Predicted absolute risk of primary symptomatic COVID-19 as a function of immune markers measured at PB28 by generalized additive regression.”
§ Correlates of protection > Reporting Summary.
plaincorrelationaln = 52- Asserted: passes — The authors put it forward as true.
- Checkable: passes — It can be checked against evidence.
- Load-bearing: passes — The paper’s conclusions depend on it.
- Based: passes — The paper gives a reason why it holds.
Probably not a substantial claim.
A result the paper reports from its own data — it cites no other source for it, so there is none to check. The quote shows it is in the paper.
In the paper
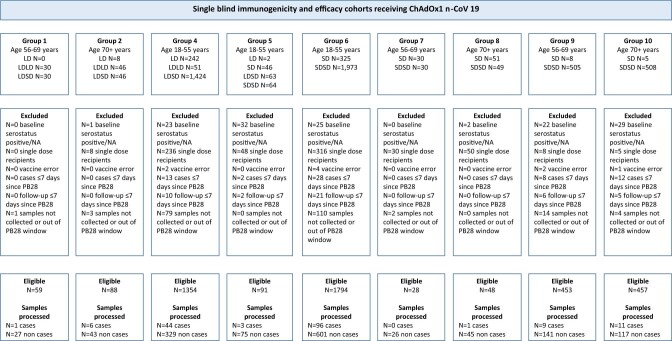
“Data were available for at least one of four assay readouts (anti-spike IgG, anti-receptor binding domain (RBD) IgG, pseudovirus neutralization assay, and live-virus neutralization) for 171 out of 174 (98.3%) cases and 1,404 out of 4,195 (33.5%) noncases.”
§ Correlates of protection > Results
plain- Asserted: passes — The authors put it forward as true.
- Checkable: passes — It can be checked against evidence.
- Load-bearing: passes — The paper’s conclusions depend on it.
- Based: passes — The paper gives a reason why it holds.
Probably not a substantial claim.
A result the paper reports from its own data — it cites no other source for it, so there is none to check. The quote shows it is in the paper.
In the paper
“People in the case group were younger, with 84.2% being aged 18-55 years, compared with 71.6% of the noncase group”
§ Correlates of protection > Results
plaincorrelational- Asserted: passes — The authors put it forward as true.
- Checkable: passes — It can be checked against evidence.
- Load-bearing: fails — The paper’s conclusions may not depend on it.
- Based: passes — The paper gives a reason why it holds.
Probably not a substantial claim. The paper’s conclusions may not depend on it.
A result the paper reports from its own data — it cites no other source for it, so there is none to check. The quote shows it is in the paper.
In the paper
“and were more likely to be healthcare workers (62.0% were healthcare workers compared with 57.5% of the noncase group, Table 1).”
§ Correlates of protection > Results
plaincorrelational- Asserted: passes — The authors put it forward as true.
- Checkable: passes — It can be checked against evidence.
- Load-bearing: fails — The paper’s conclusions may not depend on it.
- Based: passes — The paper gives a reason why it holds.
Probably not a substantial claim. The paper’s conclusions may not depend on it.
A result the paper reports from its own data — it cites no other source for it, so there is none to check. The quote shows it is in the paper.
In the paper
“Relative risk of primary symptomatic COVID-19 among vaccine recipients compared with MenACWY control arm participants as a function of immune markers measured at PB28.”
§ Correlates of protection > Reporting Summary.
plaincorrelationaln = 52- Asserted: passes — The authors put it forward as true.
- Checkable: passes — It can be checked against evidence.
- Load-bearing: passes — The paper’s conclusions depend on it.
- Based: passes — The paper gives a reason why it holds.
Probably not a substantial claim.
A result the paper reports from its own data — it cites no other source for it, so there is none to check. The quote shows it is in the paper.
In the paper
“Relative risk of asymptomatic SARS-CoV-2 infection among vaccine recipients compared with the MenACWY control arm participants as a function of immune markers measured at PB28.”
§ Correlates of protection > Reporting Summary.
plaincorrelationaln = 91- Asserted: passes — The authors put it forward as true.
- Checkable: passes — It can be checked against evidence.
- Load-bearing: passes — The paper’s conclusions depend on it.
- Based: passes — The paper gives a reason why it holds.
Probably not a substantial claim.
What the paper did — it cites no source for this, so there is none to check. The quote shows it is in the paper.
In the paper
“To account for potential of misclassification in asymptomatic infections, a sensitivity analysis was conducted excluding cases with lower viral loads (defined as those for whom all returned PCR positive tests had a CT value ≥ 30), as these are potential false positives.”
§ Correlates of protection > Sensitivity analyses. Viral load.
plain- Asserted: passes — The authors put it forward as true.
- Checkable: passes — It can be checked against evidence.
- Load-bearing: fails — The paper’s conclusions may not depend on it.
- Based: passes — The paper gives a reason why it holds.
Probably not a substantial claim. The paper’s conclusions may not depend on it.
A conclusion the paper draws from its own results — it cites no other source for it, so there is none to check. The quote shows it is in the paper.
In the paper
“These observations indicate that the reduced neutralizing capacity against B.1.351and other variants of concern, might drive reduced protection against initial infection, and perhaps transmission, but protection against severe disease is maintained.”
§ Correlates of protection > Discussion
hedgedconditional- Asserted: passes — The authors put it forward as true.
- Checkable: passes — It can be checked against evidence.
- Load-bearing: passes — The paper’s conclusions depend on it.
- Based: passes — The paper gives a reason why it holds.
It may state two separate claims as one.
What the paper did — it cites no source for this, so there is none to check. The quote shows it is in the paper.
In the paper
“Sensitivity analysis showing absolute and relative risk primary symptomatic SARS-CoV-2 infection with 3 or more COVID-19 symptoms as a function of immune markers measured at day 28 post-second dose.”
§ Correlates of protection > Reporting Summary.
plaincorrelationaln = 32- Asserted: passes — The authors put it forward as true.
- Checkable: passes — It can be checked against evidence.
- Load-bearing: passes — The paper’s conclusions depend on it.
- Based: passes — The paper gives a reason why it holds.
Probably not a substantial claim.
What the paper did — it cites no source for this, so there is none to check. The quote shows it is in the paper.
In the paper
“We performed a sensitivity analysis to account for the potential bias caused by imputing LLOQ / 2.”
§ Correlates of protection > Imputation of censored antibody values.
plain- Asserted: passes — The authors put it forward as true.
- Checkable: passes — It can be checked against evidence.
- Load-bearing: fails — The paper’s conclusions may not depend on it.
- Based: passes — The paper gives a reason why it holds.
Probably not a substantial claim. The paper’s conclusions may not depend on it.
What the paper did — it cites no source for this, so there is none to check. The quote shows it is in the paper.
In the paper
“Correlates may also vary according to age profile, but this was not explored in our study due to the small number of older adults recruited.”
§ Correlates of protection > Discussion
hedgedconditional- Asserted: passes — The authors put it forward as true.
- Checkable: passes — It can be checked against evidence.
- Load-bearing: fails — The paper’s conclusions may not depend on it.
- Based: passes — The paper gives a reason why it holds.
Probably not a substantial claim. The paper’s conclusions may not depend on it. It may state two separate claims as one.
What the paper did — it cites no source for this, so there is none to check. The quote shows it is in the paper.
In the paper
“Sensitivity analysis showing absolute and relative risk of asymptomatic SARS-CoV-2 infection as a function of immune markers measured at 28 days post second dose excluding cases with low viral load (Ct ≥ 30).”
§ Correlates of protection > Reporting Summary.
plaincorrelational- Asserted: passes — The authors put it forward as true.
- Checkable: passes — It can be checked against evidence.
- Load-bearing: fails — The paper’s conclusions may not depend on it.
- Based: passes — The paper gives a reason why it holds.
Probably not a substantial claim. The paper’s conclusions may not depend on it.
What the paper did — it cites no source for this, so there is none to check. The quote shows it is in the paper.
In the paper
“Sensitivity analysis showing absolute and relative risk of primary symptomatic SARS-CoV-2 infection in participants with no symptoms of shortness of breath as a function of immune markers measured at day 28 post-second dose.”
§ Correlates of protection > Reporting Summary.
plaincorrelationaln = 24- Asserted: passes — The authors put it forward as true.
- Checkable: passes — It can be checked against evidence.
- Load-bearing: fails — The paper’s conclusions may not depend on it.
- Based: passes — The paper gives a reason why it holds.
Probably not a substantial claim. The paper’s conclusions may not depend on it.
What the paper did — it cites no source for this, so there is none to check. The quote shows it is in the paper.
In the paper
“Sensitivity analysis showing absolute and relative risk of primary symptomatic SARS-CoV-2 infection in participants with symptoms of shortness of breath as a function of immune markers measured at day 28 post-second dose.”
§ Correlates of protection > Reporting Summary.
plaincorrelationaln = 28- Asserted: passes — The authors put it forward as true.
- Checkable: passes — It can be checked against evidence.
- Load-bearing: fails — The paper’s conclusions may not depend on it.
- Based: passes — The paper gives a reason why it holds.
Probably not a substantial claim. The paper’s conclusions may not depend on it.
A conclusion the paper draws from its own results — it cites no other source for it, so there is none to check. The quote shows it is in the paper.
In the paper
“A trial of a new vaccine that works through similar immune mechanisms and which produces antibody responses that are above the correlate values reported here in at least 50% of participants (that is, it has a similar or higher median), might be expected to have similar efficacy against the clinical endpoints used in our UK trial, and higher efficacy against more severe endpoints.”
§ Correlates of protection > Discussion
hedgedconditional- Asserted: passes — The authors put it forward as true.
- Checkable: passes — It can be checked against evidence.
- Load-bearing: passes — The paper’s conclusions depend on it.
- Based: passes — The paper gives a reason why it holds.
It may state two separate claims as one.
- Rests on an assumption: No study to date has defined a correlate of protection against SARS-CoV-2 infection or disease that can be used by regulators and vaccine developers.
A conclusion the paper draws from its own results — it cites no other source for it, so there is none to check. The quote shows it is in the paper.
In the paper
“Instead, the probability of infection decreases on average with higher immune responses, but substantial variation exists between individuals.”
§ Correlates of protection > Discussion
plaincorrelational- Asserted: passes — The authors put it forward as true.
- Checkable: passes — It can be checked against evidence.
- Load-bearing: passes — The paper’s conclusions depend on it.
- Based: passes — The paper gives a reason why it holds.
It may state two separate claims as one.
What the paper did — it cites no source for this, so there is none to check. The quote shows it is in the paper.
In the paper
“We then estimated the CoR by GAM, adjusting for the baseline risk exposure and weighting by inverse probability weights.”
§ Correlates of protection > Bootstrap.
hedged- Asserted: passes — The authors put it forward as true.
- Checkable: passes — It can be checked against evidence.
- Load-bearing: passes — The paper’s conclusions depend on it.
- Based: passes — The paper gives a reason why it holds.
Probably not a substantial claim.
In the paper
“Similarly, ChAdOx1 nCoV-19-vaccinated hamsters, with low neutralizing titers against B.1.351,were fully protected against LRTI following challenge with B.1.351,despite no evidence of protection against shedding of virus from the upper airway 29 .”
§ Correlates of protection > Discussion
What the sources say
- Not checked yetcites [29] Fischer, R. J., et al. ChAdOx1 nCoV-19 (AZD1222) protects hamsters against SARS-CoV-2 B.1.351 and B.1.1.7 disease. Nature Comm. (in the press).
plain- Asserted: passes — The authors put it forward as true.
- Checkable: passes — It can be checked against evidence.
- Load-bearing: passes — The paper’s conclusions depend on it.
- Based: passes — The paper gives a reason why it holds.
It may state two separate claims as one.
What the paper did — it cites no source for this, so there is none to check. The quote shows it is in the paper.
In the paper
“The logit-transformed predicted baseline exposure risk was included as a linear covariate in the GAM model.”
§ Correlates of protection > Correlates or risk.
plain- Asserted: passes — The authors put it forward as true.
- Checkable: passes — It can be checked against evidence.
- Load-bearing: fails — The paper’s conclusions may not depend on it.
- Based: passes — The paper gives a reason why it holds.
Probably not a substantial claim. The paper’s conclusions may not depend on it.
- Rests on an assumption: Baseline exposure risk predicted from the MenACWY control population is applicable to the ChAdOx1 nCoV-19 correlates cohort.
In the paper
“Protection against upper respiratory tract or asymptomatic infections may be more closely associated with the presence of secretory IgA on the mucosal surface which was not measured in this study 30 .”
§ Correlates of protection > Discussion
What the sources say
- Not checked yetcites [30] Wang, Z. et al. Enhanced SARS-CoV-2 neutralization by dimeric IgA. Sci. Transl. Med. 13, eabf1555 (2021). source
hedgedcorrelational- Asserted: passes — The authors put it forward as true.
- Checkable: passes — It can be checked against evidence.
- Load-bearing: unclear — It is unclear whether the paper’s conclusions depend on it.
- Based: passes — The paper gives a reason why it holds.
It may state two separate claims as one.
What the paper did — it cites no source for this, so there is none to check. The quote shows it is in the paper.
In the paper
“Samples were tested blinded to case status.”
§ Correlates of protection > Immune markers and time points.
plain- Asserted: passes — The authors put it forward as true.
- Checkable: passes — It can be checked against evidence.
- Load-bearing: passes — The paper’s conclusions depend on it.
- Based: passes — The paper gives a reason why it holds.
Probably not a substantial claim.
In the paper
“It has previously been shown that protection against lower respiratory tract infection (LRTI) may be easier to achieve than against upper respiratory tract infection (URTI), as challenge studies in rhesus macaques have shown stronger correlation between neutralizing titers and the level of subgenomic messenger RNA in bronchoalveolar lavage samples than in nasal swab samples 28 .”
§ Correlates of protection > Discussion
What the sources say
- Not checked yetcites [28] van Doremalen, N. et al. ChAdOx1 nCoV-19 vaccine prevents SARS-CoV-2 pneumonia in rhesus macaques. Nature 586, 578–582 (2020). source
hedgedconditional- Asserted: passes — The authors put it forward as true.
- Checkable: passes — It can be checked against evidence.
- Load-bearing: fails — The paper’s conclusions may not depend on it.
- Based: passes — The paper gives a reason why it holds.
Probably not a substantial claim. The paper’s conclusions may not depend on it.
What the paper did — it cites no source for this, so there is none to check. The quote shows it is in the paper.
In the paper
“These analyses are based on cases of COVID-19 detected in a mainly white population in the United Kingdom, which were mostly due to B.1.177and B.1.1.7 variants.”
§ Correlates of protection > Discussion
plain- Asserted: passes — The authors put it forward as true.
- Checkable: passes — It can be checked against evidence.
- Load-bearing: passes — The paper’s conclusions depend on it.
- Based: passes — The paper gives a reason why it holds.
It may state two separate claims as one.
What the paper did — it cites no source for this, so there is none to check. The quote shows it is in the paper.
In the paper
“The data included in this analysis comes from participants enrolled in COV002 (registration NCT04400838), a phase 2/3 randomized single-blind vaccine efficacy trial conducted across 19 sites in the United Kingdom.”
§ Correlates of protection > Study description.
plain- Asserted: passes — The authors put it forward as true.
- Checkable: passes — It can be checked against evidence.
- Load-bearing: passes — The paper’s conclusions depend on it.
- Based: passes — The paper gives a reason why it holds.
Probably not a substantial claim. It may state two separate claims as one.
What the paper did — it cites no source for this, so there is none to check. The quote shows it is in the paper.
In the paper
“For each bootstrap sample, we calculated the inverse probability weights to account for sampling bias.”
§ Correlates of protection > Bootstrap.
plain- Asserted: passes — The authors put it forward as true.
- Checkable: passes — It can be checked against evidence.
- Load-bearing: passes — The paper’s conclusions depend on it.
- Based: passes — The paper gives a reason why it holds.
Probably not a substantial claim.
What the paper did — it cites no source for this, so there is none to check. The quote shows it is in the paper.
In the paper
“All endpoints were evaluated by a blinded independent clinical review committee.”
§ Correlates of protection > Study description.
plain- Asserted: passes — The authors put it forward as true.
- Checkable: passes — It can be checked against evidence.
- Load-bearing: fails — The paper’s conclusions may not depend on it.
- Based: passes — The paper gives a reason why it holds.
Probably not a substantial claim. The paper’s conclusions may not depend on it.
A conclusion the paper draws from its own results — it cites no other source for it, so there is none to check. The quote shows it is in the paper.
In the paper
“These data can be used to extrapolate efficacy estimates for new vaccines that use similar immune mechanisms and where efficacy data is unavailable.”
§ Correlates of protection > Discussion
plaincorrelational- Asserted: passes — The authors put it forward as true.
- Checkable: fails — It may be too vague to check against evidence.
- Load-bearing: passes — The paper’s conclusions depend on it.
- Based: passes — The paper gives a reason why it holds.
Probably not a substantial claim. It may be too vague to check against evidence.
- Rests on an assumption: No study to date has defined a correlate of protection against SARS-CoV-2 infection or disease that can be used by regulators and vaccine developers.
What the paper did — it cites no source for this, so there is none to check. The quote shows it is in the paper.
In the paper
“Furthermore, these analyses have been conducted on samples taken after two doses of ChAdOx1 nCoV-19 and might not apply to protection afforded by a single dose of the same vaccine or other COVID-19 vaccines.”
§ Correlates of protection > Discussion
hedged- Asserted: passes — The authors put it forward as true.
- Checkable: passes — It can be checked against evidence.
- Load-bearing: unclear — It is unclear whether the paper’s conclusions depend on it.
- Based: passes — The paper gives a reason why it holds.
It may state two separate claims as one.
The authors state this as an assumption.
The mechanism of missingness for samples that were not tested is missing at random.
“We assume the mechanism of missingness for samples that were not tested to be missing at random 39 .”
The paper relies on this without support.
No study to date has defined a correlate of protection against SARS-CoV-2 infection or disease that can be used by regulators and vaccine developers.
“Nevertheless, no study to date has defined a correlate of protection against SARS-CoV-2 infection or disease that can be used by regulators and vaccine developers.”
The paper relies on this without support.
Baseline exposure risk predicted from the MenACWY control population is applicable to the ChAdOx1 nCoV-19 correlates cohort.
“The linear predictor from the risk model developed using the MenACWY control population was used to predict the baseline risk of exposure in the ChAdOx1 nCoV-19 correlates cohort.”
The authors state this as an assumption.
The confidence ellipses for correlations assume a t-distribution.
“95% confidence ellipses assuming a t-distribution are shown for each outcome (primary symptomatic cases, asymptomatic cases and negative controls).”
Claims other papers make about this one
Each is checked against this paper’s own text: does it say what the citing paper says it does?
In the citing paper
“Neutralizing antibody responses are also believed to be critical for protection against COVID-19 by BNT vaccination”
From The Omicron variant is highly resistant against antibody-mediated neutralization: Implications for control of the COVID-19 pandemic (2022) · cites this paper as Feng et al., 2021
Citations
Cites
Safety and Efficacy of the BNT162b2 mRNA Covid-19 Vaccine
Polack, F. P., Thomas, S. J., Kitchin, N., Absalon, J., Gurtman, A., Lockhart, S., Perez, J. L., Pérez Marc, G., Moreira, E. D., Zerbini, C., et al. (2020) · New England Journal of Medicine · doi:10.1056/nejmoa2034577 · Cited by 14,592
Wood, S. N. (2010) · Journal of the Royal Statistical Society Series B (Statistical Methodology) · doi:10.1111/j.1467-9868.2010.00749.x · Cited by 7,538
Sterne, J. A. C., White, I. R., Carlin, J. B., Spratt, M., Royston, P., Kenward, M. G., Wood, A. M., & Carpenter, J. R. (2009) · BMJ · doi:10.1136/bmj.b2393 · Cited by 7,299
Voysey, M., Clemens, S. A. C., Madhi, S. A., Weckx, L. Y., Folegatti, P. M., Aley, P. K., Angus, B., Baillie, V. L., Barnabas, S. L., Bhorat, Q. E., et al. (2021) · The Lancet · doi:10.1016/s0140-6736(20)32661-1 · Cited by 4,616
Self-citationKhoury, D. S., Cromer, D., Reynaldi, A., Schlub, T. E., Wheatley, A. K., Juno, J. A., Subbarao, K., Kent, S. J., Triccas, J. A., & Davenport, M. P. (2021) · Nature Medicine · doi:10.1038/s41591-021-01377-8 · Cited by 3,742
Folegatti, P. M., Ewer, K. J., Aley, P. K., Angus, B., Becker, S., Belij-Rammerstorfer, S., Bellamy, D., Bibi, S., Bittaye, M., Clutterbuck, E. A., et al. (2020) · The Lancet · doi:10.1016/s0140-6736(20)31604-4 · Cited by 2,419
Self-citationMulligan, M. J., Lyke, K. E., Kitchin, N., Absalon, J., Gurtman, A., Lockhart, S., Neuzil, K., Raabe, V., Bailey, R., Swanson, K. A., et al. (2020) · doi:10.1101/2020.06.30.20142570 · Cited by 1,569
Haas, E. J., Angulo, F. J., McLaughlin, J. M., Anis, E., Singer, S. R., Khan, F., Brooks, N., Smaja, M., Mircus, G., Pan, K., et al. (2021) · The Lancet · doi:10.1016/s0140-6736(21)00947-8 · Cited by 1,564
Lopez Bernal, J., Andrews, N., Gower, C., Robertson, C., Stowe, J., Tessier, E., Simmons, R., Cottrell, S., Roberts, R., O’Doherty, M., et al. (2021) · BMJ · doi:10.1136/bmj.n1088 · Cited by 1,389
Ramasamy, M. N., Minassian, A. M., Ewer, K. J., Flaxman, A. L., Folegatti, P. M., Owens, D. R., Voysey, M., Aley, P. K., Angus, B., Babbage, G., et al. (2020) · The Lancet · doi:10.1016/s0140-6736(20)32466-1 · Cited by 1,324
Self-citation
Research works printed but not linked: 2
- Kemp, A. AZD1222 US Phase III trial met primary efficacy endpoint in preventing COVID-19 at interim analysis. https://www.astrazeneca.com/media-centre/press-releases/2021/astrazeneca-us-vaccine-trial-met-primary-endpoint.html (2021).
- Box, G. E. & Tiao, G. C. Bayesian Inference in Statistical Analysis (John Wiley & Sons, 2011).
Cited by
Sorted by citations
SARS-CoV-2 variant biology: immune escape, transmission and fitness
Carabelli, A. M., Peacock, T. P., Thorne, L., Harvey, W. T., Hughes, J., de Silva, T. I., Peacock, S. J., Barclay, W., de Silva, T. I., Towers, G. J., et al. (2023) · Nature Reviews Microbiology · doi:10.1038/s41579-022-00841-7 · Cited by 1,386
Immune correlates analysis of the mRNA-1273 COVID-19 vaccine efficacy clinical trial
Gilbert, P. B., Montefiori, D. C., McDermott, A. B., Fong, Y., Benkeser, D., Deng, W., Zhou, H., Houchens, C. R., Martins, K., Jayashankar, L., et al. (2022) · Science · doi:10.1126/science.abm3425 · Cited by 1,137
Tregoning, J. S., Flight, K. E., Higham, S. L., Wang, Z., & Pierce, B. F. (2021) · Nature reviews. Immunology · doi:10.1038/s41577-021-00592-1 · Cited by 1,146
Hoffmann, M., Krüger, N., Schulz, S., Cossmann, A., Rocha, C., Kempf, A., Nehlmeier, I., Graichen, L., Moldenhauer, A.-S., Winkler, M. S., et al. (2022) · Cell · doi:10.1016/j.cell.2021.12.032 · Cited by 889
Duration of Protection against Mild and Severe Disease by Covid-19 Vaccines
Andrews, N., Tessier, E., Stowe, J., Gower, C., Kirsebom, F., Simmons, R., Gallagher, E., Thelwall, S., Groves, N., Dabrera, G., et al. (2022) · New England Journal of Medicine · doi:10.1056/nejmoa2115481 · Cited by 807
Age-related immune response heterogeneity to SARS-CoV-2 vaccine BNT162b2
Collier, D. A., Ferreira, I. A. T. M., Kotagiri, P., Datir, R. P., Lim, E. Y., Touizer, E., Meng, B., Abdullahi, A., The CITIID-NIHR BioResource COVID-19 Collaboration, Principal Investigators, et al. (2021) · Nature · doi:10.1038/s41586-021-03739-1 · Cited by 751
Munro, A. P. S., Janani, L., Cornelius, V. R., Aley, P. K., Babbage, G., Baxter, D. N., Bula, M., Cathie, K., Chatterjee, K., Dodd, K., et al. (2021) · The Lancet · doi:10.1016/s0140-6736(21)02717-3 · Cited by 656
Self-citationHomologous and Heterologous Covid-19 Booster Vaccinations
Atmar, R. L., Lyke, K. E., Deming, M. E., Jackson, L. A., Branche, A. R., Sahly, H. M. E., Rostad, C. A., Martin, J. M., Johnston, C., Rupp, R. E., et al. (2022) · New England Journal of Medicine · doi:10.1056/nejmoa2116414 · Cited by 646
Cromer, D., Steain, M., Reynaldi, A., Schlub, T. E., Wheatley, A. K., Juno, J. A., Kent, S. J., Triccas, J. A., Khoury, D. S., & Davenport, M. P. (2022) · The Lancet Microbe · doi:10.1016/s2666-5247(21)00267-6 · Cited by 590
Liu, X., Shaw, R. H., Stuart, A. S. V., Greenland, M., Aley, P. K., Andrews, N. J., Cameron, J. C., Charlton, S., Clutterbuck, E., Collins, A. M., et al. (2021) · The Lancet · doi:10.1016/s0140-6736(21)01694-9 · Cited by 480
Self-citationRöltgen, K., Nielsen, S. C. A., Silva, O., Younes, S. F., Zaslavsky, M., Costales, C., Yang, F., Wirz, O. F., Solis, D., Hoh, R. A., et al. (2022) · Cell · doi:10.1016/j.cell.2022.01.018 · Cited by 475
Clemens, S. A. C., Weckx, L. Y., Clemens, R. L., Mendes, A. V. A., Souza, A. R., Silveira, M. B. V., da Guarda, S. N. F., de Nobrega, M. M., Pinto, M. I. D. M., Gonzalez, I. G. S., et al. (2022) · The Lancet · doi:10.1016/s0140-6736(22)00094-0 · Cited by 421
Self-citationEfficacy of a Fourth Dose of Covid-19 mRNA Vaccine against Omicron
Regev‐Yochay, G., Gonen, T., Gilboa, M., Mandelboim, M., Indenbaum, V., Amit, S., Meltzer, L., Asraf, K., Cohen, C., Fluss, R., et al. (2022) · New England Journal of Medicine · doi:10.1056/nejmc2202542 · Cited by 413
Immunogenicity of standard and extended dosing intervals of BNT162b2 mRNA vaccine
Payne, R. P., Longet, S., Austin, J. A., Skelly, D. T., Dejnirattisai, W., Adele, S., Meardon, N., Faustini, S., Al-Taei, S., Moore, S. C., et al. (2021) · Cell · doi:10.1016/j.cell.2021.10.011 · Cited by 322
Self-citationSARS-CoV-2 Variants, Vaccines, and Host Immunity
Mistry, P., Barmania, F., Mellet, J., Peta, K. T., Strydom, A., Viljoen, I. M., James, W., Gordon, S., & Pepper, M. S. (2022) · Frontiers in Immunology · doi:10.3389/fimmu.2021.809244 · Cited by 314
Correlates of protection against SARS ‐ CoV ‐2 infection and COVID‐19 disease
Goldblatt, D., Alter, G., Crotty, S., & Plotkin, S. A. (2022) · Immunological Reviews · doi:10.1111/imr.13091 · Cited by 301
Flaxman, A. L., Marchevsky, N. G., Jenkin, D., Aboagye, J., Aley, P. K., Angus, B., Belij‐Rammerstorfer, S., Bibi, S., Bittaye, M., Cappuccini, F., et al. (2021) · The Lancet · doi:10.1016/s0140-6736(21)01699-8 · Cited by 244
Self-citationWei, J., Pouwels, K. B., Stoesser, N. E., Matthews, P. C., Diamond, I. D., Studley, R., Rourke, E. D., Cook, D., Bell, J. I., Newton, J. N., et al. (2022) · Nature Medicine · doi:10.1038/s41591-022-01721-6 · Cited by 248
A Covid-19 Milestone Attained — A Correlate of Protection for Vaccines
Gilbert, P. B., Donis, R. O., Koup, R. A., Fong, Y., Plotkin, S. A., & Follmann, D. A. (2022) · New England Journal of Medicine · doi:10.1056/nejmp2211314 · Cited by 217
Chi, W.-Y., Li, Y.-D., Huang, H., Chan, T. E. H., Chow, S.-Y., Su, J.-H., Ferrall, L., Hung, C., & Wu, T. ‐. (2022) · Journal of Biomedical Science · doi:10.1186/s12929-022-00853-8 · Cited by 225
Jones, J. M., Stone, M., Sulaeman, H., Fink, R. V., Dave, H., Levy, M. E., Di Germanio, C., Green, V., Notari, E., Saa, P., et al. (2021) · JAMA · doi:10.1001/jama.2021.15161 · Cited by 201
COVID-19 vaccination: The road ahead
Altmann, D. M., & Boyton, R. J. (2022) · Science · doi:10.1126/science.abn1755 · Cited by 198
Jara, A., Undurraga, E. A., Zubizarreta, J. R., González, C., Pizarro, A., Acevedo, J., Leo, K., Paredes, F., Bralic, T., Vergara, V., et al. (2022) · The Lancet Global Health · doi:10.1016/s2214-109x(22)00112-7 · Cited by 199
Imprinted SARS-CoV-2-Specific Memory Lymphocytes Define Hybrid Immunity
Rodda, L. B., Morawski, P. A., Pruner, K. B., Fahning, M. L., Howard, C. A., Franko, N., Logue, J. K., Eggenberger, J., Stokes, C., Golez, I., et al. (2022) · Cell · doi:10.1016/j.cell.2022.03.018 · Cited by 200
The Impact of Evolving SARS-CoV-2 Mutations and Variants on COVID-19 Vaccines
McLean, G. R., Kamil, J. P., Lee, B., Moore, P. L., Schulz, T. F., Muik, A., Şahin, U., Türeci, Ö., & Pather, S. (2022) · mBio · doi:10.1128/mbio.02979-21 · Cited by 195
Sanders, J., Bemelman, F. J., Messchendorp, A. L., Baan, C. C., van Baarle, D., van Binnendijk, R. S., Diavatopoulos, D. A., Frölke, S. C., Geers, D., GeurtsvanKessel, C. H., et al. (2021) · Transplantation · doi:10.1097/tp.0000000000003983 · Cited by 182
A pseudovirus system enables deep mutational scanning of the full SARS-CoV-2 spike
Dadonaite, B., Crawford, K. H. D., Radford, C. E., Farrell, A. G., Yu, T. C., Hannon, W. W., Zhou, P.-P., Andrabi, R., Burton, D. R., Liu, L., et al. (2023) · Cell · doi:10.1016/j.cell.2023.02.001 · Cited by 186
Neutralization, effector function and immune imprinting of Omicron variants
Addetia, A., Piccoli, L., Case, J. B., Park, Y., Beltramello, M., Guarino, B., Dang, H. V., de Melo, G. D., Pinto, D., Sprouse, K. R., et al. (2023) · Nature · doi:10.1038/s41586-023-06487-6 · Cited by 179
Towards a population-based threshold of protection for COVID-19 vaccines
Goldblatt, D., Fiore-Gartland, A. J., Johnson, M., Hunt, A., Bengt, C., Zavadska, D., Snipe, H. D., Brown, J., Workman, L., Zar, H. J., et al. (2021) · Vaccine · doi:10.1016/j.vaccine.2021.12.006 · Cited by 172
Li, J., Wu, S., Guo, X., Tang, R., Huang, B., Chen, X., Chen, Y., Hou, L.-H., Liu, J.-X., Zhong, J., et al. (2022) · The Lancet Respiratory Medicine · doi:10.1016/s2213-2600(22)00087-x · Cited by 166
SARS-CoV-2-specific T cells in infection and vaccination
Bertoletti, A., Le Bert, N., Qui, M., & Tan, A. T. (2021) · Cellular & Molecular Immunology · doi:10.1038/s41423-021-00743-3 · Cited by 159
Tong, H., Cao, C., You, M., Han, S., Liu, Z., Xiao, Y., He, W., Liu, C., Peng, P., Xue, Z., et al. (2022) · Biosensors and Bioelectronics · doi:10.1016/j.bios.2022.114449 · Cited by 151
Khoury, D. S., Schlub, T. E., Cromer, D., Steain, M. C., Fong, Y., Gilbert, P. B., Subbarao, K., Triccas, J. A., Kent, S. J., & Davenport, M. P. (2023) · Emerging infectious diseases · doi:10.3201/eid2902.221422 · Cited by 158
COVID-19 in dialysis: clinical impact, immune response, prevention, and treatment
Karoui, K. E., & Vriese, A. S. D. (2022) · Kidney International · doi:10.1016/j.kint.2022.01.022 · Cited by 150
Antibody-mediated neutralization of SARS-CoV-2
Gruell, H., Vanshylla, K., Weber, T., Barnes, C. O., Kreer, C., & Klein, F. (2022) · Immunity · doi:10.1016/j.immuni.2022.05.005 · Cited by 150
Neutralising antibodies predict protection from severe COVID-19
Cromer, D., Steain, M., Reynaldi, A., Schlub, T. E., Sasson, S. C., Kent, S. J., Khoury, D. S., & Davenport, M. P. (2022) · doi:10.1101/2022.06.09.22275942 · Cited by 139
Kent, S. J., Khoury, D. S., Reynaldi, A., Juno, J. A., Wheatley, A. K., Stadler, E., John Wherry, E., Triccas, J., Sasson, S. C., Cromer, D., et al. (2022) · Nature Reviews Immunology · doi:10.1038/s41577-022-00716-1 · Cited by 139
Yang, Z.-R., Jiang, Y.-W., Li, F.-X., Liu, D., Lin, T.-F., Zhao, Z.-Y., Wei, C., Jin, Q.-Y., Li, X.-M., Jia, Y.-X., et al. (2023) · The Lancet Microbe · doi:10.1016/s2666-5247(22)00390-1 · Cited by 138
Naranbhai, V., García-Beltrán, W. F., Chang, C. C., Berrios, C., Thierauf, J., Kirkpatrick, G., Onozato, M. L., Cheng, J., Denis, K. S., Lam, E. C., et al. (2021) · The Journal of Infectious Diseases · doi:10.1093/infdis/jiab593 · Cited by 137
Ruether, D. F., Schaub, G., Duengelhoef, P. M., Haag, F., Brehm, T. T., Fathi, A., Wehmeyer, M. H., Jahnke-Triankowski, J., Mayer, L., Hoffmann, A., et al. (2021) · Clinical Gastroenterology and Hepatology · doi:10.1016/j.cgh.2021.09.003 · Cited by 133
Kantauskaitė, M., Müller, L., Kolb, T., Fischer, S., Hillebrandt, J., Ivens, K., Andrée, M., Luedde, T., Orth, H.-M., Adams, O., et al. (2021) · American Journal of Transplantation · doi:10.1111/ajt.16851 · Cited by 132
Early non-neutralizing, afucosylated antibody responses are associated with COVID-19 severity
Chakraborty, S., González, J. C., Sievers, B. L., Mallajosyula, V. V. A., Chakraborty, S., Dubey, M., Ashraf, U., Cheng, B. Y.-L., Kathale, N. D., Tran, K. Q. T., et al. (2022) · Science Translational Medicine · doi:10.1126/scitranslmed.abm7853 · Cited by 137
Barnes, E. J., Goodyear, C. S., Willicombe, M. K., Gaskell, C., Siebert, S., de Silva, T. I., Murray, S. M., Rea, D. W., Snowden, J. A., Carroll, M. W., et al. (2023) · Nature Medicine · doi:10.1038/s41591-023-02414-4 · Cited by 132
Self-citationGilboa, M., Regev-Yochay, G., Mandelboim, M., Indenbaum, V., Asraf, K., Fluss, R., Amit, S., Mendelson, E., Doolman, R., Afek, A., et al. (2022) · JAMA Network Open · doi:10.1001/jamanetworkopen.2022.31778 · Cited by 128
Optimization of non-coding regions for a non-modified mRNA COVID-19 vaccine
Gebre, M. S., Rauch, S., Roth, N., Yu, J., Chandrashekar, A., Mercado, N. B., He, X., Liu, J., McMahan, K., Martinot, A., et al. (2022) · Nature · doi:10.1038/s41586-021-04231-6 · Cited by 127
Hsieh, S.-M., Liu, M.-C., Chen, Y.-H., Lee, W.-S., Hwang, S.-J., Cheng, S.-H., Ko, W.-C., Hwang, K.-P., Wang, N.-C., Lee, Y.-L., et al. (2021) · The Lancet Respiratory Medicine · doi:10.1016/s2213-2600(21)00402-1 · Cited by 125
Higdon, M. M., Wahl, B., Jones, C. B., Rosen, J. G., Truelove, S., Baidya, A., Nande, A., ShamaeiZadeh, P. A., Walter, K. K., Feikin, D. R., et al. (2022) · Open Forum Infectious Diseases · doi:10.1093/ofid/ofac138 · Cited by 133
Self-citationCount on us: T cells in SARS-CoV-2 infection and vaccination
Kedzierska, K., & Thomas, P. G. (2022) · Cell Reports Medicine · doi:10.1016/j.xcrm.2022.100562 · Cited by 124
Reindl‐Schwaighofer, R., Heinzel, A., Mayrdorfer, M., Jabbour, R., Hofbauer, T. M., Merrelaar, A. E., Eder, M., Regele, F., Doberer, K., Spechtl, P., et al. (2021) · JAMA Internal Medicine · doi:10.1001/jamainternmed.2021.7372 · Cited by 127
McCann, N. S., O’Connor, D., Lambe, T., & Pollard, A. J. (2022) · Current Opinion in Immunology · doi:10.1016/j.coi.2022.102210 · Cited by 128
Self-citationTzou, P. L., Tao, K., Pond, S. L. K., & Shafer, R. W. (2022) · PLoS ONE · doi:10.1371/journal.pone.0261045 · Cited by 126
COVID-19 vaccination in kidney transplant recipients
Caillard, S., & Thaunat, O. (2021) · Nature Reviews Nephrology · doi:10.1038/s41581-021-00491-7 · Cited by 122
Colwill, K., Galipeau, Y., Stuible, M., Gervais, C., Arnold, C. R., Rathod, B., Abe, K. T., Wang, J. H., Pasculescu, A., Maltseva, M., et al. (2022) · Clinical & Translational Immunology · doi:10.1002/cti2.1380 · Cited by 131
Waning immune responses against SARS-CoV-2 variants of concern among vaccinees in Hong Kong
Peng, Q., Zhou, R., Wang, Y., Zhao, M., Liu, N., Li, S., Huang, H., Yang, D., Au, K., Wang, H., et al. (2022) · EBioMedicine · doi:10.1016/j.ebiom.2022.103904 · Cited by 122
Guo, Y., Han, J., Zhang, Y., He, J., Yu, W., Zhang, X., Wu, J., Zhang, S., Kong, Y., Guo, Y., et al. (2022) · Frontiers in Immunology · doi:10.3389/fimmu.2022.877101 · Cited by 118
Vaccination in patients with kidney failure: lessons from COVID-19
Babel, N., Hugo, C., & Westhoff, T. H. (2022) · Nature Reviews Nephrology · doi:10.1038/s41581-022-00617-5 · Cited by 119
Sievers, B. L., Chakraborty, S., Xue, Y., Gelbart, T., Gonzalez, J. C., Cassidy, A. G., Golan, Y., Prahl, M., Gaw, S. L., Arunachalam, P. S., et al. (2022) · Science Translational Medicine · doi:10.1126/scitranslmed.abn7842 · Cited by 111
Nguyen, Y., Flahault, A., Chavarot, N., Melenotte, C., Cheminant, M., Deschamps, P., Carlier, N., Lafont, E., Thomas, M., Flamarion, E., et al. (2022) · Clinical Microbiology and Infection · doi:10.1016/j.cmi.2022.07.015 · Cited by 107
Brockman, M. A., Mwimanzi, F. M., Lapointe, H. R., Sang, Y., Agafitei, O., Cheung, P. K., Ennis, S., Ng, K., Basra, S., Lim, L. Y., et al. (2021) · The Journal of Infectious Diseases · doi:10.1093/infdis/jiab592 · Cited by 108
The Global Impact of COVID-19 on Solid Organ Transplantation: Two Years Into a Pandemic
Nimmo, A., Gardiner, D. D., Ushiro‐Lumb, I., Ravanan, R., & Forsythe, J. L. R. (2022) · Transplantation · doi:10.1097/tp.0000000000004151 · Cited by 104
van Gils, M. J., Lavell, A. H. A., van der Straten, K., Appelman, B., Bontjer, I., Poniman, M., Burger, J. A., Oomen, M., Bouhuijs, J. H., van Vught, L. A., et al. (2022) · PLoS Medicine · doi:10.1371/journal.pmed.1003991 · Cited by 104
Predicting the efficacy of variant-modified COVID-19 vaccine boosters
Khoury, D. S., Docken, S. S., Subbarao, K., Kent, S. J., Davenport, M. P., & Cromer, D. (2023) · Nature Medicine · doi:10.1038/s41591-023-02228-4 · Cited by 104
Immune correlates analysis of the PREVENT-19 COVID-19 vaccine efficacy clinical trial
Fong, Y., Huang, Y., Benkeser, D. C., Carpp, L. N., Áñez, G., Woo, W., McGarry, A., Dunkle, L. M., Cho, I., Houchens, C. R., et al. (2023) · Nature Communications · doi:10.1038/s41467-022-35768-3 · Cited by 101
Self-citationMucosal vaccines for SARS-CoV-2: triumph of hope over experience
Pilapitiya, D., Wheatley, A. K., & Tan, H. (2023) · EBioMedicine · doi:10.1016/j.ebiom.2023.104585 · Cited by 99
Population immunity predicts evolutionary trajectories of SARS-CoV-2
Meijers, M., Ruchnewitz, D., Eberhardt, J., Łuksza, M., & Lässig, M. (2023) · Cell · doi:10.1016/j.cell.2023.09.022 · Cited by 102
Mentzer, A. J., O’Connor, D., Bibi, S., Chelysheva, I., Clutterbuck, E., Demissie, T. M., Dinesh, T., Edwards, N. J., Felle, S., Feng, S., et al. (2022) · Nature Medicine · doi:10.1038/s41591-022-02078-6 · Cited by 99
Self-citationRETRACTED: SARS-CoV-2 S2–targeted vaccination elicits broadly neutralizing antibodies
Ng, K. W., Faulkner, N., Finsterbusch, K., Wu, M., Harvey, R., Hussain, S., Greco, M., Liu, Y., Kjær, S., Swanton, C., et al. (2022) · Science Translational Medicine · doi:10.1126/scitranslmed.abn3715 · Cited by 100
RetractedTenforde, M. W., Patel, M. M., Gaglani, M., Ginde, A. A., Douin, D. J., Talbot, H. K., Casey, J. D., Mohr, N. M., Zepeski, A. E., McNeal, T., et al. (2022) · MMWR Morbidity and Mortality Weekly Report · doi:10.15585/mmwr.mm7104a2 · Cited by 94
Brumme, Z. L., Mwimanzi, F. M., Lapointe, H. R., Cheung, P. K., Sang, Y., Duncan, M. C., Yaseen, F., Agafitei, O., Ennis, S., Ng, K., et al. (2022) · npj Vaccines · doi:10.1038/s41541-022-00452-6 · Cited by 95
Sullivan, D. J., Franchini, M., Joyner, M. J., Casadevall, A., & Focosi, D. (2022) · Nature Communications · doi:10.1038/s41467-022-33864-y · Cited by 92
Immune correlates analysis of the ENSEMBLE single Ad26.COV2.S dose vaccine efficacy clinical trial
Fong, Y., McDermott, A. B., Benkeser, D. C., Roels, S., Stieh, D. J., Vandebosch, A., Gars, M. L., Roey, G. A. V., Houchens, C. R., Martins, K. A. O., et al. (2022) · Nature Microbiology · doi:10.1038/s41564-022-01262-1 · Cited by 92
Self-citationA self-amplifying RNA vaccine against COVID-19 with long-term room-temperature stability
Voigt, E. A., Gerhardt, A., Hanson, D., Jennewein, M. F., Battisti, P., Reed, S., Singh, J., Mohamath, R., Bakken, J., Beaver, S., et al. (2022) · npj Vaccines · doi:10.1038/s41541-022-00549-y · Cited by 89
Ai, J., Zhang, H., Zhang, Q., Zhang, Y., Lin, K., Fu, Z., Song, J., Zhao, Y., Fan, M., Wang, H., et al. (2021) · Cell Research · doi:10.1038/s41422-021-00590-x · Cited by 89
Recent updates on correlates of vaccine-induced protection
Plotkin, S. A. (2023) · Frontiers in Immunology · doi:10.3389/fimmu.2022.1081107 · Cited by 89
Osmanodja, B., Ronicke, S., Budde, K., Jens, A., Hammett, C., Koch, N., Seelow, E., Waiser, J., Zukunft, B., Bachmann, F., et al. (2022) · Journal of Clinical Medicine · doi:10.3390/jcm11092565 · Cited by 90
Does a humoral correlate of protection exist for SARS-CoV-2? A systematic review
Perry, J. A., Osman, S., Wright, J., Richard‐Greenblatt, M., Buchan, S. A., Sadarangani, M., & Bolotin, S. (2022) · PLoS ONE · doi:10.1371/journal.pone.0266852 · Cited by 93
Impact of aging on immunity in the context of COVID-19, HIV, and tuberculosis
Grifoni, A., Alonzi, T., Alter, G., Noonan, D. M., LANDAY, A. L., Albini, A., & Goletti, D. (2023) · Frontiers in Immunology · doi:10.3389/fimmu.2023.1146704 · Cited by 90
Abhishek, A., Boyton, R. J., Peckham, N., McKnight, Á., Coates, L. C., Bluett, J., Barber, V. S., Cureton, L., Francis, A., Appelbe, D. E., et al. (2022) · The Lancet Respiratory Medicine · doi:10.1016/s2213-2600(22)00186-2 · Cited by 84
SARS-CoV-2 antibodies and breakthrough infections in the Virus Watch cohort
Aldridge, R. W., Yavlinsky, A., Nguyen, V. G., Eyre, M. T., Shrotri, M., Navaratnam, A. M. D., Beale, S., Braithwaite, I., Byrne, T., Kovar, J., et al. (2022) · Nature Communications · doi:10.1038/s41467-022-32265-5 · Cited by 84
Neutralising antibodies after COVID-19 vaccination in UK haemodialysis patients
Carr, E. J., Wu, M., Harvey, R., Wall, E. C., Kelly, G. P., Hussain, S., Howell, M. T., Kassiotis, G., Swanton, C., Gandhi, S., et al. (2021) · The Lancet · doi:10.1016/s0140-6736(21)01854-7 · Cited by 83
Robust and durable serological response following pediatric SARS-CoV-2 infection
Renk, H., Dulovic, A., Seidel, A., Becker, M., Fabricius, D., Zernickel, M., Junker, D., Groß, R. M., Müller, J. A., Hilger, A., et al. (2022) · Nature Communications · doi:10.1038/s41467-021-27595-9 · Cited by 81
Vaccine protection against the SARS-CoV-2 Omicron variant in macaques
Chandrashekar, A., Yu, J., McMahan, K., Jacob-Dolan, C., Liu, J., He, X., Hope, D. L., Anioke, T., Barrett, J., Chung, B., et al. (2022) · Cell · doi:10.1016/j.cell.2022.03.024 · Cited by 82
Barin, B., Kasap, U., Selçuk, F., Volkan, E., & Uluçkan, Ö. (2022) · The Lancet Microbe · doi:10.1016/s2666-5247(21)00305-0 · Cited by 80
Impaired antibody response to COVID-19 vaccination in advanced HIV infection
Hassold, N., Brichler, S., Ouédraogo, É., Leclerc, D., Carroue, S., Gater, Y., Alloui, C., Carbonnelle, É., Bouchaud, O., Mechai, F., et al. (2022) · AIDS · doi:10.1097/qad.0000000000003166 · Cited by 78
Haggenburg, S., Hofsink, Q., Lissenberg-Witte, B. I., Broers, A. E. C., van Doesum, J. A., van Binnendijk, R. S., den Hartog, G., Bhoekhan, M. S., Haverkate, N. J. E., Burger, J. A., et al. (2022) · JAMA Oncology · doi:10.1001/jamaoncol.2022.3227 · Cited by 77
Direct comparison of antibody responses to four SARS-CoV-2 vaccines in Mongolia
Dashdorj, N., Wirz, O. F., Röltgen, K., Haraguchi, E., Buzzanco, A. S., Sibai, M., Wang, H., Miller, J. A., Solis, D., Sahoo, M. K., et al. (2021) · Cell Host & Microbe · doi:10.1016/j.chom.2021.11.004 · Cited by 76
Charmetant, X., Espi, M., Benotmane, I., Barateau, V., Heibel, F., Buron, F., Gautier-Vargas, G., Delafosse, M., Perrin, P., Koenig, A., et al. (2022) · Science Translational Medicine · doi:10.1126/scitranslmed.abl6141 · Cited by 84
SARS-CoV-2 Omicron sublineages exhibit distinct antibody escape patterns
Gruell, H., Vanshylla, K., Korenkov, M., Tober‐Lau, P., Zehner, M., Münn, F., Janicki, H., Augustin, M., Schommers, P., Sander, L. E., et al. (2022) · Cell Host & Microbe · doi:10.1016/j.chom.2022.07.002 · Cited by 77
Thuluva, S., Paradkar, V. M., Gunneri, S., Yerroju, V., Mogulla, R. R., Turaga, K., Kyasani, M., Manoharan, S. K., Medigeshi, G. R., Singh, J., et al. (2022) · EBioMedicine · doi:10.1016/j.ebiom.2022.104217 · Cited by 76
Maillard, A., Redjoul, R., Klémencie, M., Wallet, H. L., Bourgeois, A. L., D’Aveni, M., Huynh, A., Berceanu, A., Marchand, T., Chantepie, S., et al. (2021) · Blood · doi:10.1182/blood.2021014232 · Cited by 73
Stærke, N. B., Reekie, J., Nielsen, H., Benfield, T., Wiese, L., Knudsen, L. S., Iversen, M. B., Iversen, K. K., Fogh, K., Bodilsen, J., et al. (2022) · Nature Communications · doi:10.1038/s41467-022-32254-8 · Cited by 74
Contribution of low population immunity to the severe Omicron BA.2 outbreak in Hong Kong
Chen, L.-L., Abdullah, S. M. U., Chan, W.-M., Chan, B. P.-C., Ip, J. D., Chu, A. W.-H., Lu, L., Zhang, X., Zhao, Y., Chuang, V. W.-M., et al. (2022) · Nature Communications · doi:10.1038/s41467-022-31395-0 · Cited by 72
Huang, Y., Borisov, O., Kee, J. J., Carpp, L. N., Wrin, T., Cai, S., Sarzotti‐Kelsoe, M., McDanal, C. B., Eaton, A., Pajón, R., et al. (2021) · Scientific Reports · doi:10.1038/s41598-021-03154-6 · Cited by 74
Self-citationKaraba, A. H., Johnston, T. S., Aytenfisu, T. Y., Akinde, O., Eby, Y. J., Ruff, J. E., Abedon, A. T., Alejo, J. L., Blankson, J. N., Cox, A. L., et al. (2022) · Transplantation · doi:10.1097/tp.0000000000004140 · Cited by 71
SARS-CoV-2 Vaccine Antibody Response and Breakthrough Infection in Patients Receiving Dialysis
Anand, S., Montez‐Rath, M. E., Han, J., García, P., Cadden, L., Hunsader, P., Morgan, C., Kerschmann, R., Beyer, P., Dittrich, M., et al. (2021) · Annals of Internal Medicine · doi:10.7326/m21-4176 · Cited by 70
WHO international standard for SARS-CoV-2 antibodies to determine markers of protection
Zhu, F., Althaus, T., Tan, C. W., Costantini, A., Chia, W. N., Chau, N. V. V., Tan, L. V., Mattiuzzo, G., Rose, N. J., Voiglio, E. J., et al. (2021) · The Lancet Microbe · doi:10.1016/s2666-5247(21)00307-4 · Cited by 70
Wanlapakorn, N., Suntronwong, N., Phowatthanasathian, H., Yorsaeng, R., Vichaiwattana, P., Thongmee, T., Auphimai, C., Srimuan, D., Thatsanatorn, T., Assawakosri, S., et al. (2022) · Human Vaccines & Immunotherapeutics · doi:10.1080/21645515.2022.2029111 · Cited by 69
Miyamoto, S., Arashiro, T., Adachi, Y., Moriyama, S., Kinoshita, H., Kanno, T., Saito, S., Katano, H., Iida, S., Ainai, A., et al. (2022) · Med · doi:10.1016/j.medj.2022.02.006 · Cited by 68
Breadth of SARS-CoV-2 neutralization and protection induced by a nanoparticle vaccine
Li, D., Martinez, D. R., Schäfer, A., Chen, H., Barr, M., Sutherland, L. L., Lee, E., Parks, R., Mielke, D., Edwards, W., et al. (2022) · Nature Communications · doi:10.1038/s41467-022-33985-4 · Cited by 70
Metadata
- Authors
- Feng, S., Phillips, D. J., White, T., Sayal, H., Aley, P. K., Bibi, S., Dold, C., Fuskova, M., Gilbert, S. C., Hirsch, I., Humphries, H. E., Jepson, B., Kelly, E. J., Plested, E., Shoemaker, K., Thomas, K. M., Vekemans, J., Villafana, T. L., Lambe, T., Pollard, A. J., Voysey, M., the Oxford COVID Vaccine Trial Group, Adlou, S., Allen, L., Angus, B., Anslow, R., Asselin, M.-C., Baker, N., Baker, P., Barlow, T., Beveridge, A., Bewley, K. R., Brown, P., Brunt, E., Buttigieg, K. R., Camara, S., Charlton, S., Chiplin, E., Cicconi, P., Clutterbuck, E. A., Collins, A. M., Coombes, N. S., Clemens, S. A. C., Davison, M., Demissie, T., Dinesh, T., Douglas, A. D., Duncan, C. J. A., Emary, K. R. W., Ewer, K. J., Felle, S., Ferreira, D. M., Finn, A., Folegatti, P. M., Fothergill, R., Fraser, S., Garlant, H., Gatcombe, L., Godwin, K. J., Goodman, A. L., Green, C. A., Hallis, B., Hart, T. C., Heath, P. T., Hill, H., Hill, A. V. S., Jenkin, D., Kasanyinga, M., Kerridge, S., Knight, C., Leung, S., Libri, V., Lillie, P. J., Marinou, S., McGlashan, J., McGregor, A. C., McInroy, L., Minassian, A. M., Mujadidi, Y. F., Penn, E. J., Petropoulos, C. J., Pollock, K. M., Proud, P. C., Provstgaard-Morys, S., Rajapaska, D., Ramasamy, M. N., Sanders, K., Shaik, I., Singh, N., Smith, A., Snape, M. D., Song, R., Shrestha, S., Sutherland, R. K., Thomson, E. C., Turner, D. P. J., Webb-Bridges, A., Wrin, T., & Williams, C. J.
- Affiliations
- University of Oxford (GB)
- AstraZeneca (United Kingdom) (GB)
- Public Health England (GB)
- AstraZeneca (United States) (US)
- AstraZeneca (Sweden) (SE)
- Liverpool School of Tropical Medicine (GB)
- University of Siena (IT)
- Newcastle upon Tyne Hospitals NHS Foundation Trust (GB)
- University of Bristol (GB)
- St Thomas' Hospital (GB)
- University Hospitals Birmingham NHS Foundation Trust (GB)
- St George's, University of London (GB)
- University of Hull (GB)
- London North West Healthcare NHS Trust (GB)
- LabCorp (United States) (US)
- NHS Lothian (GB)
- Nottingham University Hospitals NHS Trust (GB)
- Aneurin Bevan University Health Board (GB)
- Corresponding author
- Voysey, Merryn
- ORCID
- Feng, Shuo
- Phillips, Daniel J.
- Aley, Parvinder K.
- Bibi, Sagida
- Dold, Christina
- Fuskova, Michelle
- Gilbert, Sarah C.
- Hirsch, Ian
- Humphries, Holly E.
- Jepson, Brett
- Kelly, Elizabeth J.
- Plested, Emma
- Thomas, Kelly M.
- Vekemans, Johan
- Villafana, Tonya L.
- Lambe, Teresa
- Pollard, Andrew J.
- Voysey, Merryn
- Allen, Lauren
- Angus, Brian
- Anslow, Rachel
- Asselin, Marie-Claude
- Baker, Natalie
- Baker, Philip
- Bewley, Kevin R.
- Brown, Phillip
- Buttigieg, Karen R.
- Camara, Susana
- Charlton, Sue
- Cicconi, Paola
- Clutterbuck, Elizabeth A.
- Collins, Andrea M.
- Coombes, Naomi S.
- Clemens, Sue Ann Costa
- Douglas, Alexander D.
- Duncan, Christopher J. A.
- Emary, Katherine R. W.
- Ewer, Katie J.
- Felle, Sally
- Ferreira, Daniela M.
- Finn, Adam
- Folegatti, Pedro M.
- Garlant, Harriet
- Goodman, Anna L.
- Green, Christopher A.
- Hallis, Bassam
- Hart, Thomas C.
- Heath, Paul T.
- Hill, Helen
- Hill, Adrian V. S.
- Jenkin, Daniel
- Kasanyinga, Mwila
- Kerridge, Simon
- Leung, Stephanie
- Libri, Vincenzo
- Lillie, Patrick J.
- Marinou, Spyridoula
- McGregor, Alastair C.
- Minassian, Angela M.
- Mujadidi, Yama F.
- Petropoulos, Christos J.
- Pollock, Katrina M.
- Proud, Pamela C.
- Provstgaard-Morys, Samuel
- Ramasamy, Maheshi N.
- Sanders, Katherine
- Smith, Andrew
- Snape, Matthew D.
- Song, Rinn
- Sutherland, Rebecca K.
- Thomson, Emma C.
- Turner, David P. J.
- Williams, Christopher J.
- Venue
- Nature Medicine
- Published
- 2021-09-29
- Volume
- 27
- Issue
- 11
- Pages
- 2032-2040
- ISSN
- 1078-8956 (ISSN-L)
- 1546-170X
- PMC
- PMC8604724
- OpenAlex
- W3174017401
- Cited by
- 1,163
- References
- 41
- Citations by year
- 2026: 36 · 2025: 94 · 2024: 155 · 2023: 255 · 2022: 515 · 2021: 106
- FWCI
- 81.72
- Type
- journal article
- Language
- en
- Open access
- hybrid
- doi.org
- Locations
- Nature Medicine (publishedVersion, cc-by)
- medRxiv (acceptedVersion, cc-by)
- PubMed Central (publishedVersion, cc-by)
- PubMed (publishedVersion)
- Repository@Nottingham (University of Nottingham) (publishedVersion, cc-by)
- St George's Online Research Archive (St George's University of London) (acceptedVersion)
- LSTM Online Archive (Liverpool School of Tropical Medicine) (acceptedVersion)
- ePrints Soton (University of Southampton) (acceptedVersion)
- Liverpool John Moores University (acceptedVersion)
- LSHTM Research Online (London School of Hygiene and Tropical Medicine) (acceptedVersion)
- UCL Discovery (University College London) (submittedVersion)
- Repository@Nottingham (University of Nottingham) (submittedVersion, cc-by)
- University of Birmingham Research Portal (University of Birmingham) (submittedVersion, other-oa)
- Spiral (Imperial College London) (submittedVersion, cc-by)
- Funders
- DH | National Institute for Health Research (NA)
- Topics
- Health Sciences › Medicine › Infectious Diseases › SARS-CoV-2 and COVID-19 Research
- Health Sciences › Medicine › Infectious Diseases › COVID-19 Clinical Research Studies
- Life Sciences › Agricultural and Biological Sciences › Animal Science and Zoology › Animal Virus Infections Studies
- Keywords
- SARS-CoV-2, COVID-19 vaccines, vaccine efficacy, binding antibodies, neutralizing antibodies, anti-spike antibodies, anti-RBD antibodies, pseudovirus neutralization, symptomatic infection, asymptomatic infection, Alpha variant, vaccine correlates of protection, vaccine licensure
- MeSH terms
- COVID-19, SARS-CoV-2, COVID-19 Vaccines, Adolescent, Adult, Aged, Aged, 80 and over, Antibodies, Viral, Female, United Kingdom, Humans, Immunization, Secondary, Male, Middle Aged, Vaccination, Cohort Studies, Treatment Outcome, Infection Control, Young Adult, Immunity, Humoral, Antibodies, Neutralizing, Asymptomatic Infections, Patient Acuity
About these checks
Registry, retraction, Cites and statistics results are computed, not judged, with one exception: a printed reference that no index lists is read once by a model before it counts as a citation error. Claims are extracted by a model and kept only when their quote appears verbatim in the text; each cited source is then checked, with a model’s help, for whether it says what the claim relies on. Those verdicts can be wrong — read the claim’s quote and the cited source before relying on one.
A language model drew the claims from the paper on 2026-10-06, under version 3 of the claim definition (model deepseek-v4.1-flash, prompt extract-v3).
A second model labelled each claim on 2026-10-06 (model jev-1.13-20260917, definition revision gold-guideline-v0.2).
Cited sources are checked with a language model’s help (gpt-6-sol).
Statistics and arithmetic are recomputed, not judged.
Confidence bands are shown only for fields calibrated on our annotated test set. None is calibrated yet, so no band is shown.
What counts as a claim ›How we measure confidence ›How we check this ›
Are you an author, or do you see a problem with this page? Request a review
