

The DOI matches its Crossref record; 59 of the 59 references it cites were found in a registry or an index.
Myelin insulation as a risk factor for axonal degeneration in autoimmune demyelinating disease
Open accessPublished version of a preprint
Abstract
Axonal degeneration determines the clinical outcome of multiple sclerosis and is thought to result from exposure of denuded axons to immune-mediated damage. Therefore, myelin is widely considered to be a protective structure for axons in multiple sclerosis. Myelinated axons also depend on oligodendrocytes, which provide metabolic and structural support to the axonal compartment. Given that axonal pathology in multiple sclerosis is already visible at early disease stages, before overt demyelination, we reasoned that autoimmune inflammation may disrupt oligodendroglial support mechanisms and hence primarily affect axons insulated by myelin. Here, we studied axonal pathology as a function of myelination in human multiple sclerosis and mouse models of autoimmune encephalomyelitis with genetically altered myelination. We demonstrate that myelin ensheathment itself becomes detrimental for axonal survival and increases the risk of axons degenerating in an autoimmune environment. This challenges the view of myelin as a solely protective structure and suggests that axonal dependence on oligodendroglial support can become fatal when myelin is under inflammatory attack.
Overview
The claims and statistics of this paper haven’t been checked yet.
Run the check — free, no account needed. It reads the open-access text and checks the sources it cites.
Integrity signals
Registry
Cites
Statistics
Figures
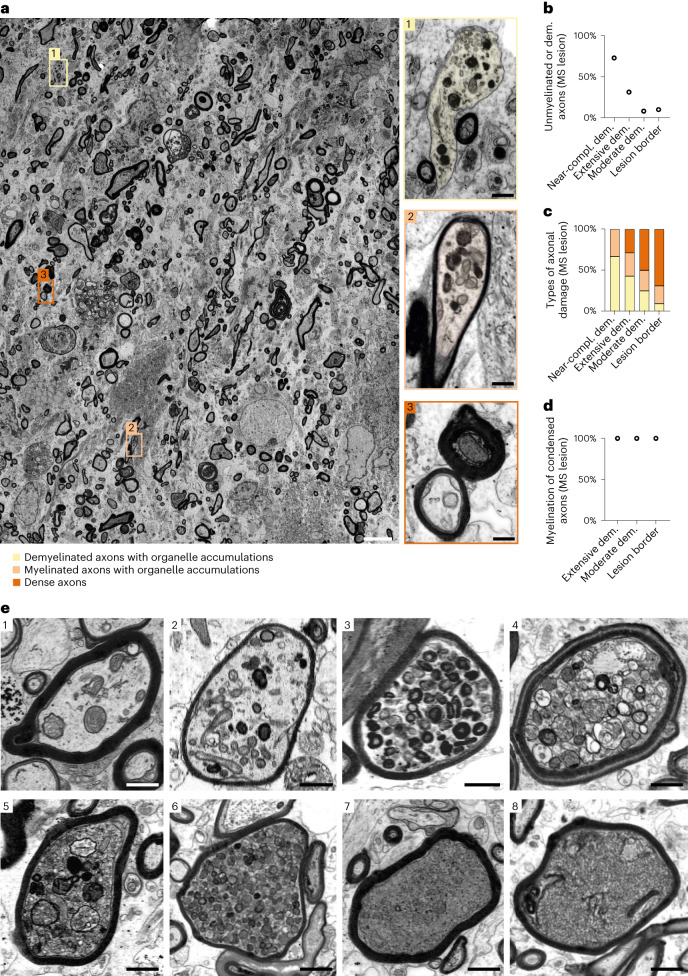
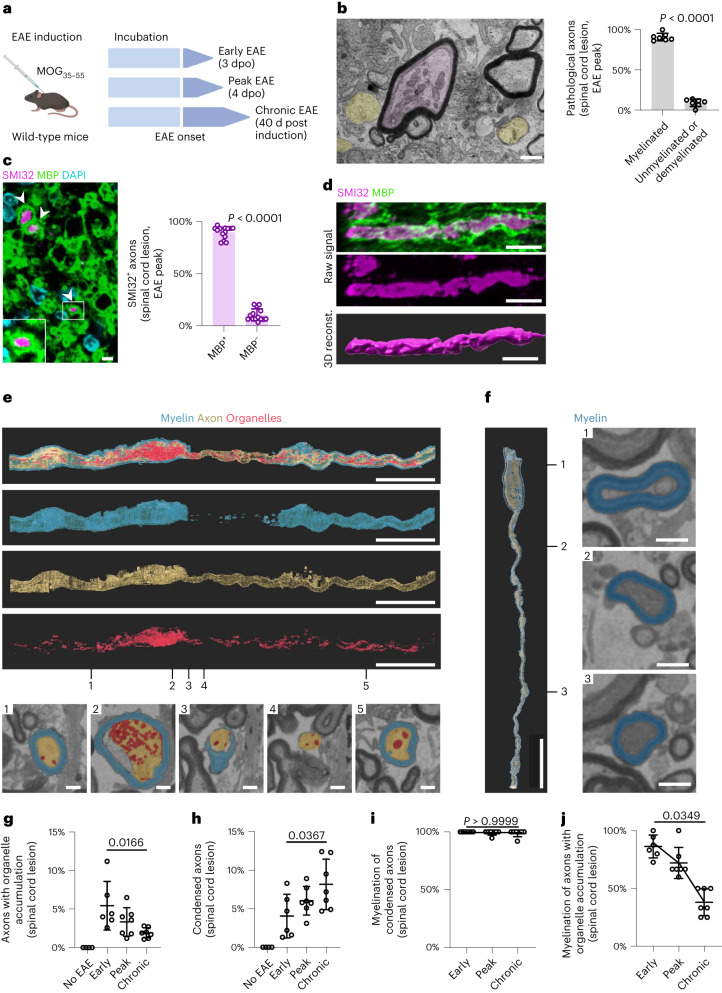
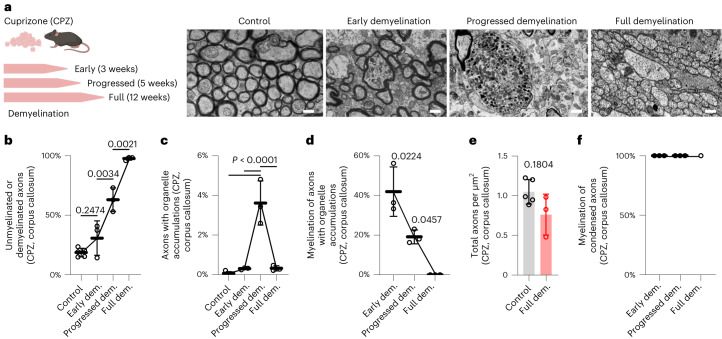
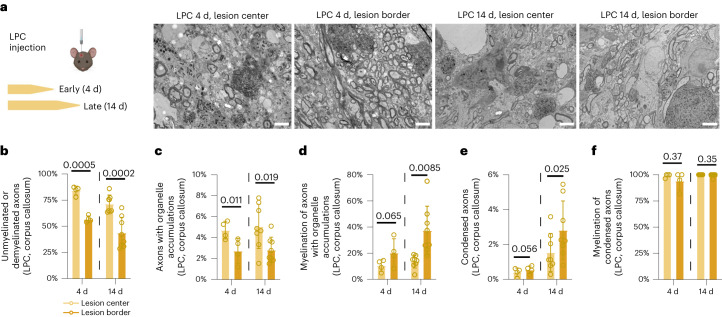
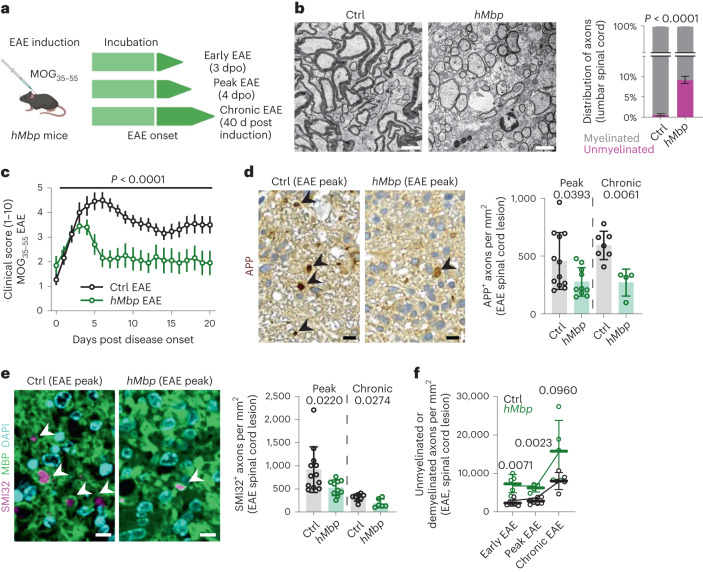
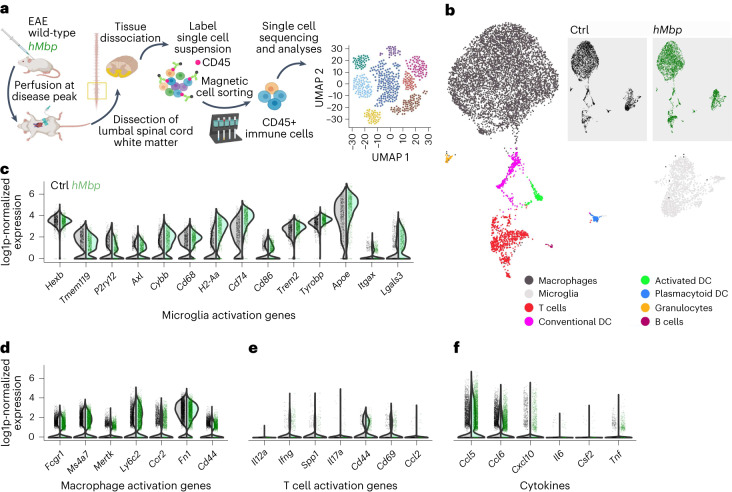
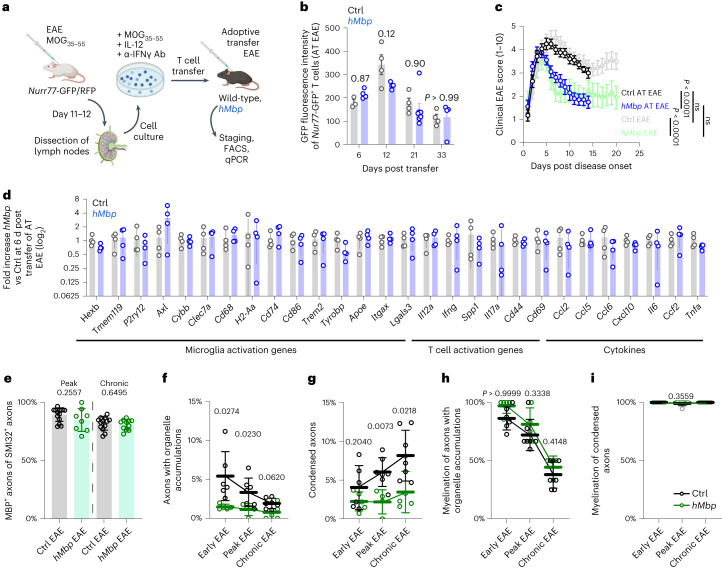
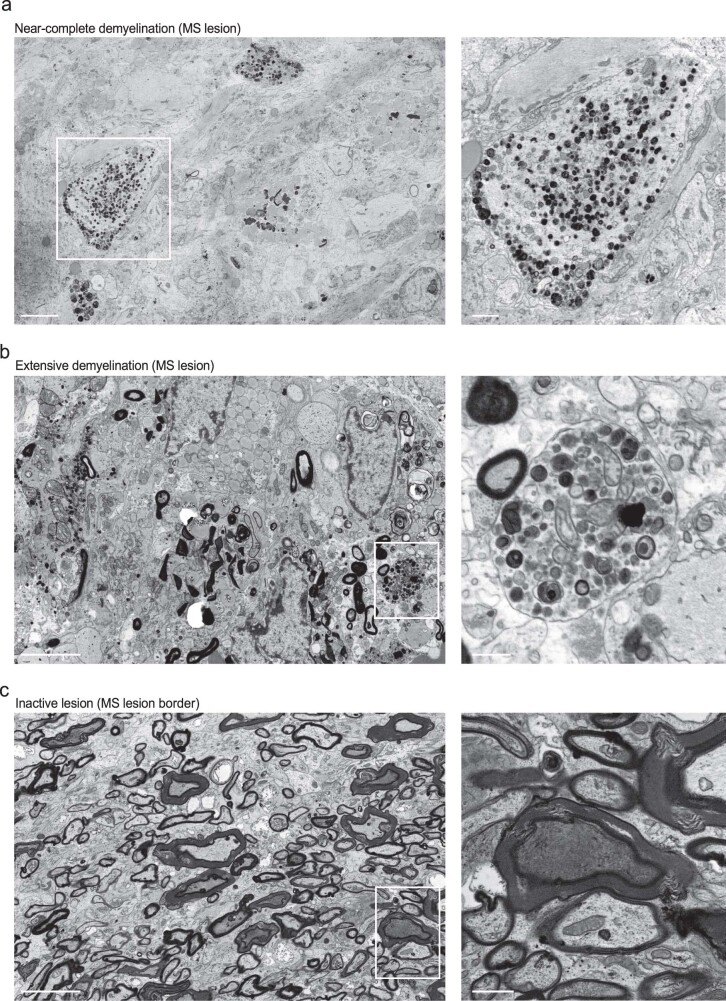
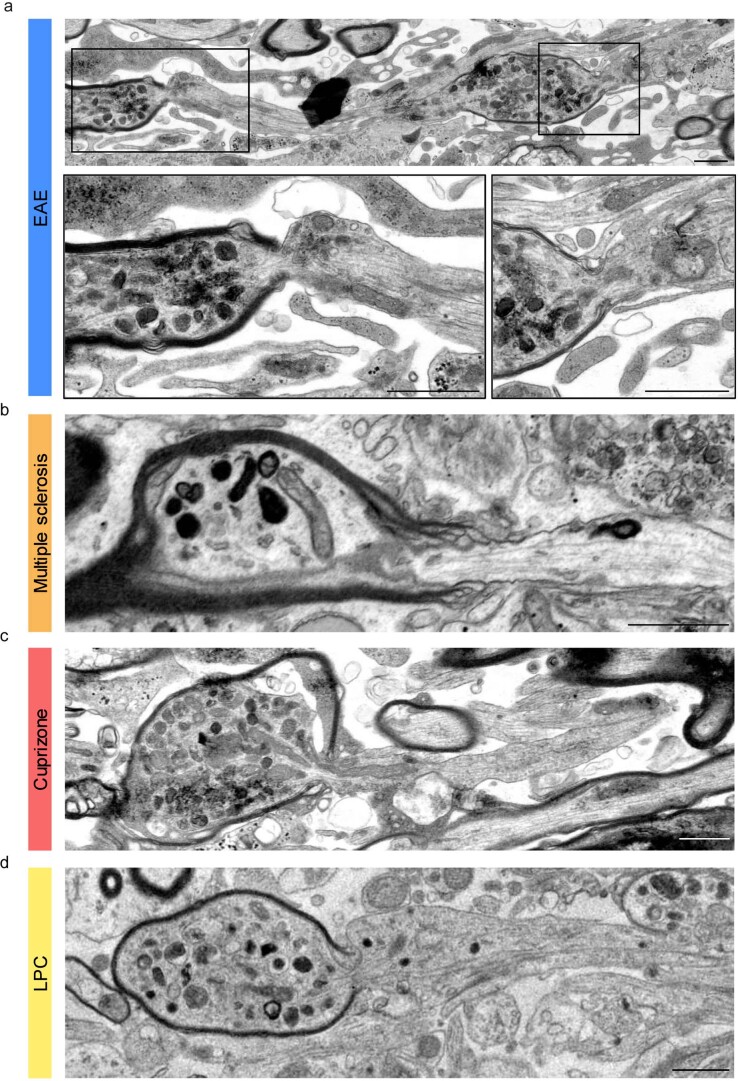
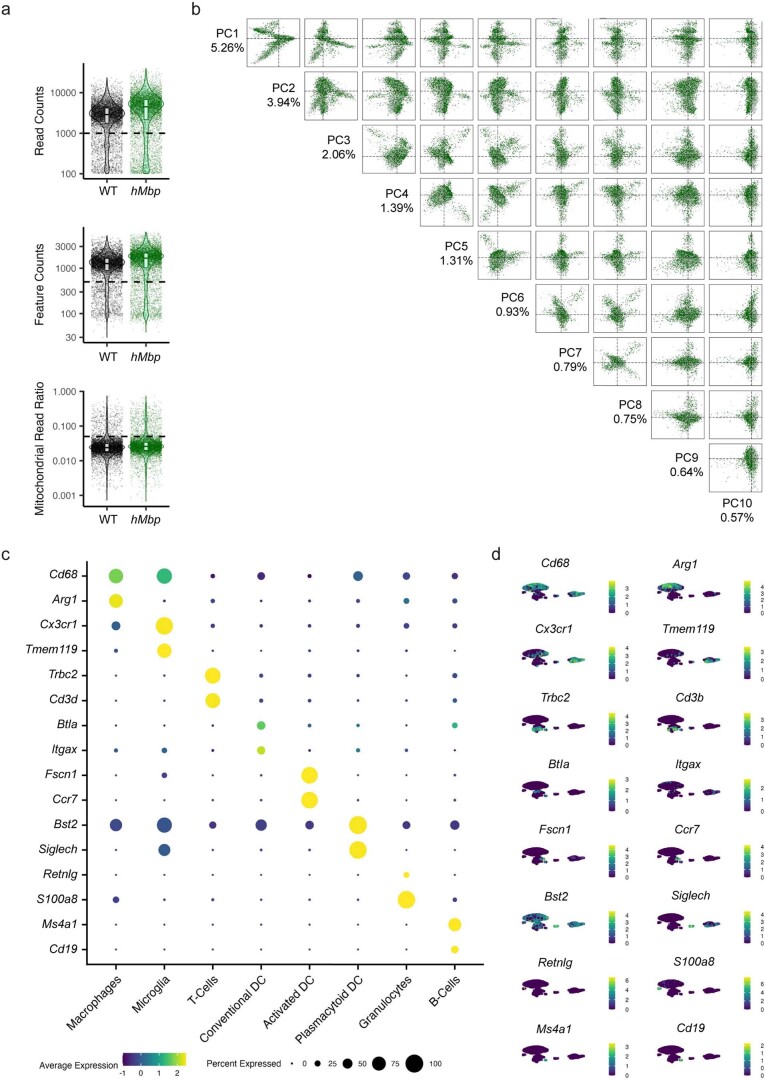
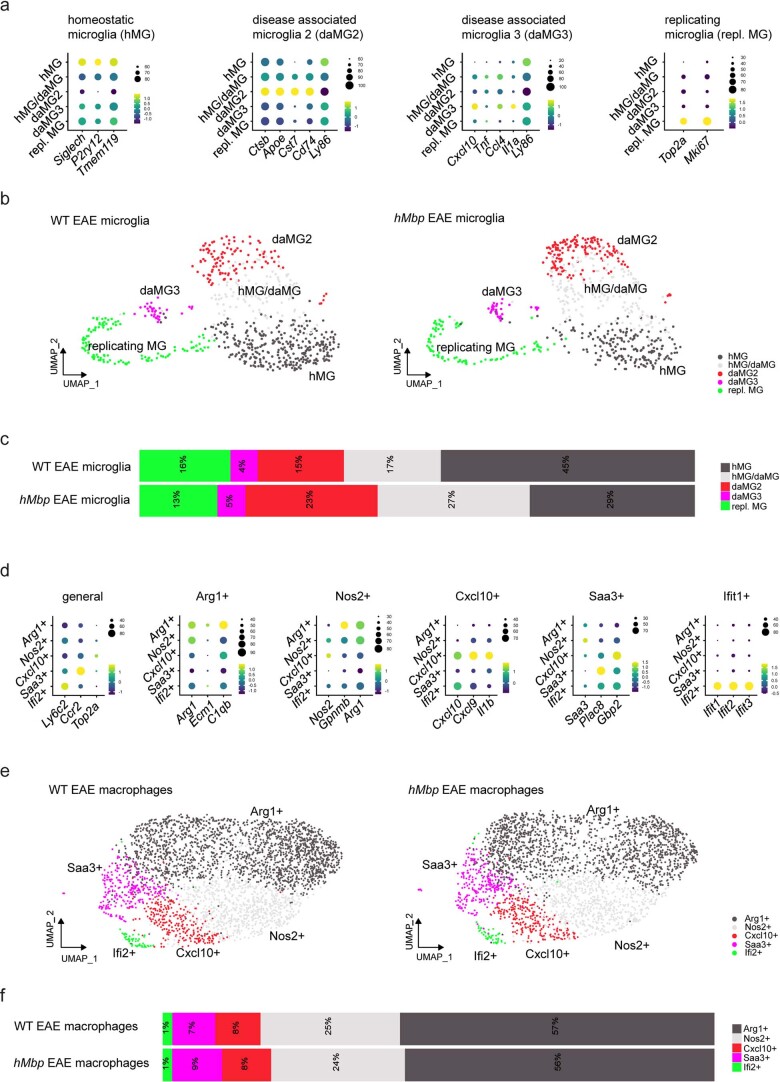
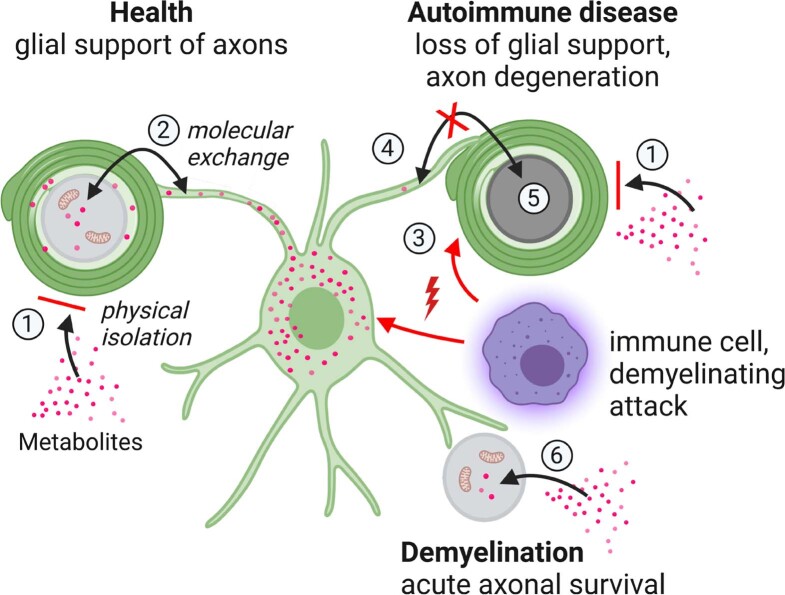
Verification
Claims the paper makes
The claims and statistics of this paper haven’t been checked yet.
Run the check — free, no account needed. It reads the open-access text and checks the sources it cites.
Claims other papers make about this one
Each is checked against this paper’s own text: does it say what the citing paper says it does?
The source backs part of the claim, not all of it — or backs it for a different population, condition or comparison.
In the citing paper
“the ability of oligodendrocytes and myelin to provide physical protection and metabolic support is undisputed.42,43”
From BCAS1-positive oligodendrocytes enable efficient cortical remyelination in multiple sclerosis (2025) · cites this paper as [42]
Experimental — accuracy not yet measured
Self-check
Percentages, sums and reported differences re-computed from the paper’s own numbers.
The self-check needs the paper’s full text.
Citations
Cites
Fiji: an open-source platform for biological-image analysis
Schindelin, J., Arganda-Carreras, I., Frise, E., Kaynig, V., Longair, M., Pietzsch, T., Preibisch, S., Rueden, C., Saalfeld, S., Schmid, B., et al. (2012) · Nature Methods · doi:10.1038/nmeth.2019 · Cited by 66,890
Integrating single-cell transcriptomic data across different conditions, technologies, and species
Butler, A., Hoffman, P., Smibert, P., Papalexi, E., & Satija, R. (2018) · Nature Biotechnology · doi:10.1038/nbt.4096 · Cited by 13,174
UMAP: Uniform Manifold Approximation and Projection
McInnes, L., Healy, J., Saul, N., & Großberger, L. (2018) · Journal of Open Source Software · doi:10.21105/joss.00861 · Cited by 9,826
Dissecting the multicellular ecosystem of metastatic melanoma by single-cell RNA-seq
Tirosh, I., Izar, B., Prakadan, S. M., Wadsworth, M. H., Treacy, D., Trombetta, J. J., Rotem, A., Rodman, C., Lian, C., Murphy, G., et al. (2016) · Science · doi:10.1126/science.aad0501 · Cited by 4,944
Multiple Sclerosis: An Immune or Neurodegenerative Disorder?
Trapp, B. D., & Nave, K.-A. (2008) · Annual Review of Neuroscience · doi:10.1146/annurev.neuro.30.051606.094313 · Cited by 1,724
Self-citationOligodendroglia metabolically support axons and contribute to neurodegeneration
Lee, Y., Morrison, B. M., Li, Y., Lengacher, S., Farah, M. H., Hoffman, P. N., Liu, Y., Tsingalia, A., Jin, L., Zhang, P.-W., et al. (2012) · Nature · doi:10.1038/nature11314 · Cited by 1,664 · cited 1×
“…from defective axon-glia interactions is in agreement with findings in oligodendroglial mutants 10–13 , and transplantation experiments 14,21,24,25 and is consistent with our understanding of oligodendroglial-mediated mechanisms, such as axonal metabolic support 7–9,26,27 and detoxification 28 .”
ResultGlycolytic oligodendrocytes maintain myelin and long-term axonal integrity
Fünfschilling, U., Supplie, L. M., Mahad, D., Boretius, S., Saab, A. S., Edgar, J., Brinkmann, B. G., Kassmann, C. M., Tzvetanova, I. D., Möbius, W., et al. (2012) · Nature · doi:10.1038/nature11007 · Cited by 1,523
Self-citationA smart local moving algorithm for large-scale modularity-based community detection
Waltman, L., & van Eck, N. J. (2013) · The European Physical Journal B · doi:10.1140/epjb/e2013-40829-0 · Cited by 1,088
Myelination and support of axonal integrity by glia
Nave, K.-A. (2010) · Nature · doi:10.1038/nature09614 · Cited by 1,062
Self-citationMoran, A. E., Holzapfel, K. L., Xing, Y., Cunningham, N. R., Maltzman, J. S., Punt, J. A., & Hogquist, K. A. (2011) · The Journal of Experimental Medicine · doi:10.1084/jem.20110308 · Cited by 1,050
Research works printed but not linked: 2
- Narciso, M. S., Hokoç, J. N. & Martinez, A. M. B. Watery and dark axons in Wallerian degeneration of the opossum’s optic nerve: different patterns of cytoskeletal breakdown? An. Acad. Bras. Cienc. 73, 230–243 (2001).
- Bittner, S., Afzali, A. M., Wiendl, H. & Meuth, S. G. Myelin oligodendrocyte glycoprotein (MOG35–55) induced experimental autoimmune encephalomyelitis (EAE) in C57BL/6 mice. J. Vis. Exp. 86, e51275 (2014).
Cited by
Sorted by citations
Microglia regulation of central nervous system myelin health and regeneration
Kent, S. A., & Miron, V. E. (2024) · Nature Reviews Immunology · doi:10.1038/s41577-023-00907-4 · Cited by 183
White matter aging and its impact on brain function
Groh, J., & Simons, M. (2025) · Neuron · doi:10.1016/j.neuron.2024.10.019 · Cited by 124
Oligodendrocytes: Myelination, Plasticity, and Axonal SupportPreprint
Simons, M., Gibson, E. M., & Nave, K. (2024) · Cold Spring Harbor Perspectives in Biology · doi:10.1101/cshperspect.a041359 · Cited by 110
Self-citationExpanding the function of oligodendrocytes to brain energy metabolism
Nave, K., Asadollahi, E., & Sasmita, A. O. (2023) · Current Opinion in Neurobiology · doi:10.1016/j.conb.2023.102782 · Cited by 97
Self-citationOligodendrocytes in Alzheimer’s disease pathophysiology
Kedia, S., & Simons, M. (2025) · Nature Neuroscience · doi:10.1038/s41593-025-01873-x · Cited by 86
White matter damage and degeneration in traumatic brain injury.
Armstrong, R. C., Sullivan, G. M., Perl, D. P., Rosarda, J. D., & Radomski, K. L. (2024) · Trends in Neurosciences · doi:10.1016/j.tins.2024.07.003 · Cited by 62
Jiao, Y., Yang, L., Wang, R., Song, G., Fu, J., Wang, J., Gao, N., & Wang, H. (2024) · Pharmaceutics · doi:10.3390/pharmaceutics16121611 · Cited by 63
Khan, Z., Mehan, S., Gupta, G. D., & Narula, A. S. (2024) · Neuroscience · doi:10.1016/j.neuroscience.2024.04.004 · Cited by 62
Remyelination protects neurons from DLK-mediated neurodegeneration
Duncan, G. J., Ingram, S. D., Emberley, K., Hill, J. Q., Cordano, C., Abdelhak, A., McCane, M., Jenks, J. E., Jabassini, N., Ananth, K., et al. (2024) · Nature Communications · doi:10.1038/s41467-024-53429-5 · Cited by 46
Myelin dysfunction in aging and brain disorders: mechanisms and therapeutic opportunities
Huang, Z., Zhang, Y., Zou, P., Zong, X., & Zhang, Q. (2025) · Molecular Neurodegeneration · doi:10.1186/s13024-025-00861-w · Cited by 49
Remyelination in the central nervous system
Franklin, R. J. M., Bodini, B., & Goldman, S. A. (2024) · Cold Spring Harbor Perspectives in Biology · doi:10.1101/cshperspect.a041371 · Cited by 40
Groh, J., Abdelwahab, T., Kattimani, Y., Hörner, M., Loserth, S., Gudi, V., Adalbert, R., Imdahl, F., Saliba, A.-E., Coleman, M., et al. (2023) · Nature Communications · doi:10.1038/s41467-023-42570-2 · Cited by 39
Glial Cells as Key Regulators in Neuroinflammatory Mechanisms Associated with Multiple Sclerosis
Theophanous, S., Sargiannidou, I., & Kleopa, K. A. (2024) · International Journal of Molecular Sciences · doi:10.3390/ijms25179588 · Cited by 38
Oligodendrocyte Maturation Alters the Cell Death Mechanisms That Cause Demyelination
Chapman, T. W., Kamen, Y., Piedra, E. T., & Hill, R. A. (2024) · The Journal of Neuroscience · doi:10.1523/jneurosci.1794-23.2024 · Cited by 33
González, G. M., Hart, B. A. ‘., Bugiani, M., Plemel, J. R., Schenk, G. J., Kooij, G., & Luchicchi, A. (2025) · Acta Neuropathologica · doi:10.1007/s00401-025-02923-1 · Cited by 20
BCAS1-positive oligodendrocytes enable efficient cortical remyelination in multiple sclerosis
Bergner, C. G., van der Meer, F., Franz, J., Vakrakou, A., Würfel, T., Nessler, S., Schäfer, L., Nau-Gietz, C., Winkler, A., Lagumersindez-Denis, N., et al. (2025) · Brain · doi:10.1093/brain/awae293 · Cited by 16
“42,43 Which cells are at the forefront of myelin regeneration is a matter of ongoing debate.”
Self-citationHörner, M., Groh, J., Klein, D., Ilg, W., Schöls, L. J., Santos, S. D., Bergmann, A., Klebe, S., Cauhapé, M., Branchu, J., et al. (2022) · Experimental Neurology · doi:10.1016/j.expneurol.2022.114119 · Cited by 15
Yao, X., Chen, J., Yu, Z., Huang, Z., Hamel, R., Liu, J.-H., Shen, X., Wang, Y.-E., Zeng, Y.-Q., Huang, Z., et al. (2024) · Experimental Neurology · doi:10.1016/j.expneurol.2024.114909 · Cited by 17
Tang, W., Wang, Q., Sun, M., Liu, C., Huang, Y., Zhou, M., Zhang, X., Meng, Z., & Zhang, J. (2024) · Life Sciences · doi:10.1016/j.lfs.2024.122952 · Cited by 14
Identifying Biomarkers for Remyelination and Recovery in Multiple Sclerosis: A Measure of Progress
Ricigliano, V. A. G., Marenna, S., Borrelli, S., Camera, V., Contentti, E. C., Szejko, N., Bakirtzis, C., Gluščević, S. V., Samadzadeh, S., Hartung, H.-P., et al. (2025) · Biomedicines · doi:10.3390/biomedicines13020357 · Cited by 15
White Matter in Crisis: Oligodendrocytes and the Pathophysiology of Multiple Sclerosis
García-Domínguez, M. (2025) · Cells · doi:10.3390/cells14181408 · Cited by 13
CNS macrophage contributions to myelin health
Hoffmann, A., & Miron, V. E. (2024) · Immunological Reviews · doi:10.1111/imr.13416 · Cited by 13
Garcia, P. A., Sánchez-Rueda, A., Velasco-Avilés, S., Tamayo-Caro, M., Ferrer-Pinós, A., Huarte-Sebastian, C., Álvarez, V., Riobello, C., Jiménez-Vega, S., Buendía, I., et al. (2024) · Science Advances · doi:10.1126/sciadv.adm7600 · Cited by 12
Maazouzi, M., Rasheed, M., Mbarek, L., Wang, X., Liang, J., Ma, H., Chen, Z., & Deng, Y. (2025) · Journal of Neurochemistry · doi:10.1111/jnc.70031 · Cited by 11
Zheng, Y., Hu, J., Sun, C., Qiao, K., Zhao, Y., Liu, B., Sun, J., Xi, J., Luo, S., Lu, J., et al. (2024) · Frontiers in Neurology · doi:10.3389/fneur.2024.1326874 · Cited by 10
Yuan, J., Tao, Y., Wang, M., Chen, Y., Han, X., Wu, H., Shi, H., Huang, F., & Wu, X. (2025) · Journal of Advanced Research · doi:10.1016/j.jare.2025.04.028 · Cited by 9
Inflammation’s impact on the interaction between oligodendrocytes and axons
Green, T. R. F., Pingen, M., & Edgar, J. M. (2025) · Discovery Immunology · doi:10.1093/discim/kyaf008 · Cited by 11
Self-citationIs age-related myelinodegenerative change an initial risk factor of neurodegenerative diseases?
Wu, S., & Chen, J. (2025) · Neural Regeneration Research · doi:10.4103/nrr.nrr-d-24-00848 · Cited by 9
Zhang, J., Ma, W., Liu, R., Li, X., Yuan, Z., & Cheng, J. (2025) · Neural Regeneration Research · doi:10.4103/nrr.nrr-d-24-01648 · Cited by 11
Wu, H., Mi, Y., Zheng, C., Zhang, Y., Xu, S., Zhu, J., & Jin, T. (2025) · Neurobiology of Disease · doi:10.1016/j.nbd.2025.107179 · Cited by 9
The Hidden Hand in White Matter: Pericytes and the Puzzle of Demyelination
Raj, S., Sarangi, P., Goyal, D., & Kumar, H. (2024) · ACS Pharmacology & Translational Science · doi:10.1021/acsptsci.4c00192 · Cited by 8
Oligodendrocyte and Myelin Pathophysiology in Multiple Sclerosis
López-Muguruza, E., Peiró-Moreno, C., Ruiz, A., & Matute, C. (2025) · Advances in neurobiology · doi:10.1007/978-3-031-87919-7_12 · Cited by 9
The Dual Role of Microglia in Multiple Sclerosis and its Implications for Diagnostics and Repair
Goulart, M. T., Queiroz, D. T. U., & Ribeiro, F. M. (2025) · Current Neuropharmacology · doi:10.2174/011570159x352356241126044933 · Cited by 8
Multiple sclerosis: what have we learned and can we still learn from electron microscopy
Oost, W., Meilof, J. F., & Baron, W. (2025) · Cellular and Molecular Life Sciences · doi:10.1007/s00018-025-05690-0 · Cited by 7
Butt, A. M., Niu, J., Yi, C., & Verkhratsky, A. (2026) · Physiological Reviews · doi:10.1152/physrev.00023.2025 · Cited by 7
Guo, D., Yao, Y., Liu, X., & Han, Y. (2024) · Pharmacology Biochemistry and Behavior · doi:10.1016/j.pbb.2024.173824 · Cited by 7
Demyelinated lesion associated compartmental inflammation in progressive multiple sclerosis brains
Najm, L., Chomyk, A. M., Cyncynatus, K., Davalos, D., Mahajan, K. R., & Trapp, B. D. (2025) · Acta Neuropathologica Communications · doi:10.1186/s40478-025-02122-9 · Cited by 6
Hörner, M., Popp, S., Branchu, J., Stévanin, G., Darios, F. D., Klebe, S., Groh, J., & Martini, R. (2024) · Frontiers in Neuroscience · doi:10.3389/fnins.2024.1299554 · Cited by 7
Abdelwahab, T., Stadler, D., Knöpper, K., Arampatzi, P., Saliba, A., Kastenmüller, W., Martini, R., & Groh, J. (2023) · iScience · doi:10.1016/j.isci.2023.106698 · Cited by 6
A myelinic channel system for motor-driven organelle transportPreprint
Chapple, K. J., Green, T. R. F., Wirth, S., Chen, Y.-H., Gerwig, U. C., Aicher, M. L., Kim, Y., Komarek, L., Brown, A. M., Crawford, C. L., et al. (2024) · bioRxiv (Cold Spring Harbor Laboratory) · doi:10.1101/2024.06.02.591488 · Cited by 6
Self-citationRecent developments in multiple sclerosis neuropathology
Stadelmann, C., Franz, J., & Nessler, S. (2025) · Current Opinion in Neurology · doi:10.1097/wco.0000000000001370 · Cited by 6
Self-citationHow do different cell populations orchestrate myelin regeneration?
Grassi, S., & Prinetti, A. (2025) · Biochemical Society Transactions · doi:10.1042/bst20231085 · Cited by 5
Functional contrast across the gray-white matter boundary
Li, M., Xu, L., Choi, S., Qin, Y., Gao, F., Schilling, K. G., Gao, Y., Zu, Z., Anderson, A. W., Ding, Z., et al. (2025) · Nature Communications · doi:10.1038/s41467-025-61251-w · Cited by 5
Gacem, N., Bezukladova, S., Windener, F., Karam, T., Ottoboni, L. K., Brambilla, E., Ruffini, F., Soman, K., García-Díaz, B., Levy, M. J. F., et al. (2026) · Science Translational Medicine · doi:10.1126/scitranslmed.ads0633 · Cited by 6
Li, F., Tao, S., Wang, S., Ren, T., Qiu, M. S., & Xu, X. (2026) · Journal of Advanced Research · doi:10.1016/j.jare.2026.04.052 · Cited by 3
Advanced MRI Measures of Myelin and Axon Volume Identify Repair in Multiple Sclerosis
Sanabria-Díaz, G., Cagol, A., Lu, P., Baraković, M., Ocampo‐Pineda, M., Chen, X., Weigel, M., Ruberte, E., Siebenborn, N. D. O. S., Galbusera, R., et al. (2024) · Annals of Neurology · doi:10.1002/ana.27102 · Cited by 4
Altered Gray Matter Myelin in Type IIb Focal Cortical Dysplasia
Rossini, L., Maderna, E., Santis, D. D., Rizzi, M., Tassi, L., Pastori, C., Garbelli, R., & de Curtis, M. (2024) · Neurology · doi:10.1212/wnl.0000000000210057 · Cited by 3
Henry-Ojo, H. O., Liu, F., & Narayanan, S. P. (2025) · Biomolecules · doi:10.3390/biom15020158 · Cited by 3
Chapple, K. J., Green, T. R. F., Schuster, K. H., Wirth, S., Chen, Y.-H., Gerwig, U. C., Aicher, M. L., Kim, Y., Komarek, L., Brown, A. M., et al. (2026) · Nature Neuroscience · doi:10.1038/s41593-026-02383-0 · Cited by 11
Self-citationMatsuzaka, Y., & Yashiro, R. (2023) · Biologics · doi:10.3390/biologics3030013 · Cited by 3
Microstructural Changes in the Corpus Callosum in Neurodegenerative Diseases
Albadawi, E. A. (2024) · Cureus · doi:10.7759/cureus.67378 · Cited by 3
Izagirre‐Urizar, L., Mora-Huerta, L., Soler-Sáez, I., Morales‐Gallel, R., Ulloa-Navas, M. J., Chara, J. C., Calovi, S., Deboux, C., Merino‐Cacho, L., Netzahualcoyotzi, C., et al. (2025) · bioRxiv (Cold Spring Harbor Laboratory) · doi:10.1101/2025.01.10.632306 · Cited by 3
Wrapped up: advancements in volume electron microscopy and application in myelin research
Schadt, L. C., Ruhwedel, T., Pape, C., Sasmita, A. O., Steyer, A. M., & Möbius, W. (2024) · Methods in microscopy · doi:10.1515/mim-2024-0013 · Cited by 3
Self-citationBrain Myelin Covariance Networks: Gradients, Cognition, and Higher-Order Landscape
Wu, H., Church, A., Jiang, X., Labus, J. S., Yan, C., Mayer, E. A., & Wang, H. (2025) · Behavioral Sciences · doi:10.3390/bs15111466 · Cited by 3
Lin, M. L., & Lin, W. (2026) · International Journal of Molecular Sciences · doi:10.3390/ijms27041779 · Cited by 2
Protocol to induce neurodegeneration in a local area of the mouse brain by stereotaxic injection
Zhang, X., Lu, Q., Meng, X., & Kim, J. Y. (2024) · STAR Protocols · doi:10.1016/j.xpro.2024.103243 · Cited by 2
Liu, Y., Bu, J., Wang, J., Zhao, Y., Peng, S., Liu, L., Su, P., Bai, M., Shen, J.-D., Xu, E., et al. (2025) · Biochemical Pharmacology · doi:10.1016/j.bcp.2025.117432 · Cited by 2
Tsai, H., Piya, S., Wang, J., Zhu, J. K., Hu, W., Gehrke, A. R., Cao, S., Guise, A. J., Chan, S. J., Sheehan, M. J., et al. (2025) · bioRxiv (Cold Spring Harbor Laboratory) · doi:10.1101/2025.02.07.637125 · Cited by 2
Role of oligodendroglial ADAM10 in oligodendrocyte maturation, myelination and myelin maintenancePreprint
Lavaud, M., Padilla-Ferrer, A., Simon, A., Acebo, P., Dargenet-Becker, C., Gorgievski, V., Tzavara, E. T., Massaad, C., Jafarian-Tehrani, M., & Meffre, D. (2025) · bioRxiv (Cold Spring Harbor Laboratory) · doi:10.1101/2025.07.25.666787 · Cited by 2
Dying oligodendrocytes persist without mitochondriaPreprint
Bame, X., Gilani, S. Z., Kamen, Y., & Hill, R. (2026) · bioRxiv (Cold Spring Harbor Laboratory) · doi:10.64898/2026.01.19.699752 · Cited by 3
Demyelination and Remyelination: General Principles
Niu, J., Verkhratsky, A., Butt, A. M., & Yi, C. (2025) · Advances in neurobiology · doi:10.1007/978-3-031-87919-7_9 · Cited by 2
Wrap it up: myelination of transplanted neurons for repair
Martínez-Reza, M. F., & Götz, M. (2025) · Frontiers in Cellular Neuroscience · doi:10.3389/fncel.2025.1635551 · Cited by 1
Bardile, C. F., Priego, M., Sidik, H., Tano, V., Langley, S. R., Pouladi, M. A., & Morfini, G. A. (2026) · Journal of Neurochemistry · doi:10.1111/jnc.70356 · Cited by 1
The Hypothesis of Myelinodegeneration as an Initial Risk of Neuropathic Pain
Chen, J., & Wu, S. (2026) · Neuroscience Bulletin · doi:10.1007/s12264-025-01576-0 · Cited by 1
Cannabinoid CB1 receptors drive oligodendrocyte maturation during myelin regeneration
Ezquerro, S., Torre, A. S.-D. L., Monory, K., Lutz, B., Guzmán, M., Aguado, T., & Palazuelos, J. (2026) · Cell Communication and Signaling · doi:10.1186/s12964-026-02852-w · Cited by 1
Glial cells in chronic inflammation: diversity, dysfunction and therapeutic targeting
Lee, H., Rone, J. M., Lee, J.-H., & Quintana, F. J. (2026) · Nature reviews. Immunology · doi:10.1038/s41577-026-01313-2 · Cited by 3
Song, Y., Dongye, Z., Yao, J., Zhao, X., Mo, T., Yang, S., Sun, C., Zhao, T., Li, J., & Wu, Y. (2026) · 中国科学通报:英文版 · doi:10.1016/j.scib.2026.08.017 · Cited by 2
Oligodendrocyte dysfunction in human age-related cognitive decline
Craig, G. A., Merour, E., Seeker, L. A., Haughian, A. J., Arbabi, K., Rose, J. L., Hoffmann, A., Thapar, J., Corsinotti, A., Mitchell, S., et al. (2026) · Nature Medicine · doi:10.1038/s41591-026-04608-y · Cited by 1
Chen, S.-W., Chu, Y., Chu, C., Pham, X.-D. T., Ng, H. P., Guo, C., & Cheng, P. (2025) · Cell Reports · doi:10.1016/j.celrep.2024.115161 · Cited by 1
In conversation with Klaus-Armin Nave
Floriddia, E. (2023) · Nature Neuroscience · doi:10.1038/s41593-023-01349-w
Myelin under attack endangers axons
Whalley, K. (2023) · Nature reviews. Neuroscience · doi:10.1038/s41583-023-00726-5
Lysophosphatidic acid receptor 1 influences disease severity in a mouse model of multiple sclerosisPreprint
Uemura, N., Matsuo, N., Taniyama, K., Nakajima, H., Nagayasu, K., Kaneko, S., Chun, J. J. M., Ueda, H., & Shirakawa, H. (2024) · bioRxiv (Cold Spring Harbor Laboratory) · doi:10.1101/2024.05.28.596148
Svendsen, O. B., Hasegawa, R., Yang, R. R., Uzuncayir, M. A., Conoan, N. H., Hasselholt, S., Midtgaard, J., Xu, N.-L., Lee, F. S. Y., & Nyengaard, J. R. (2024) · Brain Mechanisms · doi:10.1016/j.bramec.2024.202483
Mahyad, M., Saeidi, M., Kohandel, K., Ebrahimian, M., Baghaei, M., Jahani, S., & Nahayati, M. (2025) · Acta Neurologica Scandinavica · doi:10.1155/ane/5593383
Joseph, T. S., Liu, H., Kolind, S., Zhao, G., Sun, P., Carruthers, R. L., Schabas, A. J., Sayao, A., Devonshire, V. A., Tam, R. C., et al. (2025) · Multiple Sclerosis and Related Disorders · doi:10.1016/j.msard.2025.106696
Yuan, Y., Zhu, L., Wang, M., Fu, P., Zhang, H., Chu, B., Yang, F., Zhao, X., Zhang, Z., & Wang, X. (2025) · ACS Photonics · doi:10.1021/acsphotonics.5c01095
Fully, P. L., Ali, A., Ronickom, J. F. A., & Swaminathan, R. (2025) · Springer eBooks · doi:10.1007/978-981-96-9342-9_1
Activation of Ca2+-sensing receptor exhibited differential response between neurons and glial cells
Park, M., Shin, S. D., & Bandyopadhyay, B. C. (2025) · Experimental Brain Research · doi:10.1007/s00221-025-07205-6
Balantzategi, U., Gaminde‐Blasco, A., Alcañiz, N., Ramírez, J., Senovilla-Ganzo, R., Hernández-Pinedo, N., Fernandez-Ballester, M., Soria, F. N., de la Fuente, A. G., García‐Moreno, F., et al. (2025) · bioRxiv (Cold Spring Harbor Laboratory) · doi:10.64898/2025.12.09.693299
Sengupta, N., Luebke, J. I., & Weaver, C. M. (2025) · PLoS Computational Biology · doi:10.1371/journal.pcbi.1013733 · Cited by 1
Nerve Conduction Studies for the Early Detection of Diabetic Peripheral Neuropathy
Taksande, A. B., & Patil, M. S. (2025) · Journal of Datta Meghe Institute of Medical Sciences University · doi:10.4103/jdmimsu.jdmimsu_374_25
Acute, low-grade inflammation elevates white matter sensitivity to ischemiaPreprint
Mellor, A., Harper, G. M., Kelland, E. E., & Fern, R. F. (2026) · bioRxiv (Cold Spring Harbor Laboratory) · doi:10.64898/2026.01.07.698147
Moonen, B., Bolkaerts, L., Poelmans, K., Wouters, F., Kuipers, K., Guns, J., Verberk, S. G. S., Wolfs, E., Jansen, Y., Döring, Y., et al. (2026) · bioRxiv (Cold Spring Harbor Laboratory) · doi:10.64898/2026.01.22.701034
Chang, M., Zhang, K., Li, Y., Chen, X., Lan, T., Zhu, Y., Wang, W., Wang, C., Zhuang, X., Chen, S., et al. (2026) · Journal of Advanced Research · doi:10.1016/j.jare.2026.01.066 · Cited by 1
Wellman, S. M., Guzman, K., Suematsu, N., Thai, T. T. D., Tung, T.-H., Padilla, C. G., Sridhar, S., Chen, K., Cambi, F., & Kozai, T. D. Y. (2026) · Journal of Neural Engineering · doi:10.1088/1741-2552/ae4d8b · Cited by 1
Imaging myelin content changes: A bridge between tissue and clinics
Galbusera, R., Stadelmann, C., & Granziera, C. (2026) · Revue Neurologique · doi:10.1016/j.neurol.2026.03.011
Self-citationThe ‘gut feeling’: Connecting neurodegenerative diseases and gut microbiota
Niyogi, S., & Basu, S. (2026) · The Microbe · doi:10.1016/j.microb.2026.100719
Choobsaz, H., Ghotbi, N., & Ansari, N. N. (2026) · Journal of Bodywork and Movement Therapies · doi:10.1016/j.jbmt.2026.04.019
Aged oligodendrocyte progenitors retain the capacity to respond to an inflammatory insult
Fresenko, E. E., Kaiser, K. E., Burson, B., Bahri, C. N., Ahmed, N., Bozik, J. B., Packer, D., Tabor, B. J., Beirowski, B., Wedemeyer, M. A., et al. (2026) · Experimental Neurology · doi:10.1016/j.expneurol.2026.115874
Targeting glial cells through nanotherapeutic strategies in neurological disorders
Singh, S. N., Mallick, S., Dinodiya, H., Baid, S., & Vankayala, R. (2026) · Elsevier eBooks · doi:10.1016/b978-0-443-33623-2.00011-8
Izagirre‐Urizar, L., Mora-Huerta, L., Soler-Sáez, I., Morales‐Gallel, R., Masson, M. L. P., Ulloa-Navas, M. J., Chara, J. C., Calovi, S., Deboux, C., Merino‐Cacho, L., et al. (2026) · Nature Communications · doi:10.1038/s41467-026-74488-w · Cited by 4
Tsai, H., Piya, S., Wang, J., Zhu, J., Hu, W., Gehrke, A. R., Cao, S., Guise, A. J., Chan, S. J., Sheehan, M. J., et al. (2026) · Frontiers in Bioinformatics · doi:10.3389/fbinf.2026.1832826 · Cited by 2
Park, J., Cheon, S. Y., & Guo, F. (2026) · Glia · doi:10.1002/glia.70211 · Cited by 1
Ortiz, C., Kraev, I., Gromnicova, R., Pearson, A., NAAMAN, A., MULLAN, M. J., Crawford, F., & Ojo, J. O. (2026) · Journal of Neuropathology & Experimental Neurology · doi:10.1093/jnen/nlag092
The Maintenance of Dysmyelinated Small‐Diameter Axons by 14‐3‐3s in the Central Nervous System
Yamada, N., Saito, H., Takahashi, R., Fujisato, M., Hosoda, Y., Sasaki, B., Yamada, M., Abe, S., Hayashi, C., Yoshimoto, A., et al. (2026) · Glia · doi:10.1002/glia.70221
Self-citationȘerban, M., Toader, C., & Covache-Busuioc, R.-A. (2026) · International Journal of Molecular Sciences · doi:10.3390/ijms27188280
Oligodendrocytes in central nervous system health and disease
Ryan, L. J., & Miron, V. E. (2026) · Cell · doi:10.1016/j.cell.2026.08.003
Chromogranin B acts as a neuronal paracrine factor to trigger oligodendrocyte apoptosis
Yamada, N., Yamada, M., 小野, 鈴., Sasaki, B., Abe, S., Aoki, T., Yoshimoto, A., Ohkawa, R., & Suzuki, N. (2026) · PLoS ONE · doi:10.1371/journal.pone.0358362
Chronic progressive demyelination induces a microglial state with lysosomal dysfunction
Berghoff, S. A., Spieth, L., Vitale, S., Schlaphoff, L., Zirngibl, M., Junker, N., Dean, A.-C., Liu, L., Damkou, A., Roth, S., et al. (2026) · Nature Neuroscience · doi:10.1038/s41593-026-02489-5 · Cited by 2
Self-citationGommerman, J. L., Akassoglou, K., Baranzini, S. E., Becher, B., Brilot, F., Castelo‐Branco, G., Dunn, S. E., Faiz, M., Flügel, A., Ghasemlou, N., et al. (2026) · Nature Reviews Neurology · doi:10.1038/s41582-026-01272-1
Self-citation
Metadata
- Authors
- Schäffner, E., Bosch-Queralt, M., Edgar, J. M., Lehning, M., Strauß, J., Fleischer, N., Kungl, T., Wieghofer, P., Berghoff, S. A., Reinert, T., Krueger, M., Morawski, M., Möbius, W., Barrantes-Freer, A., Stieler, J., Sun, T., Saher, G., Schwab, M. H., Wrede, C., Frosch, M., Prinz, M., Reich, D. S., Flügel, A., Stadelmann, C., Fledrich, R., Nave, K.-A., & Stassart, R. M.
- Affiliations
- University Hospital Leipzig (DE)
- Max Planck Institute for Multidisciplinary Sciences (DE)
- Universitätsmedizin Göttingen (DE)
- Leipzig University (DE)
- University of Augsburg (DE)
- German Center for Neurodegenerative Diseases (DE)
- Medizinische Hochschule Hannover (DE)
- University of Freiburg (DE)
- National Institutes of Health (US)
- Corresponding author
- Fledrich, Robert
- Nave, Klaus-Armin
- Stassart, Ruth M.
- ORCID
- Bosch-Queralt, Mar
- Edgar, Julia M.
- Fleischer, Niko
- Wieghofer, Peter
- Berghoff, Stefan A.
- Reinert, Tilo
- Morawski, Markus
- Möbius, Wiebke
- Barrantes-Freer, Alonso
- Stieler, Jens
- Sun, Ting
- Saher, Gesine
- Schwab, Markus H.
- Wrede, Christoph
- Frosch, Maximilian
- Prinz, Marco
- Reich, Daniel S.
- Flügel, Alexander
- Stadelmann, Christine
- Fledrich, Robert
- Nave, Klaus-Armin
- Stassart, Ruth M.
- Venue
- Nature Neuroscience
- Published
- 2023-06-29
- Volume
- 26
- Issue
- 7
- Pages
- 1218-1228
- ISSN
- 1097-6256 (ISSN-L)
- 1546-1726
- PMC
- PMC10322724
- OpenAlex
- W4382630803
- Cited by
- 101
- References
- 58
- Citations by year
- 2026: 32 · 2025: 35 · 2024: 26 · 2023: 7
- FWCI
- 19.91
- Type
- journal article
- Language
- en
- Update notices
- addendum (2025-03-11)
- Open access
- hybrid
- doi.org
- Locations
- Nature Neuroscience (publishedVersion, cc-by)
- bioRxiv (Cold Spring Harbor Laboratory) (acceptedVersion)
- PubMed Central (publishedVersion, cc-by)
- PubMed (publishedVersion)
- ENLIGHTEN (Jurnal Bimbingan dan Konseling Islam) (acceptedVersion, cc-by-sa)
- GoeScholar The Publication Server of the Georg-August-Universität Göttingen (Georg-August-Universität Göttingen) (submittedVersion, cc-by)
- DZNE Pub (submittedVersion, cc-by)
- OPUS (Augsburg University) (submittedVersion, cc-by)
- Funders
- Dr. Miriam and Sheldon G. Adelson Medical Research Foundation
- Deutsche Forschungsgemeinschaft (SFB 1052, 209933838, TRR274/1 2020, SFB/TRR 274, TRR-274, EXC 2067, STA1389/5-1, EXC 2067‐1, 390729940, EXC 2067/1390729940, 408885537)
- Bundesministerium für Bildung und Forschung (01EJ2203C)
- Boehringer Ingelheim Stiftung
- Medical Research Council (MR/X013073/1)
- National Institute of Neurological Disorders and Stroke
- H2020 European Research Council (101021345, 948857)
- Topics
- Health Sciences › Medicine › Clinical Neurology › Multiple Sclerosis Research Studies
- Life Sciences › Neuroscience › Neurology › Neuroinflammation and Neurodegeneration Mechanisms
- Health Sciences › Medicine › Clinical Neurology › Peripheral Neuropathies and Disorders
- Keywords
- myelin, axonal degeneration, multiple sclerosis, autoimmune demyelinating disease, oligodendrocytes, myelination, autoimmune encephalomyelitis
- MeSH terms
- Animals, Axons, Encephalomyelitis, Autoimmune, Experimental, Humans, Multiple Sclerosis, Myelin Sheath, Risk Factors, Mice
About these checks
Registry, retraction, Cites and statistics results are computed, not judged, with one exception: a printed reference that no index lists is read once by a model before it counts as a citation error. Claims are extracted by a model and kept only when their quote appears verbatim in the text; each cited source is then checked, with a model’s help, for whether it says what the claim relies on. Those verdicts can be wrong — read the claim’s quote and the cited source before relying on one.
Statistics and arithmetic are recomputed, not judged.
Confidence bands are shown only for fields calibrated on our annotated test set. None is calibrated yet, so no band is shown.
What counts as a claim ›How we measure confidence ›How we check this ›
Are you an author, or do you see a problem with this page? Request a review
