

The DOI matches its Crossref record; 46 of the 46 references it cites were found in a registry or an index.
A new paradigm in sweat based wearable diagnostics biosensors using Room Temperature Ionic Liquids (RTILs)
Open accessAbstract
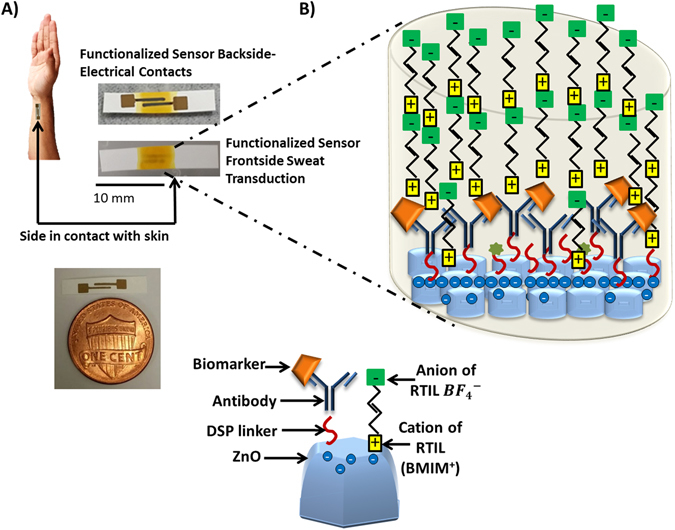
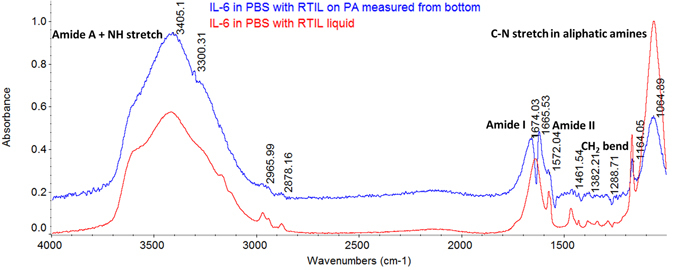
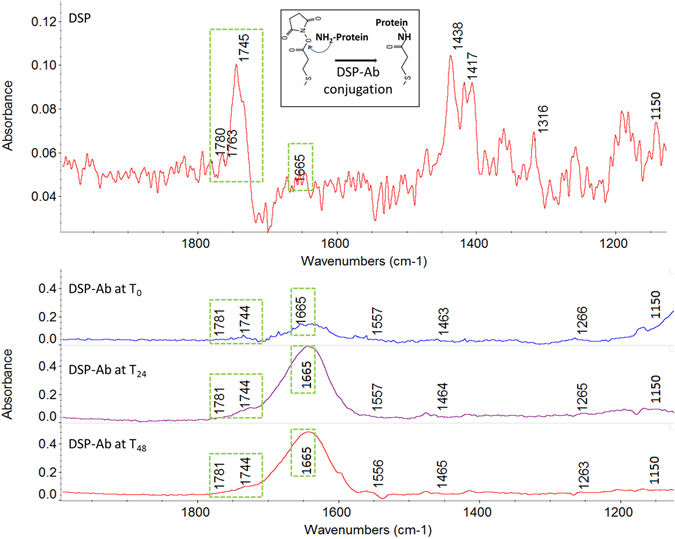
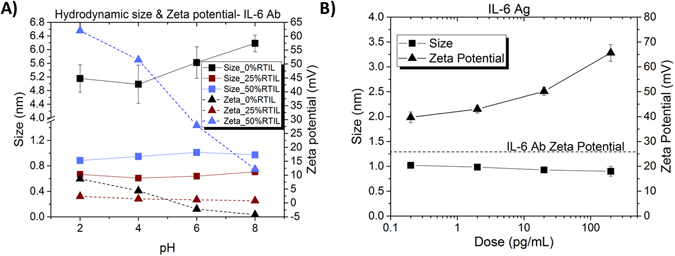
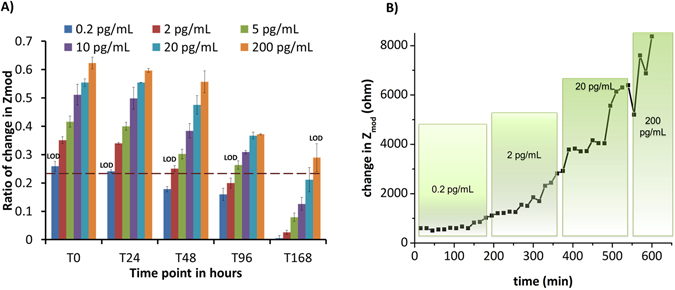
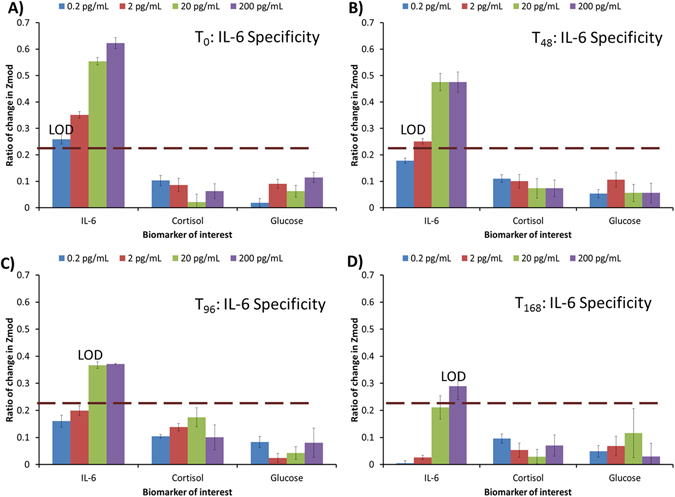
Successful commercialization of wearable diagnostic sensors necessitates stability in detection of analytes over prolonged and continuous exposure to sweat. Challenges are primarily in ensuring target disease specific small analytes (i.e. metabolites, proteins, etc.) stability in complex sweat buffer with varying pH levels and composition over time. We present a facile approach to address these challenges using RTILs with antibody functionalized sensors on nanoporous, flexible polymer membranes. Temporal studies were performed using both infrared spectroscopic, dynamic light scattering, and impedimetric spectroscopy to demonstrate stability in detection of analytes, Interleukin-6 (IL-6) and Cortisol, from human sweat in RTILs. Temporal stability in sensor performance was performed as follows: (a) detection of target analytes after 0, 24, 48, 96, and 168 hours post-antibody sensor functionalization; and (b) continuous detection of target analytes post-antibody sensor functionalization. Limit of detection of IL-6 in human sweat was 0.2 pg/mL for 0–24 hours and 2 pg/mL for 24–48 hours post-antibody sensor functionalization. Continuous detection of IL-6 over 0.2–200 pg/mL in human sweat was demonstrated for a period of 10 hours post-antibody sensor functionalization. Furthermore, combinatorial detection of IL-6 and Cortisol in human sweat was established with minimal cross-talk for 0–48 hours post-antibody sensor functionalization.
Overview
The claims and statistics of this paper haven’t been checked yet.
Run the check — free, no account needed. It reads the open-access text and checks the sources it cites.
Integrity signals
Registry
Cites
Statistics
Figures
Verification
Claims the paper makes
The claims and statistics of this paper haven’t been checked yet.
Run the check — free, no account needed. It reads the open-access text and checks the sources it cites.
Claims other papers make about this one
Each is checked against this paper’s own text: does it say what the citing paper says it does?
In the citing paper
“For instance, a wearable immunosensor for detecting cortisol and interleukin 6 (IL-6) in sweat has diagnostic potential (Fig. 3g)43.”
From Wearable biosensors for healthcare monitoring (2019) · cites this paper as [43]
Self-check
Percentages, sums and reported differences re-computed from the paper’s own numbers.
The self-check needs the paper’s full text.
Citations
Cites
Limit of blank, limit of detection and limit of quantitation.
Armbruster, D., & Pry, T. (2008) · PubMed Central · doi:10.1111/aji.13807 · Cited by 2,092
Inflammation, obesity, stress and coronary heart disease: is interleukin-6 the link?
Yudkin, J. S., Kumari, M., Humphries, S. E., & Mohamed-Ali, V. (2000) · Atherosclerosis · doi:10.1016/s0021-9150(99)00463-3 · Cited by 1,775
van Rantwijk, F., & Sheldon, R. A. (2007) · Chemical Reviews · doi:10.1021/cr050946x · Cited by 1,573
Ionic Liquids at Electrified Interfaces
Fedorov, M. V., & Kornyshev, A. A. (2014) · Chemical Reviews · doi:10.1021/cr400374x · Cited by 1,413
Bankar, S. B., Bule, M. V., Singhal, R. S., & Ananthanarayan, L. (2009) · Biotechnology Advances · doi:10.1016/j.biotechadv.2009.04.003 · Cited by 1,304
Electrochemical Tattoo Biosensors for Real-Time Noninvasive Lactate Monitoring in Human Perspiration
Jia, W., Bandodkar, A. J., Valdés-Ramírez, G., Windmiller, J. R., Yang, Z., Ramírez, J., Chan, G., & Wang, J. (2013) · Analytical Chemistry · doi:10.1021/ac401573r · Cited by 862
Recent advances in electrochemical glucose biosensors: a review
Chen, C., Xie, Q., Yang, D., Xiao, H., Fu, Y., Tan, Y., & Yao, S. (2012) · RSC Advances · doi:10.1039/c2ra22351a · Cited by 816
Analytical applications of room-temperature ionic liquids: A review of recent efforts
Pandey, S. (2005) · Analytica Chimica Acta · doi:10.1016/j.aca.2005.06.038 · Cited by 761
Sheldon, R. A., Lau, R. M., Sorgedrager, M. J., van Rantwijk, F., & Seddon, K. R. (2002) · Green Chemistry · doi:10.1039/b110008b · Cited by 737
Applications of ionic liquids in electrochemical sensors
Wei, D., & Ivaska, A. U. (2008) · Analytica Chimica Acta · doi:10.1016/j.aca.2007.12.011 · Cited by 726
Sonner, Z., Wilder, E., Heikenfeld, J., Kasting, G., Beyette, F., Swaile, D., Sherman, F., Joyce, J., Hagen, J., Kelley-Loughnane, N., et al. (2015) · Biomicrofluidics · doi:10.1063/1.4921039 · Cited by 724
Stolte, S., Matzke, M., Arning, J., Böschen, A., Pitner, W. R., Welz‐Biermann, U., Jastorff, B., & Ranke, J. (2007) · Green Chemistry · doi:10.1039/b711119c · Cited by 538
Anti-microbial activities of ionic liquids
Pernak, J., Sobaszkiewicz, K., & Mirska, I. (2002) · Green Chemistry · doi:10.1039/b207543c · Cited by 502
Ionic liquids as a class of materials for transdermal delivery and pathogen neutralization
Zakrewsky, M., Lovejoy, K. S., Kern, T. L., Miller, T. E., Le, V., Nagy, A., Goumas, A. M., Iyer, R. S., Sesto, R. E. D., Koppisch, A. T., et al. (2014) · Proceedings of the National Academy of Sciences · doi:10.1073/pnas.1403995111 · Cited by 354
A potentiometric tattoo sensor for monitoring ammonium in sweat
Guinovart, T., Bandodkar, A. J., Windmiller, J. R., Andrade, F. J., & Wang, J. (2013) · The Analyst · doi:10.1039/c3an01672b · Cited by 343
Anti-microbial activities of protic ionic liquids with lactate anion
Pernak, J., Goc, I., & Mirska, I. (2004) · Green Chemistry · doi:10.1039/b404625k · Cited by 334
Effect of ionic liquid on activity, stability, and structure of enzymes: A review
Naushad, M., ALOthman, Z. A., Khan, A. B., & Ali, M. (2012) · International Journal of Biological Macromolecules · doi:10.1016/j.ijbiomac.2012.06.020 · Cited by 327
Protein stabilization and enzyme activation in ionic liquids: specific ion effects
Zhao, H. (2015) · Journal of Chemical Technology & Biotechnology · doi:10.1002/jctb.4837 · Cited by 310
How ionic liquids can help to stabilize native proteins
Weingärtner, H., Cabrele, C., & Herrmann, C. (2011) · Physical Chemistry Chemical Physics · doi:10.1039/c1cp21947b · Cited by 291
Yuan, H., Shimotani, H., Ye, J. T., Yoon, S., Aliah, H., Tsukazaki, A., Kawasaki, M., & Iwasa, Y. (2010) · Journal of the American Chemical Society · doi:10.1021/ja108912x · Cited by 273
Recent Advances in the Applications of Ionic Liquids in Protein Stability and Activity: A Review
Patel, R., Kumari, M., & Khan, A. B. (2014) · Applied Biochemistry and Biotechnology · doi:10.1007/s12010-014-0813-6 · Cited by 267
Vgontzas, A. N., Zoumakis, M., Bixler, E. O., Lin, H.-M., Prolo, P., Vela‐Bueno, A., Kales, A., & Chrousos, G. P. (2003) · The Journal of Clinical Endocrinology & Metabolism · doi:10.1210/jc.2002-021176 · Cited by 243
Effects of different head groups and functionalised side chains on the cytotoxicity of ionic liquids
Stolte, S., Arning, J., Bottin‐Weber, U., Müller, A., Pitner, W., Welz‐Biermann, U., Jastorff, B., & Ranke, J. (2007) · Green Chemistry · doi:10.1039/b615326g · Cited by 222
Cizza, G., Marques, A. H., Eskandari, F., Christie, I. C., Torvik, S., Silverman, M. N., Phillips, T. M., & Sternberg, E. M. (2008) · Biological Psychiatry · doi:10.1016/j.biopsych.2008.05.035 · Cited by 208
Attri, P., Venkatesu, P., & Kumar, A. (2010) · Physical Chemistry Chemical Physics · doi:10.1039/c0cp01291b · Cited by 193
Munje, R. D., Muthukumar, S., & Prasad, S. (2017) · Sensors and Actuators B: Chemical · doi:10.1016/j.snb.2016.07.088 · Cited by 190
Self-citationYuan, H., Shimotani, H., Tsukazaki, A., Ohtomo, A., Kawasaki, M., & Iwasa, Y. (2010) · Journal of the American Chemical Society · doi:10.1021/ja909110s · Cited by 171
Lim, C. Y., Owens, N. A., Wampler, R. D., Ying, Y., Granger, J. H., Porter, M. D., Takahashi, M. K., & Shimazu, K. (2014) · Langmuir · doi:10.1021/la503439g · Cited by 164
Flexible nanoporous tunable electrical double layer biosensors for sweat diagnostics
Munje, R. D., Muthukumar, S., Panneer Selvam, A., & Prasad, S. (2015) · Scientific Reports · doi:10.1038/srep14586 · Cited by 138
Self-citationFunctionalizing Zn- and O-terminated ZnO with thiols
Sadik, P. W., Pearton, S. J., Norton, D. P., Lambers, E. S., & Ren, F. (2007) · Journal of Applied Physics · doi:10.1063/1.2736893 · Cited by 109
TiCxOy thin films for decorative applications: Tribocorrosion mechanisms and synergism
Mathew, M. T., Ariza, E., Rocha, L. A., Fernandes, A. C., & Vaz, F. (2008) · Tribology International · doi:10.1016/j.triboint.2007.11.011 · Cited by 101
Stabilization of enzymes in ionic liquids via modification of enzyme charge
Nordwald, E. M., & Kaar, J. L. (2013) · Biotechnology and Bioengineering · doi:10.1002/bit.24910 · Cited by 93
Analysis of Nanocrystalline ZnS Thin Films by XPS
Barreca, D., Gasparotto, A., Maragno, C., Tondello, E., & Spalding, T. R. (2002) · Surface Science Spectra · doi:10.1116/11.20030117 · Cited by 76
Izawa, S., Sugaya, N., Kimura, K., Ogawa, N., Yamada, K. C., Shirotsuki, K., Mikami, I., Hirata, K., Nagano, Y., & Nomura, S. (2013) · Biological Psychology · doi:10.1016/j.biopsycho.2013.06.006 · Cited by 75
Human perspiration measurement
Ohhashi, T., Sakaguchi, M., & Tsuda, T. (1998) · Physiological Measurement · doi:10.1088/0967-3334/19/4/001 · Cited by 68
Wan, L., Chen, Q., Liu, J., Yang, X., Huang, J. L., Li, L., Guo, X. W., Zhang, J., & Wang, K. (2016) · Biomacromolecules · doi:10.1021/acs.biomac.6b00233 · Cited by 65
Label-free electronic detection of interleukin-6 using horizontally aligned carbon nanotubes
Chen, H., Choo, T. K., Huang, J., Wang, Y., Liu, Y., Platt, M., Palaniappan, A., Liedberg, B., & Tok, A. I. Y. (2015) · Materials & Design · doi:10.1016/j.matdes.2015.11.029 · Cited by 61
Label free nano-aptasensor for interleukin-6 in protein-dilute bio fluids such as sweat
Kumar, L. S. S., Wang, X., Hagen, J., Naik, R., Papautsky, I., & Heikenfeld, J. (2016) · Analytical Methods · doi:10.1039/c6ay00331a · Cited by 59
The international standard for interleukin-6
Das, R., & Poole, S. (1993) · Journal of Immunological Methods · doi:10.1016/0022-1759(93)90172-4 · Cited by 51
Room-temperature ionic liquid-based electrochemical nanobiosensors
Hasanzadeh, M., Shadjou, N., Eskandani, M., & de la Guárdia, M. (2012) · TrAC Trends in Analytical Chemistry · doi:10.1016/j.trac.2012.09.005 · Cited by 49
Benedetto, A., & Ballone, P. (2015) · The Philosophical Magazine A Journal of Theoretical Experimental and Applied Physics · doi:10.1080/14786435.2015.1119323 · Cited by 48
Xie, Y., Wang, S., Zhang, Z., & Pang, D. (2008) · The Journal of Physical Chemistry B · doi:10.1021/jp803655t · Cited by 43
Imidazolium-Based Ionic Liquid Surfaces for Biosensing
Ratel, M., PROVENCHER-GIRARD, A., Zhao, S. S., Breault-Turcot, J., Labrecque-Carbonneau, J., Branca, M., Pelletier, J. N., Schmitzer, A. R., & Masson, J. (2013) · Analytical Chemistry · doi:10.1021/ac400386z · Cited by 43
Yamada, N., Suzuki, E., & Hirayama, K. (2002) · Rapid Communications in Mass Spectrometry · doi:10.1002/rcm.579 · Cited by 42
Enhanced stability of the model mini‐protein in amino acid ionic liquids and their aqueous solutions
Chevrot, G., Fileti, E. E., & Chaban, V. V. (2015) · Journal of Computational Chemistry · doi:10.1002/jcc.24042 · Cited by 42
Molecularly “Wired” Cholesterol Oxidase for Biosensing
Leonida, M. D., & Aurian‐Blajeni, B. (2015) · The Protein Journal · doi:10.1007/s10930-015-9599-9 · Cited by 6
Cited by
Sorted by citations
Wearable biosensors for healthcare monitoring
Kim, J., Campbell, A. S., de Ávila, B. E.-F., & Wang, J. (2019) · Nature Biotechnology · doi:10.1038/s41587-019-0045-y · Cited by 3,373
Wearable and flexible electrochemical sensors for sweat analysis: a review
Gao, F., Liu, C., Zhang, L., Liu, T., Wang, Z., Song, Z., Cai, H., Fang, Z., Chen, J., Wang, J., et al. (2022) · Microsystems & Nanoengineering · doi:10.1038/s41378-022-00443-6 · Cited by 854
Skin-Interfaced Wearable Sweat Sensors for Precision Medicine
Min, J., Tu, J., Xu, C., Lukas, H., Shin, S., Yang, Y., Solomon, S. A., Mukasa, D., & Gao, W. F. (2023) · Chemical Reviews · doi:10.1021/acs.chemrev.2c00823 · Cited by 752
Reviews of wearable healthcare systems: Materials, devices and system integration
Lou, Z., Wang, L., Jiang, K., Wei, Z., & Shen, G. (2019) · Materials Science and Engineering R Reports · doi:10.1016/j.mser.2019.100523 · Cited by 391
Vo, D.-K., & Trinh, K. T. L. (2024) · Biosensors · doi:10.3390/bios14110560 · Cited by 275
Metadata
- Authors
- Munje, R. D., Muthukumar, S., Jagannath, B., & Prasad, S.
- Affiliations
- The University of Texas at Dallas (US)
- Corresponding author
- Prasad, Shalini
- Venue
- Scientific Reports
- Published
- 2017-05-16
- Volume
- 7
- Issue
- 1
- Pages
- 1950-1950
- ISSN
- 2045-2322 (ISSN-L)
- PMC
- PMC5434046
- OpenAlex
- W2612250156
- Cited by
- 149
- References
- 46
- Citations by year
- 2026: 13 · 2025: 16 · 2024: 24 · 2023: 16 · 2022: 23 · 2021: 19 · 2020: 12 · 2019: 12 · 2018: 12 · 2017: 2
- FWCI
- 4.32
- Type
- journal article
- Language
- en
- Open access
- gold
- doi.org
- Locations
- Scientific Reports (publishedVersion, cc-by)
- Europe PMC (PubMed Central) (publishedVersion, cc-by)
- PubMed Central (publishedVersion, cc-by)
- PubMed (publishedVersion)
- DOAJ (DOAJ: Directory of Open Access Journals) (submittedVersion, cc-by-sa)
- Topics
- Physical Sciences › Chemistry › Analytical Chemistry › Electrochemical sensors and biosensors
- Physical Sciences › Chemistry › Physical and Theoretical Chemistry › Ionic liquids properties and applications
- Physical Sciences › Engineering › Biomedical Engineering › Advanced Sensor and Energy Harvesting Materials
- Keywords
- wearable diagnostics, room temperature ionic liquids, interleukin-6 detection, cortisol detection, nanoporous membranes, sensor stability
- MeSH terms
- Dynamic Light Scattering, Wearable Electronic Devices, Humans, Hydrocortisone, Nylons, Sweat, Temperature, Zinc Oxide, Biosensing Techniques, Porosity, Spectroscopy, Fourier Transform Infrared, Ionic Liquids
About these checks
Registry, retraction, Cites and statistics results are computed, not judged, with one exception: a printed reference that no index lists is read once by a model before it counts as a citation error. Claims are extracted by a model and kept only when their quote appears verbatim in the text; each cited source is then checked, with a model’s help, for whether it says what the claim relies on. Those verdicts can be wrong — read the claim’s quote and the cited source before relying on one.
Statistics and arithmetic are recomputed, not judged.
Confidence bands are shown only for fields calibrated on our annotated test set. None is calibrated yet, so no band is shown.
What counts as a claim ›How we measure confidence ›How we check this ›
Are you an author, or do you see a problem with this page? Request a review
