

The DOI matches its Crossref record; 10 of the 10 references it cites were found in a registry or an index.
Cerebrospinal fluid microRNAs are potential biomarkers of temporal lobe epilepsy and status epilepticus
Abstract
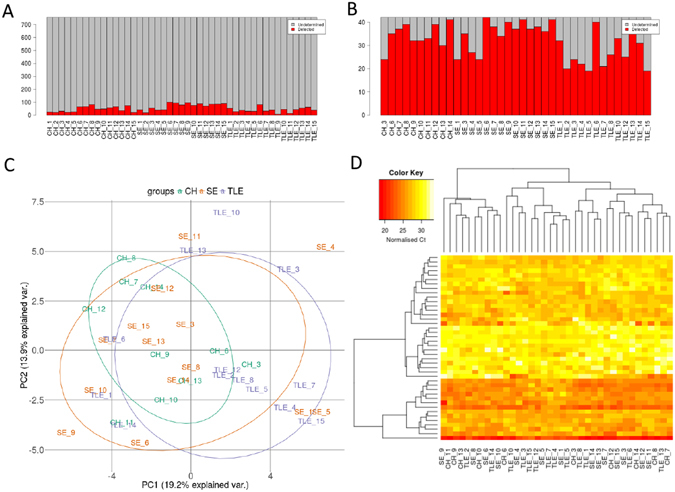
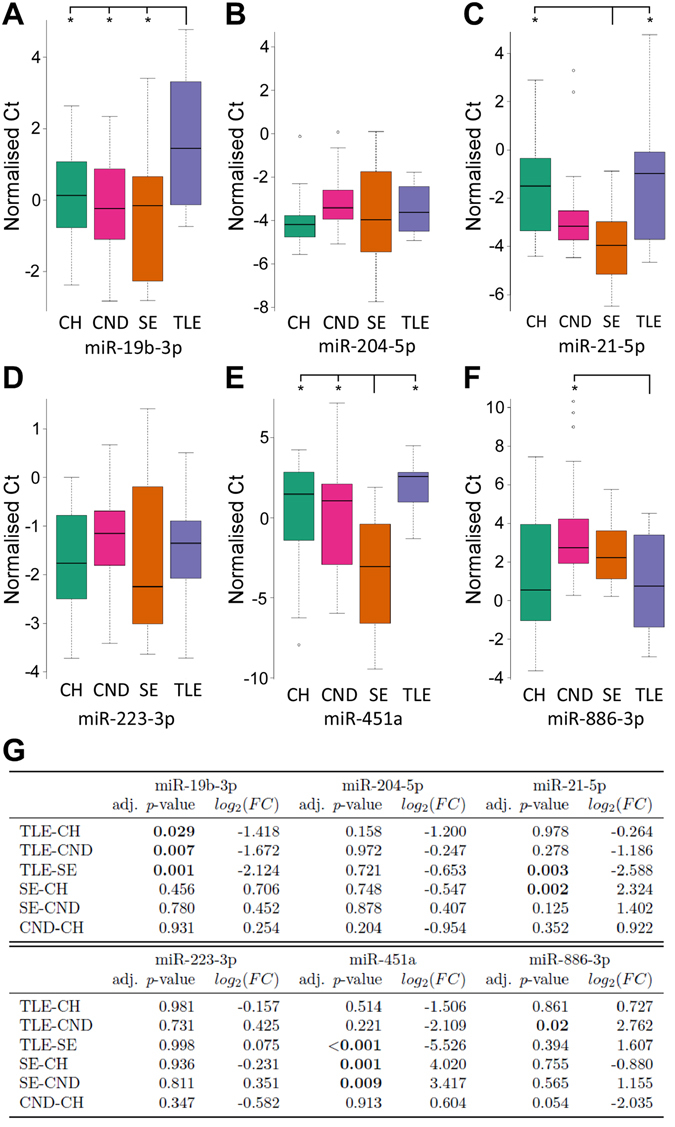
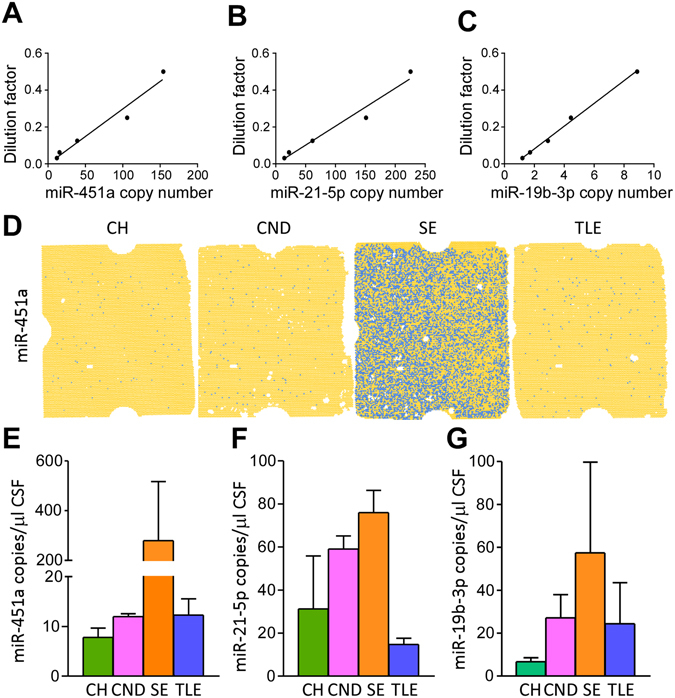
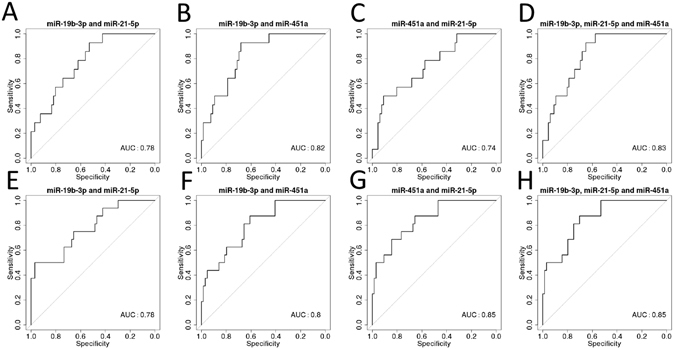
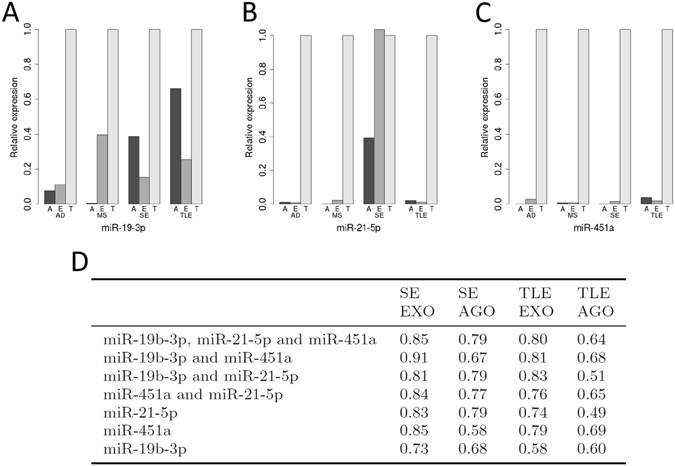
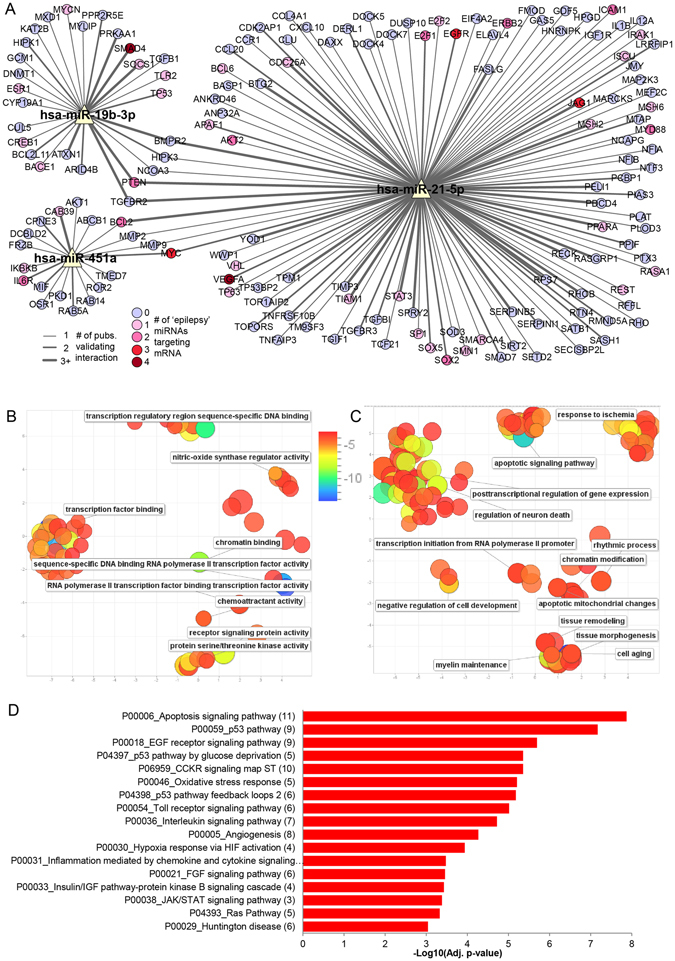
There is a need for diagnostic biomarkers of epilepsy and status epilepticus to support clinical examination, electroencephalography and neuroimaging. Extracellular microRNAs may be potentially ideal biomarkers since some are expressed uniquely within specific brain regions and cell types. Cerebrospinal fluid offers a source of microRNA biomarkers with the advantage of being in close contact with the target tissue and sites of pathology. Here we profiled microRNA levels in cerebrospinal fluid from patients with temporal lobe epilepsy or status epilepticus, and compared findings to matched controls. Differential expression of 20 microRNAs was detected between patient groups and controls. A validation phase included an expanded cohort and samples from patients with other neurological diseases. This identified lower levels of miR-19b in temporal lobe epilepsy compared to controls, status epilepticus and other neurological diseases. Levels of miR-451a were higher in status epilepticus compared to other groups whereas miR-21-5p differed in status epilepticus compared to temporal lobe epilepsy but not to other neurological diseases. Targets of these microRNAs include proteins regulating neuronal death, tissue remodelling, gliosis and inflammation. The present study indicates cerebrospinal fluid contains microRNAs that can support differential diagnosis of temporal lobe epilepsy and status epilepticus from other neurological and non-neurological diseases.
Overview
The claims and statistics of this paper haven’t been checked yet.
Run the check — free, no account needed. It reads the open-access text and checks the sources it cites.
Integrity signals
Registry
Cites
Statistics
Figures
Verification
Claims the paper makes
The claims and statistics of this paper haven’t been checked yet.
Run the check — free, no account needed. It reads the open-access text and checks the sources it cites.
Claims other papers make about this one
Each is checked against this paper’s own text: does it say what the citing paper says it does?
In the citing paper
“AGO-bound miRNAs represent a major pool of circulating miRNAs (Arroyo et al., 2011), and measuring AGO-bound miRNAs may enhance the ability to distinguish brain disease subtypes (Raoof et al., 2017), and identify post-seizure from baseline samples in plasma from epilepsy patients (Raoof et al., 2018).”
From Brain cell-specific origin of circulating microRNA biomarkers in experimental temporal lobe epilepsy (2023) · cites this paper as Raoof et al., 2017
In the citing paper
“Clinical studies have identified circulating miRNA biomarkers of epilepsy in CSF (Raoof et al., 2017) and blood (serum and plasma) (Wang et al., 2015; Enright et al., 2018; Raoof et al., 2018; Brennan et al., 2020; Ioriatti et al., 2020).”
From Brain cell-specific origin of circulating microRNA biomarkers in experimental temporal lobe epilepsy (2023) · cites this paper as Raoof et al., 2017
In the citing paper
“Elevated levels of miR-19b have been reported in the cerebrospinal fluid of TLE and SE patients (Raoof et al., 2017) with functional studies indicating miR-19b controls glial signalling (Kalozoumi et al., 2018).”
From Brain cell-specific origin of circulating microRNA biomarkers in experimental temporal lobe epilepsy (2023) · cites this paper as Raoof et al., 2017
Self-check
Percentages, sums and reported differences re-computed from the paper’s own numbers.
The self-check needs the paper’s full text.
Citations
Cites
pROC: an open-source package for R and S+ to analyze and compare ROC curves
Robin, X., Turck, N., Hainard, A., Tiberti, N., Lisacek, F., Sanchez, J.-C., & Müller, M. (2011) · BMC Bioinformatics · doi:10.1186/1471-2105-12-77 · Cited by 13,697
Adjusting batch effects in microarray expression data using empirical Bayes methods
Johnson, W. E., Li, C., & Rabinovic, A. (2007) · Biostatistics · doi:10.1093/biostatistics/kxj037 · Cited by 8,658
REVIGO summarizes and visualizes long lists of gene ontology terms
Supek, F., Bošnjak, M., Škunca, N., & Šmuc, T. (2011) · PLoS ONE · doi:10.1371/journal.pone.0021800 · Cited by 6,264
A Mammalian microRNA Expression Atlas Based on Small RNA Library Sequencing
Landgraf, P., Rusu, M., Sheridan, R., Sewer, A., Iovino, N., Aravin, A., Pfeffer, S., Rice, A., Kamphorst, A. O., Landthaler, M., et al. (2007) · Cell · doi:10.1016/j.cell.2007.04.040 · Cited by 3,626
Identification of a unique TGF-β–dependent molecular and functional signature in microglia
Butovsky, O., Jedrychowski, M. P., Moore, C. S., Cialic, R., Lanser, A. J., Gabriely, G., Koeglsperger, T., Dake, B., Wu, P. M., Doykan, C. E., et al. (2014) · Nature Neuroscience · doi:10.1038/nn.3599 · Cited by 2,543
Misdiagnosis of epilepsy: many seizure-like attacks have a cardiovascular cause
Zaidi, A., Clough, P., Cooper, P., Scheepers, B., & Fitzpatrick, A. P. (2000) · Journal of the American College of Cardiology · doi:10.1016/s0735-1097(00)00700-2 · Cited by 422
Jovičić, A., Roshan, R., Moisoi, N., Pradervand, S., Moser, R., Pillai, B., & Luthi-Carter, R. (2013) · The Journal of Neuroscience · doi:10.1523/jneurosci.0600-12.2013 · Cited by 251
MicroRNA‐21 protects neurons from ischemic death
Buller, B., Liu, X., Wang, X., Zhang, R. L., Zhang, L., Hozeska‐Solgot, A., Chopp, M., & Zhang, Z. G. (2010) · The FEBS Journal · doi:10.1111/j.1742-4658.2010.07818.x · Cited by 242
Petkar, S., Hamid, T., Iddon, P., Clifford, A., Rice, N., Claire, R., McKee, D., Curtis, N., Cooper, P. N., & Fitzpatrick, A. P. (2012) · Europace · doi:10.1093/europace/eus185 · Cited by 60
Molecular biomarkers of epileptogenesis
Pitkänen, A., & Lukasiuk, K. (2011) · Biomarkers in Medicine · doi:10.2217/bmm.11.67 · Cited by 40
Research works printed but not linked: 86
- Chang, B. S. & Lowenstein, D. H. Epilepsy. N Engl J Med 349, 1257–1266, doi:10.1056/NEJMra022308 (2003). · DOI
- Knake, S. et al. Incidence of status epilepticus in adults in Germany: a prospective, population-based study. Epilepsia 42, 714–718, doi:10.1046/j.1528-1157.2001.01101.x (2001). · DOI
- Trinka, E. et al. A definition and classification of status epilepticus–Report of the ILAE Task Force on Classification of Status Epilepticus. Epilepsia 56, 1515–1523, doi:10.1111/epi.13121 (2015). · DOI · Paper page
- van Donselaar, C. A., Stroink, H. & Arts, W. F., Dutch Study Group of Epilepsy in, C.. How confident are we of the diagnosis of epilepsy? Epilepsia 47(Suppl 1), 9–13, doi:10.1111/epi.2006.47.issue-s1 (2006). · DOI
- Meierkord, H. & Holtkamp, M. Non-convulsive status epilepticus in adults: clinical forms and treatment. Lancet Neurol 6, 329–339, doi:10.1016/S1474-4422(07)70074-1 (2007). · DOI
- Bauer, G. & Trinka, E. Nonconvulsive status epilepticus and coma. Epilepsia 51, 177–190, doi:10.1111/j.1528-1167.2009.02297.x (2010). · DOI
- Shavit, L., Grenader, T. & Galperin, I. Nonconvulsive status epilepticus in elderly a possible diagnostic pitfall. Eur J Intern Med 23, 701–704, doi:10.1016/j.ejim.2012.06.015 (2012). · DOI
- Hegde, M. & Lowenstein, D. H. The search for circulating epilepsy biomarkers. Biomark Med 8, 413–427, doi:10.2217/bmm.13.142 (2014). · DOI
- Pitkanen, A. et al. Advances in the development of biomarkers for epilepsy. Lancet Neurol 15, 843–856, doi:10.1016/S1474-4422(16)00112-5 (2016). · DOI
- Bartel, D. P. MicroRNAs: genomics, biogenesis, mechanism, and function. Cell 116, 281–297, doi:10.1016/S0092-8674(04)00045-5 (2004). · DOI
- Czech, B. & Hannon, G. J. Small RNA sorting: matchmaking for Argonautes. Nat Rev Genet 12, 19–31, doi:10.1038/nrg2916 (2011). · DOI · Paper page
- Chen, X. et al. Characterization of microRNAs in serum: a novel class of biomarkers for diagnosis of cancer and other diseases. Cell Res 18, 997–1006, doi:10.1038/cr.2008.282 (2008). · DOI · Paper page
- Mitchell, P. S. et al. Circulating microRNAs as stable blood-based markers for cancer detection. Proc Natl Acad Sci USA 105, 10513–10518, doi:10.1073/pnas.0804549105 (2008). · DOI · Paper page
- Valadi, H. et al. Exosome-mediated transfer of mRNAs and microRNAs is a novel mechanism of genetic exchange between cells. Nat Cell Biol 9, 654–659, doi:10.1038/ncb1596 (2007). · DOI · Paper page
- Hunter, M. P. et al. Detection of microRNA expression in human peripheral blood microvesicles. PLoS One 3, e3694, doi:10.1371/journal.pone.0003694 (2008). · DOI
- Arroyo, J. D. et al. Argonaute2 complexes carry a population of circulating microRNAs independent of vesicles in human plasma. Proc Natl Acad Sci USA 108, 5003–5008, doi:10.1073/pnas.1019055108 (2011). · DOI · Paper page
- Gallo, A., Tandon, M., Alevizos, I. & Illei, G. G. The majority of microRNAs detectable in serum and saliva is concentrated in exosomes. PLoS One 7, e30679, doi:10.1371/journal.pone.0030679 (2012). · DOI · Paper page
- Gallego, J. A. et al. In vivo microRNA detection and quantitation in cerebrospinal fluid. J Mol Neurosci 47, 243–248, doi:10.1007/s12031-012-9731-7 (2012). · DOI
- Mooney, C., Becker, B. A., Raoof, R. & Henshall, D. C. EpimiRBase: a comprehensive database of microRNA-epilepsy associations. Bioinformatics 32, 1436–1438, doi:10.1093/bioinformatics/btw008 (2016). · DOI
- Henshall, D. C. et al. MicroRNAs in epilepsy: pathophysiology and clinical utility. Lancet Neurol 15, 1368–1376, doi:10.1016/S1474-4422(16)30246-0 (2016). · DOI
- Liu, D. Z. et al. Brain and blood microRNA expression profiling of ischemic stroke, intracerebral hemorrhage, and kainate seizures. J Cereb Blood Flow Metab 30, 92–101, doi:10.1038/jcbfm.2009.186 (2010). · DOI
- Gorter, J. A. et al. Hippocampal subregion-specific microRNA expression during epileptogenesis in experimental temporal lobe epilepsy. Neurobiol Dis 62, 508–520, doi:10.1016/j.nbd.2013.10.026 (2014). · DOI · Paper page
- Roncon, P. et al. MicroRNA profiles in hippocampal granule cells and plasma of rats with pilocarpine-induced epilepsy - comparison with human epileptic samples. Sci Rep 5, 14143, doi:10.1038/srep14143 (2015). · DOI · Paper page
- Wang, J. et al. Circulating microRNAs are promising novel biomarkers for drug-resistant epilepsy. Sci Rep 5, 10201, doi:10.1038/srep10201 (2015). · DOI
- Wang, J. et al. Genome-wide circulating microRNA expression profiling indicates biomarkers for epilepsy. Sci Rep 5, 9522, doi:10.1038/srep09522 (2015). · DOI · Paper page
- Baraniskin, A. et al. Identification of microRNAs in the cerebrospinal fluid as marker for primary diffuse large B-cell lymphoma of the central nervous system. Blood 117, 3140–3146, doi:10.1182/blood-2010-09-308684 (2011). · DOI
- Muller, M., Kuiperij, H. B., Claassen, J. A., Kusters, B. & Verbeek, M. M. MicroRNAs in Alzheimer’s disease: differential expression in hippocampus and cell-free cerebrospinal fluid. Neurobiol Aging 35, 152–158, doi:10.1016/j.neurobiolaging.2013.07.005 (2014). · DOI · Paper page
- Haghikia, A. et al. Regulated microRNAs in the CSF of patients with multiple sclerosis: a case-control study. Neurology 79, 2166–2170, doi:10.1212/WNL.0b013e3182759621 (2012). · DOI
- Cheng, H. H. et al. Plasma processing conditions substantially influence circulating microRNA biomarker levels. PLoS One 8, e64795, doi:10.1371/journal.pone.0064795 (2013). · DOI · Paper page
- Kirschner, M. B. et al. Haemolysis during sample preparation alters microRNA content of plasma. PLoS One 6, e24145, doi:10.1371/journal.pone.0024145 (2011). · DOI · Paper page
- Mooney, C. et al. High throughput qPCR expression profiling of circulating microRNAs reveals minimal sex- and sample timing-related variation in plasma of healthy volunteers. PLoS One 10, e0145316, doi:10.1371/journal.pone.0145316 (2015). · DOI
- Jimenez-Mateos, E. M. et al. Silencing microRNA-134 produces neuroprotective and prolonged seizure-suppressive effects. Nat Med 18, 1087–1094, doi:10.1038/nm.2834 (2012). · DOI
- Spain, E. et al. Direct, non-amplified detection of microRNA-134 in plasma from epilepsy patients. RSC Advances 5, 90071–90078, doi:10.1039/C5RA16352H (2015). · DOI
- Lobb, R. J. et al. Optimized exosome isolation protocol for cell culture supernatant and human plasma. J Extracell Vesicles 4, 27031, doi:10.3402/jev.v4.27031 (2015). · DOI
- Chou, C. H. et al. miRTarBase 2016: updates to the experimentally validated miRNA-target interactions database. Nucleic Acids Res 44, D239–247, doi:10.1093/nar/gkv1258 (2016). · DOI
- Shannon, P. et al. Cytoscape: a software environment for integrated models of biomolecular interaction networks. Genome Res 13, 2498–2504, doi:10.1101/gr.1239303 (2003). · DOI · Paper page
- Kuleshov, M. V. et al. Enrichr: a comprehensive gene set enrichment analysis web server 2016 update. Nucleic Acids Res 44, W90–97, doi:10.1093/nar/gkw377 (2016). · DOI · Paper page
- Mi, H., Poudel, S., Muruganujan, A., Casagrande, J. T. & Thomas, P. D. PANTHER version 10: expanded protein families and functions, and analysis tools. Nucleic Acids Res 44, D336–342, doi:10.1093/nar/gkv1194 (2016). · DOI · Paper page
- Gross, C. et al. MicroRNA-mediated downregulation of the potassium channel Kv4.2 contributes to seizure onset. Cell Rep 17, 37–45, doi:10.1016/j.celrep.2016.08.074 (2016). · DOI
- Tan, N. C. & Berkovic, S. F. The Epilepsy Genetic Association Database (epiGAD): analysis of 165 genetic association studies, 1996-2008. Epilepsia 51, 686–689, doi:10.1111/j.1528-1167.2009.02423.x (2010). · DOI
- Huber, W. et al. Orchestrating high-throughput genomic analysis with Bioconductor. Nat Methods 12, 115–121, doi:10.1038/nmeth.3252 (2015). · DOI
- McCall, M. N., McMurray, H. R., Land, H. & Almudevar, A. On non-detects in qPCR data. Bioinformatics 30, 2310–2316, doi:10.1093/bioinformatics/btu239 (2014). · DOI
- Dvinge, H. & Bertone, P. HTqPCR: high-throughput analysis and visualization of quantitative real-time PCR data in R. Bioinformatics 25, 3325–3326, doi:10.1093/bioinformatics/btp578 (2009). · DOI
- Ritchie, M. E. et al. Limma powers differential expression analyses for RNA-sequencing and microarray studies. Nucleic Acids Res 43, e47–e47, doi:10.1093/nar/gkv007 (2015). · DOI · Paper page
- Benjamini, Y. & Hochberg, Y. Controlling the false discovery rate: a practical and powerful approach to multiple testing. J Royal Stat Soc Series B (Methodological) 57, 289–300 (1995). · DOI · Paper page
- Haunsberger, S. J., Connolly, N. M. & Prehn, J. H. miRNAmeConverter: an R/Bioconductor package for translating mature miRNA names to different miRBase versions. Bioinformatics (2016). · DOI
- Pitkanen, A. & Lukasiuk, K. Mechanisms of epileptogenesis and potential treatment targets. Lancet Neurol 10, 173–186, doi:10.1016/S1474-4422(10)70310-0 (2011). · DOI
- Shinoda, S. et al. Bim regulation may determine hippocampal vulnerability after injurious seizures and in temporal lobe epilepsy. J Clin Invest 113, 1059–1068, doi:10.1172/JCI200419971 (2004). · DOI
- Engel, T., Murphy, B. M., Schindler, C. K. & Henshall, D. C. Elevated p53 and lower MDM2 expression in hippocampus from patients with intractable temporal lobe epilepsy. Epilepsy Res 77, 151–156, doi:10.1016/j.eplepsyres.2007.09.001 (2007). · DOI
- Miller-Delaney, S. F. et al. Differential DNA methylation profiles of coding and non-coding genes define hippocampal sclerosis in human temporal lobe epilepsy. Brain 138, 616–631, doi:10.1093/brain/awu373 (2015). · DOI
- McClelland, S. et al. The transcription factor NRSF contributes to epileptogenesis by selective repression of a subset of target genes. Elife 3, e01267, doi:10.7554/eLife.01267 (2014). · DOI
- Henshall, D. C. et al. Formation of the Apaf-1/cytochrome c complex precedes activation of caspase-9 during seizure-induced neuronal death. Cell Death Differ 8, 1169–1181, doi:10.1038/sj.cdd.4400921 (2001). · DOI
- Maroso, M. et al. Toll-like receptor 4 and high-mobility group box-1 are involved in ictogenesis and can be targeted to reduce seizures. Nat Med 16, 413–419, doi:10.1038/nm.2127 (2010). · DOI
- Aronica, E. et al. Expression and cellular distribution of multidrug transporter proteins in two major causes of medically intractable epilepsy: focal cortical dysplasia and glioneuronal tumors. Neuroscience 118, 417–429, doi:10.1016/S0306-4522(02)00992-2 (2003). · DOI
- Henshall, D. C. et al. Activation of Bcl-2-associated death protein and counter-response of Akt within cell populations during seizure-induced neuronal death. J Neurosci 22, 8458–8465 (2002). · DOI
- Henshall, D. C. et al. Alterations in bcl-2 and caspase gene family protein expression in human temporal lobe epilepsy. Neurology 55, 250–257, doi:10.1212/WNL.55.2.250 (2000). · DOI
- Jeffries, C. D. et al. Insights into psychosis risk from leukocyte microRNA expression. Transl Psychiatry 6, e981, doi:10.1038/tp.2016.148 (2016). · DOI
- Pritchard, C. C., Cheng, H. H. & Tewari, M. MicroRNA profiling: approaches and considerations. Nat Rev Genet 13, 358–369, doi:10.1038/nrg3198 (2012). · DOI · Paper page
- Fromm, B. et al. A uniform system for the annotation of vertebrate microRNA genes and the evolution of the human microRNAome. Annu Rev Genet 49, 213–242, doi:10.1146/annurev-genet-120213-092023 (2015). · DOI
- Mestdagh, P. et al. Evaluation of quantitative miRNA expression platforms in the microRNA quality control (miRQC) study. Nat Methods 11, 809–815, doi:10.1038/nmeth.3014 (2014). · DOI · Paper page
- Burgos, K. L. et al. Identification of extracellular miRNA in human cerebrospinal fluid by next-generation sequencing. RNA 19, 712–722, doi:10.1261/rna.036863.112 (2013). · DOI
- Holm, A. et al. MiRNA profiles in cerebrospinal fluid from patients with central hypersomnias. J Neurol Sci 347, 199–204, doi:10.1016/j.jns.2014.09.047 (2014). · DOI
- Sorensen, S. S., Nygaard, A. B. & Christensen, T. miRNA expression profiles in cerebrospinal fluid and blood of patients with Alzheimer’s disease and other types of dementia - an exploratory study. Transl Neurodegener 5, 6, doi:10.1186/s40035-016-0053-5 (2016). · DOI
- Freischmidt, A., Muller, K., Ludolph, A. C. & Weishaupt, J. H. Systemic dysregulation of TDP-43 binding microRNAs in amyotrophic lateral sclerosis. Acta Neuropathol Commun 1, 42, doi:10.1186/2051-5960-1-42 (2013). · DOI
- Liu, C. G., Wang, J. L., Li, L. & Wang, P. C. MicroRNA-384 regulates both amyloid precursor protein and beta-secretase expression and is a potential biomarker for Alzheimer’s disease. Int J Mol Med 34, 160–166, doi:10.3892/ijmm.2014.1780 (2014). · DOI
- Ahlbrecht, J. et al. Deregulation of microRNA-181c in cerebrospinal fluid of patients with clinically isolated syndrome is associated with early conversion to relapsing-remitting multiple sclerosis. Mult Scler 22, 1202–1214, doi:10.1177/1352458515613641 (2016). · DOI
- Teplyuk, N. M. et al. MicroRNAs in cerebrospinal fluid identify glioblastoma and metastatic brain cancers and reflect disease activity. Neuro Oncol 14, 689–700, doi:10.1093/neuonc/nos074 (2012). · DOI
- Truettner, J. S., Alonso, O. F., Bramlett, H. M. & Dietrich, W. D. Therapeutic hypothermia alters microRNA responses to traumatic brain injury in rats. J Cereb Blood Flow Metab 31, 1897–1907, doi:10.1038/jcbfm.2011.33 (2011). · DOI
- Lee, S. T. et al. Inhibition of miR-203 reduces spontaneous recurrent seizures in mice. Mol Neurobiol (2016). · DOI
- Azzouzi, I. et al. Deep sequencing and proteomic analysis of the microRNA-induced silencing complex in human red blood cells. Exp Hematol 43, 382–392, doi:10.1016/j.exphem.2015.01.007 (2015). · DOI · Paper page
- Ivens, S. et al. TGF-beta receptor-mediated albumin uptake into astrocytes is involved in neocortical epileptogenesis. Brain 130, 535–547, doi:10.1093/brain/awl317 (2007). · DOI · Paper page
- Liou, A. K. F., Clark, R. S., Henshall, D. C., Yin, X. M. & Chen, J. To die or not to die for neurons in ischemia, traumatic brain injury and epilepsy: a review on the stress-activated signaling pathways and apoptotic pathways. Prog Neurobiol 69, 103–142, doi:10.1016/S0301-0082(03)00005-4 (2003). · DOI
- Pitkanen, A., Roivainen, R. & Lukasiuk, K. Development of epilepsy after ischaemic stroke. Lancet Neurol 15, 185–197, doi:10.1016/S1474-4422(15)00248-3 (2016). · DOI
- Mishra, M. K. & Yong, V. W. Myeloid cells - targets of medication in multiple sclerosis. Nat Rev Neurol 12, 539–551, doi:10.1038/nrneurol.2016.110 (2016). · DOI
- Perry, V. H., Nicoll, J. A. & Holmes, C. Microglia in neurodegenerative disease. Nat Rev Neurol 6, 193–201, doi:10.1038/nrneurol.2010.17 (2010). · DOI · Paper page
- Lagos-Quintana, M. et al. Identification of tissue-specific microRNAs from mouse. Curr Biol 12, 735–739, doi:10.1016/S0960-9822(02)00809-6 (2002). · DOI · Paper page
- Kan, A. A. et al. Genome-wide microRNA profiling of human temporal lobe epilepsy identifies modulators of the immune response. Cell Mol Life Sci 69, 3127–3145, doi:10.1007/s00018-012-0992-7 (2012). · DOI
- Kaalund, S. S. et al. Aberrant expression of miR-218 and miR-204 in human mesial temporal lobe epilepsy and hippocampal sclerosis-convergence on axonal guidance. Epilepsia 55, 2017–2027, doi:10.1111/epi.12839 (2014). · DOI
- Bot, A. M., Debski, K. J. & Lukasiuk, K. Alterations in miRNA levels in the dentate gyrus in epileptic rats. PLoS One 8, e76051, doi:10.1371/journal.pone.0076051 (2013). · DOI
- Peng, J. et al. Expression Patterns of miR-124, miR-134, miR-132, and miR-21 in an immature rat model and children with mesial temporal lobe epilepsy. J Mol Neurosci 50, 291–297, doi:10.1007/s12031-013-9953-3 (2013). · DOI
- Risbud, R. M. & Porter, B. E. Changes in microRNA expression in the whole hippocampus and hippocampal synaptoneurosome fraction following pilocarpine induced status epilepticus. PLoS One 8, e53464, doi:10.1371/journal.pone.0053464 (2013). · DOI · Paper page
- Jimenez-Mateos, E. M. et al. miRNA Expression profile after status epilepticus and hippocampal neuroprotection by targeting miR-132. Am J Pathol 179, 2519–2532, doi:10.1016/j.ajpath.2011.07.036 (2011). · DOI
- Kretschmann, A. et al. Different microRNA profiles in chronic epilepsy versus acute seizure mouse models. J Mol Neurosci 55, 466–479, doi:10.1007/s12031-014-0368-6 (2015). · DOI
- Godard, P. & van Eyll, J. Pathway analysis from lists of microRNAs: common pitfalls and alternative strategy. Nucleic Acids Res 43, 3490–3497, doi:10.1093/nar/gkv249 (2015). · DOI
- Bleazard, T., Lamb, J. A. & Griffiths-Jones, S. Bias in microRNA functional enrichment analysis. Bioinformatics 31, 1592–1598, doi:10.1093/bioinformatics/btv023 (2015). · DOI
- Qureshi, I. A. & Mehler, M. F. Emerging roles of non-coding RNAs in brain evolution, development, plasticity and disease. Nat Rev Neurosci 13, 528–541, doi:10.1038/nrn3234 (2012). · DOI
Cited by
Sorted by citations
Recent Advances on Extracellular Vesicles in Central Nervous System Diseases
Jin, T., Gu, J., Li, Z., Xu, Z., & Gui, Y. (2021) · Clinical Interventions in Aging · doi:10.2147/cia.s288415 · Cited by 44
Brain cell-specific origin of circulating microRNA biomarkers in experimental temporal lobe epilepsy
Brindley, E., Heiland, M., Mooney, C., Diviney, M., Mamad, O., Hill, T. D. M., Yan, Y., Venø, M. T., Reschke, C. R., Batool, A., et al. (2023) · Frontiers in Molecular Neuroscience · doi:10.3389/fnmol.2023.1230942 · Cited by 21
Self-citation
Metadata
- Authors
- Raoof, R., Jimenez-Mateos, E. M., Bauer, S., Tackenberg, B., Rosenow, F., Lang, J., Onugoren, M. D., Hamer, H., Huchtemann, T., Körtvélyessy, P., Connolly, N. M. C., Pfeiffer, S., Prehn, J. H. M., Farrell, M. A., O’Brien, D. F., Henshall, D. C., & Mooney, C.
- Venue
- Scientific Reports
- Published
- 2017-06-12
- Volume
- 7
- Issue
- 1
- ISSN
- 2045-2322
- PMC
- PMC5468228
- Cited by
- 109
- References
- 10
- Language
- en
About these checks
Registry, retraction, Cites and statistics results are computed, not judged, with one exception: a printed reference that no index lists is read once by a model before it counts as a citation error. Claims are extracted by a model and kept only when their quote appears verbatim in the text; each cited source is then checked, with a model’s help, for whether it says what the claim relies on. Those verdicts can be wrong — read the claim’s quote and the cited source before relying on one.
Statistics and arithmetic are recomputed, not judged.
Confidence bands are shown only for fields calibrated on our annotated test set. None is calibrated yet, so no band is shown.
What counts as a claim ›How we measure confidence ›How we check this ›
Are you an author, or do you see a problem with this page? Request a review
