

A comparative strategy for single-nucleus and single-cell transcriptomes confirms accuracy in predicted cell-type expression from nuclear RNA
Open accessThe DOI matches its Crossref record; 29 of the 29 references it cites were found in a registry or an index.
Abstract
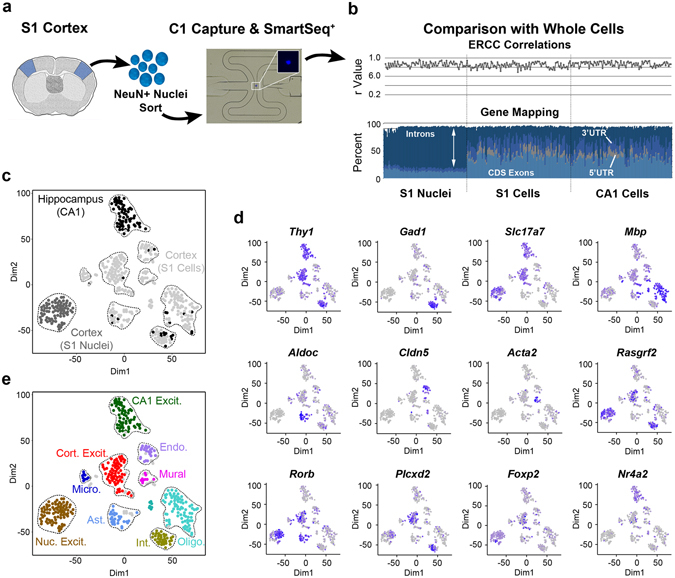
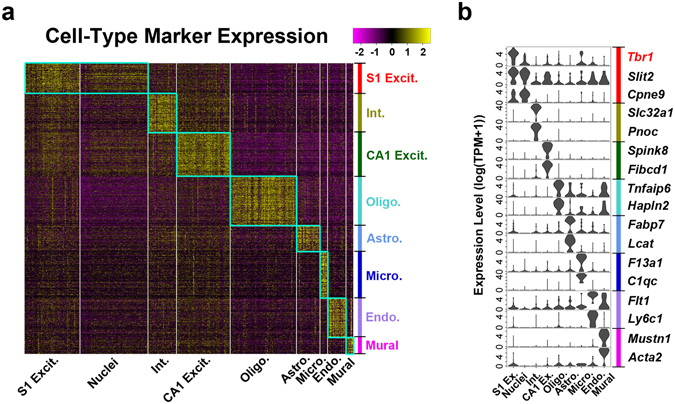
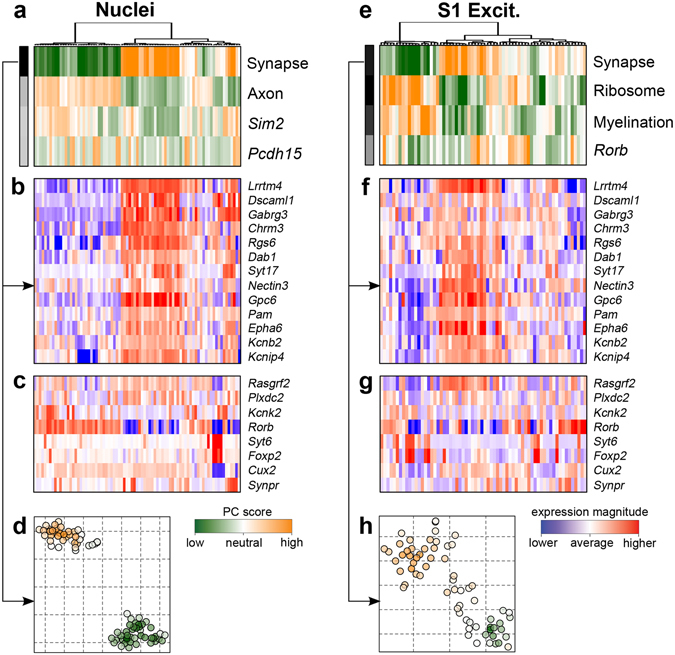
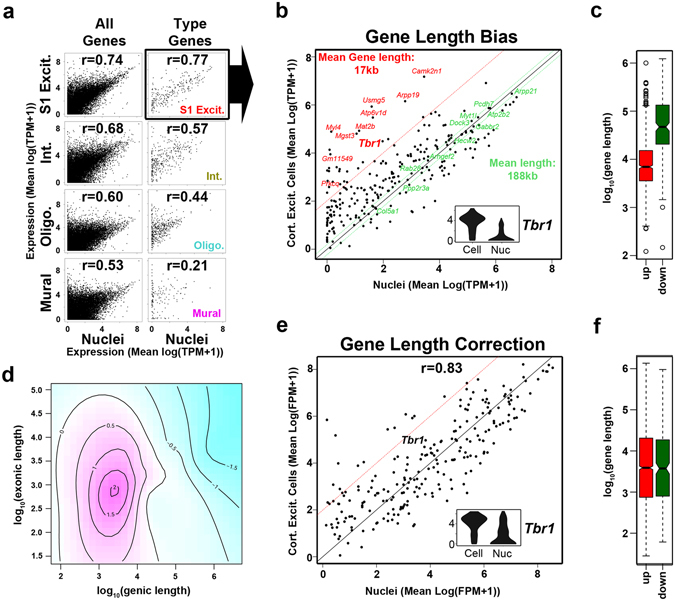
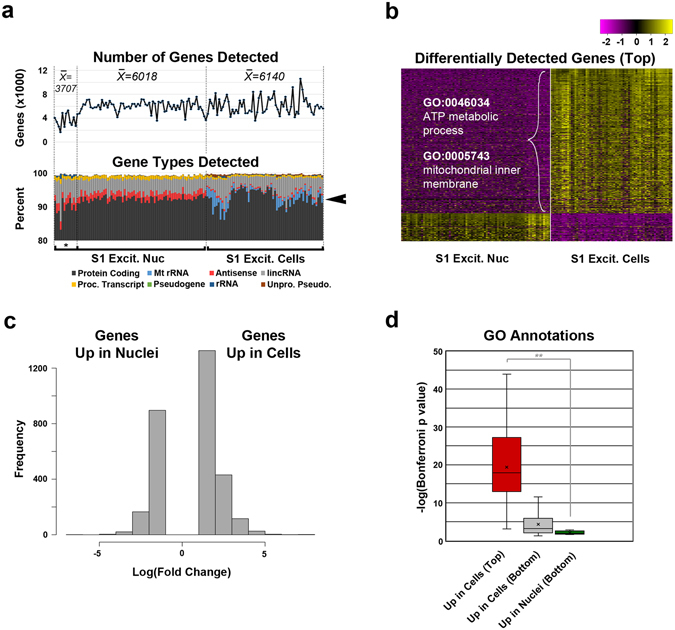
Significant heterogeneities in gene expression among individual cells are typically interrogated using single whole cell approaches. However, tissues that have highly interconnected processes, such as in the brain, present unique challenges. Single-nucleus RNA sequencing (SNS) has emerged as an alternative method of assessing a cell's transcriptome through the use of isolated nuclei. However, studies directly comparing expression data between nuclei and whole cells are lacking. Here, we have characterized nuclear and whole cell transcriptomes in mouse single neurons and provided a normalization strategy to reduce method-specific differences related to the length of genic regions. We confirmed a high concordance between nuclear and whole cell transcriptomes in the expression of cell type and metabolic modeling markers, but less so for a subset of genes associated with mitochondrial respiration. Therefore, our results indicate that single-nucleus transcriptome sequencing provides an effective means to profile cell type expression dynamics in previously inaccessible tissues.
Overview
The claims and statistics of this paper haven’t been checked yet.
Free: it reads the open-access text and checks the first 5 claims that cite a source we can check. Create a free account to check every claim.
Integrity signals
Registry
Cites
Statistics
Figures
Verification
Claims the paper makes
The claims and statistics of this paper haven’t been checked yet.
Free: it reads the open-access text and checks the first 5 claims that cite a source we can check. Create a free account to check every claim.
Claims other papers make about this one
Each is checked against this paper’s own text: does it say what the citing paper says it does?
The source backs part of the claim, not all of it — or backs it for a different population, condition or comparison.
In the citing paper
“For example, conventional cell dissociation protocols often compromise the integrity of neurons through mechanical shearing or induce the activation of glia[6, 8–12].”
From Comparative analysis of nuclei isolation methods for brain single-nucleus RNA sequencing (2026) · cites this paper as [11]
Experimental — accuracy not yet measuredThe cited source says what the claim attributes to it.
In the citing paper
“Despite this, snRNA-seq provides robust markers of brain cell types (Ding et al., 2020; Lake et al., 2017) with resolution comparable to scRNA-seq (Bakken et al., 2018; Yao et al., 2020a).”
From Single-Cell Sequencing of Brain Cell Transcriptomes and Epigenomes (2021) · cites this paper as Lake et al., 2017
Self-check
Percentages, sums and reported differences re-computed from the paper’s own numbers.
The self-check needs the paper’s full text.
Citations
Cites
Highly parallel genome-wide expression profiling of individual cells using nanoliter droplets.
Macosko, E. Z., Basu, A., Satija, R., Nemesh, J., Shekhar, K., Goldman, M., Tirosh, I., Bialas, A. R., Kamitaki, N., Martersteck, E. M., et al. (2015) · Cell · doi:10.1016/j.cell.2015.05.002 · Cited by 7,110
Cell types in the mouse cortex and hippocampus revealed by single-cell RNA-seq
Zeisel, A., Muñoz-Manchado, A. B., Codeluppi, S., Lönnerberg, P., La Manno, G., Juréus, A., Marques, S., Munguba, H., He, L., Betsholtz, C., et al. (2015) · Science · doi:10.1126/science.aaa1934 · Cited by 3,124
Self-citationThe Subread aligner: fast, accurate and scalable read mapping by seed-and-vote
Liao, Y., Smyth, G. K., & Shi, W. (2013) · Nucleic Acids Research · doi:10.1093/nar/gkt214 · Cited by 3,064
Adult mouse cortical cell taxonomy revealed by single cell transcriptomics
Tasic, B., Menon, V., Nguyen, T. N., Kim, T. K., Jarsky, T., Yao, Z., Levi, B., Gray, L. T., Sorensen, S. A., Dolbeare, T., et al. (2016) · Nature Neuroscience · doi:10.1038/nn.4216 · Cited by 1,714
Global reconstruction of the human metabolic network based on genomic and bibliomic data
Duarte, N. C., Becker, S. A., Jamshidi, N., Thiele, I., Mo, M. L., Vo, T. D., Srivas, R., & Palsson, B. Ø. (2007) · Proceedings of the National Academy of Sciences · doi:10.1073/pnas.0610772104 · Cited by 1,374
Neuronal subtypes and diversity revealed by single-nucleus RNA sequencing of the human brain
Lake, B. B., Ai, R., Kaeser, G. E., Salathia, N. S., Yung, Y. C., Liu, R., Wildberg, A., Gao, D., Fung, H.-L., Chen, S., et al. (2016) · Science · doi:10.1126/science.aaf1204 · Cited by 957
Self-citationPollen, A. A., Nowakowski, T. J., Shuga, J., Wang, X., Leyrat, A. A., Lui, J. H., Li, N., Szpankowski, L., Fowler, B., Chen, P., et al. (2014) · Nature Biotechnology · doi:10.1038/nbt.2967 · Cited by 920
Tbr1 regulates differentiation of the preplate and layer 6
Hevner, R. F., Shi, L., Justice, N., Hsueh, Y.-P., Sheng, M., Smiga, S., Bulfone, A., Goffinet, A. M., Campagnoni, A. T., & Rubenstein, J. L. R. (2001) · Neuron · doi:10.1016/s0896-6273(01)00211-2 · Cited by 857
Div-Seq: Single-nucleus RNA-Seq reveals dynamics of rare adult newborn neurons
Habib, N., Li, Y., Heidenreich, M., Swiech, L., Avraham-Davidi, I., Trombetta, J. J., Hession, C., Zhang, F., & Regev, A. (2016) · Science · doi:10.1126/science.aad7038 · Cited by 601
Somatic mutation in single human neurons tracks developmental and transcriptional history
Lodato, M. A., Woodworth, M. B., Lee, S., Evrony, G. D., Mehta, B. K., Karger, A., Lee, S., Chittenden, T. W., D’Gama, A. M., Cai, X., et al. (2015) · Science · doi:10.1126/science.aab1785 · Cited by 570
Cited by
Conserved cell types with divergent features in human versus mouse cortex
Hodge, R. D., Bakken, T. E., Miller, J. A., Smith, K. A., Barkan, E. R., Graybuck, L. T., Close, J. L., Long, B., Johansen, N., Penn, O., et al. (2019) · Nature · doi:10.1038/s41586-019-1506-7 · Cited by 1,775
Stoeckius, M., Zheng, S., Houck-Loomis, B., Hao, S., Yeung, B. Z., Mauck, W. M., Smibert, P., & Satija, R. (2018) · Genome Biology · doi:10.1186/s13059-018-1603-1 · Cited by 1,046
“With the increasing interest in single nucleus sequencing [23, 24], an additional set of hashing reagents directed against nuclear proteins would further generalize this ap-”
BackgroundSpatial Transcriptomics and In Situ Sequencing to Study Alzheimer’s Disease
Chen, W.-T., Lu, A., Craessaerts, K., Pavie, B., Sala Frigerio, C., Corthout, N., Qian, X., Laláková, J., Kühnemund, M., Voytyuk, I., et al. (2020) · Cell · doi:10.1016/j.cell.2020.06.038 · Cited by 949
Systematic comparison of single-cell and single-nucleus RNA-sequencing methods
Ding, J., Adiconis, X., Simmons, S. K., Kowalczyk, M. S., Hession, C. C., Marjanovic, N. D., Hughes, T. K., Wadsworth, M. H., Burks, T., Nguyen, L. T., et al. (2020) · Nature Biotechnology · doi:10.1038/s41587-020-0465-8 · Cited by 871
Integrative single-cell analysis of transcriptional and epigenetic states in the human adult brain
Lake, B. B., Chen, S., Sos, B. C., Fan, J., Kaeser, G. E., Yung, Y. C., Duong, T. E., Gao, D., Chun, J., Kharchenko, P. V., et al. (2018) · Nature Biotechnology · doi:10.1038/nbt.4038 · Cited by 983
Self-citation
Metadata
- Authors
- Lake, B. B., Codeluppi, S., Yung, Y. C., Gao, D., Chun, J., Kharchenko, P. V., Linnarsson, S., & Zhang, K.
- Affiliations
- University of California San Diego (US)
- Karolinska Institutet (SE)
- Sanford Burnham Prebys Medical Discovery Institute (US)
- Harvard University (US)
- Corresponding author
- Kharchenko, Peter V.
- Linnarsson, Sten
- Zhang, Kun
- ORCID
- Venue
- Scientific Reports
- Published
- 2017-07-20
- Volume
- 7
- Issue
- 1
- Pages
- 6031-6031
- ISSN
- 2045-2322 (ISSN-L)
- PMC
- PMC5519641
- OpenAlex
- W2734414396
- Cited by
- 271
- References
- 29
- Citations by year
- 2026: 16 · 2025: 32 · 2024: 28 · 2023: 38 · 2022: 46 · 2021: 37 · 2020: 39 · 2019: 16 · 2018: 17 · 2017: 2
- FWCI
- 8.26
- Type
- journal article
- Language
- en
- Open access
- gold
- doi.org
- Licence
- cc-by
- creativecommons.org/licenses/by/4.0 (tdm)
- creativecommons.org/licenses/by/4.0 (vor)
- Locations
- Scientific Reports (publishedVersion, cc-by)
- Europe PMC (PubMed Central) (publishedVersion, cc-by)
- PubMed Central (publishedVersion, cc-by)
- PubMed (publishedVersion)
- DOAJ (DOAJ: Directory of Open Access Journals) (submittedVersion, cc-by-sa)
- eScholarship (California Digital Library) (submittedVersion)
- Funders
- Thailand Science Research and Innovation
- National Institutes of Health
- National Heart, Lung, and Blood Institute (R01HL131768)
- National Institute of Mental Health (U01MH098977)
- Common Fund
- Topics
- Life Sciences › Biochemistry, Genetics and Molecular Biology › Molecular Biology › Single-cell and spatial transcriptomics
- Life Sciences › Biochemistry, Genetics and Molecular Biology › Molecular Biology › Genomics and Phylogenetic Studies
- Life Sciences › Biochemistry, Genetics and Molecular Biology › Molecular Biology › Genomics and Chromatin Dynamics
- Keywords
- single-nucleus RNA sequencing, single-cell transcriptomics, nuclear transcriptome, normalization strategies, mouse neurons, mitochondrial respiration, brain tissue
- MeSH terms
- Animals, Cell Nucleus, Cerebral Cortex, Female, Gene Expression Regulation, Male, Neurons, Organ Specificity, Gene Expression Profiling, Mice, Single-Cell Analysis, High-Throughput Nucleotide Sequencing, Transcriptome
About these checks
Registry, retraction, Cites and statistics results are computed, not judged, with one exception: a printed reference that no index lists is read once by a model before it counts as a citation error. Claims are extracted by a model and kept only when their quote appears verbatim in the text; each cited source is then checked, with a model’s help, for whether it says what the claim relies on. Those verdicts can be wrong — read the claim’s quote and the cited source before relying on one.
Statistics and arithmetic are recomputed, not judged.
Confidence bands are shown only for fields calibrated on our annotated test set. None is calibrated yet, so no band is shown.
What counts as a claim ›How we measure confidence ›How we check this ›
Are you an author, or do you see a problem with this page? Request a review
How to cite
Cite CoChat for the checks on this page, and the paper for its own findings.
- This page
- CoChat. (2026). Citation check: A comparative strategy for single-nucleus and single-cell transcriptomes confirms accuracy in predicted cell-type expression from nuclear RNA. https://app.cochat.ai/papers/10.1038/s41598-017-04426-w
- The paper
- Lake, B. B., Codeluppi, S., Yung, Y. C., Gao, D., Chun, J., Kharchenko, P. V., Linnarsson, S., & Zhang, K. (2017). A comparative strategy for single-nucleus and single-cell transcriptomes confirms accuracy in predicted cell-type expression from nuclear RNA. Scientific Reports. https://doi.org/10.1038/s41598-017-04426-w
Data sources
Bibliographic data: Semantic Scholar, OpenAlex, Crossref.
Contains information from the Semantic Scholar Academic Graph Datasets, made available under the ODC Attribution License (ODC-BY 1.0).
Semantic Scholar’s data is described in: Kinney, R., et al. (2023). The Semantic Scholar Open Data Platform. arXiv:2301.10140.
