Cited by 126

The DOI matches its Crossref record; 5 of the 5 references it cites were found in a registry or an index.

The transcription factor MafB promotes anti-inflammatory M2 polarization and cholesterol efflux in macrophages

Kim, Hwijin·2017·Scientific Reports

Abstract

Macrophages play pivotal roles in the progression and regression of atherosclerosis. Accumulating evidence suggests that macrophage polarization into an anti-inflammatory M2 state is a key characteristic of atherosclerotic plaques undergoing regression. However, the molecular mechanisms underlying this potential association of the M2 polarization with atherosclerosis regression remain poorly understood. Further, human genetic factors that facilitate these anti-atherogenic processes remain largely unknown. We report that the transcription factor MafB plays pivotal roles in promoting macrophage M2 polarization. Further, MafB promotes cholesterol efflux from macrophage foam cells by directly up-regulating its key cellular mediators. Notably, MafB expression is significantly up-regulated in response to various metabolic and immunological stimuli that promote macrophage M2 polarization or cholesterol efflux, and thereby MafB mediates their beneficial effects, in both liver x receptor (LXR)-dependent and independent manners. In contrast, MafB is strongly down-regulated upon elevated pro-inflammatory signaling or by pro-inflammatory and pro-atherogenic microRNAs, miR-155 and miR-33. Using an integrative systems biology approach, we also revealed that M2 polarization and cholesterol efflux do not necessarily represent inter-dependent events, but MafB is broadly involved in both the processes. These findings highlight physiological protective roles that MafB may play against atherosclerosis progression.

Overview

The claims and statistics of this paper haven’t been checked yet.

Run the check — free, no account needed. It reads the open-access text and checks the sources it cites.

A few free checks a day · papers already verified open instantly · results are public

Integrity signals

Registry

Crossref · 10.1038/s41598-017-07381-8

Cites

5 of 5 references verified0 citation errors · 0 not checkable

Statistics

Figures

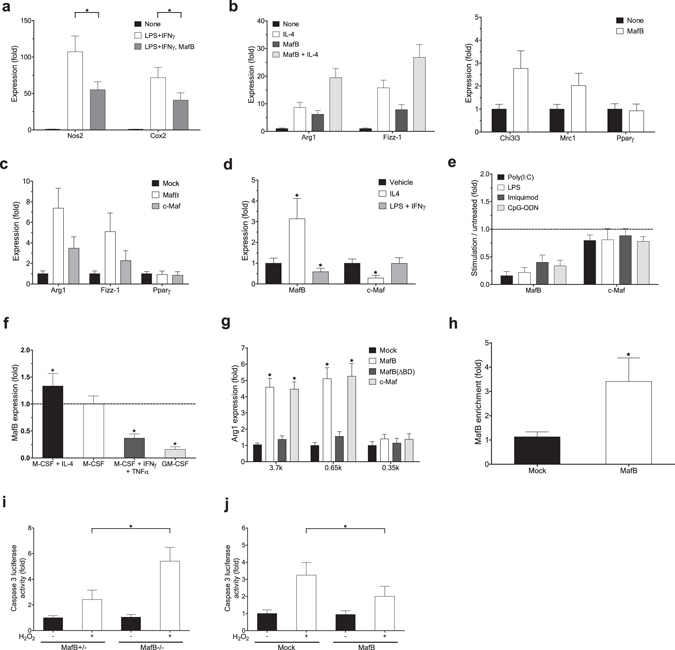
Figure 1 MafB promotes macrophage M2 polarization. (a–f) RT-PCR analysis. (a,b) Effect of ectopic MafB expression in mouse BMDM on M1/M2 polarization marker expression, measured at 24 h after stimulation. (a) M1 marker induction by LPS (10 ng/ml) and IFNγ (20 ng/ml). (b) M2 marker induction by IL-4 (40 ng/ml). (c) Effect of ectopic MafB expression in RAW264.7 cells on M2 markers. (d) Effect of mouse BMDM polarization on indicated gene expression. LPS plus IFNγ and IL-4 were treated for 24 h and 60 h, respectively. (a–d) Expression levels are presented relative to expression by vehicle- and/or mock-treated control. Sample number (n): n = 4. By two-tailed t-test, (a,d) *p < 0.05, (b,c) all except Pparγ: p < 0.05. (e) Effect of various pro-inflammatory stimulations in mouse BMDM. Agonists: poly(I:C) (5 µg/ml) (TLR3), LPS (100 ng/ml) (TLR4), imiquimod (2 µg/ml) (TLR7), and CpG-ODN (2.5 µg/ml) (TLR9). Expression levels are presented relative to vehicle-treated control samples. All MafB down-regulation: p < 0.05 (n = 4) by two-tailed paired sample t-test. (f) Effect of human monocyte-derived macrophages polarization on MafB expression. TNFα (20 ng/ml) plus IFNγ (M1) and IL-4 (M2) were treated for 24 h and 48 h, respectively. GM-CSF-derived macrophages (M1) were also compared. Expression levels are presented relative to M0 (M-CSF-derived) macrophages (*p < 0.05, n = 4). (g) Effects of MafB and c-Maf on activation of mouse Arg1 promoter-derived reporters in 293ETN cells. 3.7k and 0.65k Arg1-Luc contain an AP-1 binding motif, whereas 0.35k does not. Luciferase activity was measured at 30 h after transfection. *p < 0.05, n = 8. (h) Effect of Flag-MafB expression on its recruitment to the Arg1 promoter in RAW264.7 cells. Chromatin immunoprecipitation (ChIP) and RT-PCR. Promoter enrichments by anti-Flag antibody are presented relative to IgG-mediated enrichment. *p < 0.05, n = 4. (i,j) Effect of oxidative stress induced by H2O2 (200 μM) on cell apoptosis in MafB-deficient MEFs (i) and MafB-overexpressed RAW264.7 cells (j). Luciferase activity mediated by active caspase 3/7 was measured at 12 h post-stimulation. *p < 0.05, n = 8. (a–j) Data are represented as mean ± SD.
Figure 1 MafB promotes macrophage M2 polarization. (a–f) RT-PCR analysis. (a,b) Effect of ectopic MafB expression in mouse BMDM on M1/M2 polarization marker expression, measured at 24 h after stimulation. (a) M1 marker induction by LPS (10 ng/ml) and IFNγ (20 ng/ml). (b) M2 marker induction by IL-4 (40 ng/ml). (c) Effect of ectopic MafB expression in RAW264.7 cells on M2 markers. (d) Effect of mouse BMDM polarization on indicated gene expression. LPS plus IFNγ and IL-4 were treated for 24 h and 60 h, respectively. (a–d) Expression levels are presented relative to expression by vehicle- and/or mock-treated control. Sample number (n): n = 4. By two-tailed t-test, (a,d) *p < 0.05, (b,c) all except Pparγ: p < 0.05. (e) Effect of various pro-inflammatory stimulations in mouse BMDM. Agonists: poly(I:C) (5 µg/ml) (TLR3), LPS (100 ng/ml) (TLR4), imiquimod (2 µg/ml) (TLR7), and CpG-ODN (2.5 µg/ml) (TLR9). Expression levels are presented relative to vehicle-treated control samples. All MafB down-regulation: p < 0.05 (n = 4) by two-tailed paired sample t-test. (f) Effect of human monocyte-derived macrophages polarization on MafB expression. TNFα (20 ng/ml) plus IFNγ (M1) and IL-4 (M2) were treated for 24 h and 48 h, respectively. GM-CSF-derived macrophages (M1) were also compared. Expression levels are presented relative to M0 (M-CSF-derived) macrophages (*p < 0.05, n = 4). (g) Effects of MafB and c-Maf on activation of mouse Arg1 promoter-derived reporters in 293ETN cells. 3.7k and 0.65k Arg1-Luc contain an AP-1 binding motif, whereas 0.35k does not. Luciferase activity was measured at 30 h after transfection. *p < 0.05, n = 8. (h) Effect of Flag-MafB expression on its recruitment to the Arg1 promoter in RAW264.7 cells. Chromatin immunoprecipitation (ChIP) and RT-PCR. Promoter enrichments by anti-Flag antibody are presented relative to IgG-mediated enrichment. *p < 0.05, n = 4. (i,j) Effect of oxidative stress induced by H2O2 (200 μM) on cell apoptosis in MafB-deficient MEFs (i) and MafB-overexpressed RAW264.7 cells (j). Luciferase activity mediated by active caspase 3/7 was measured at 12 h post-stimulation. *p < 0.05, n = 8. (a–j) Data are represented as mean ± SD.CC BY · PubMed Central
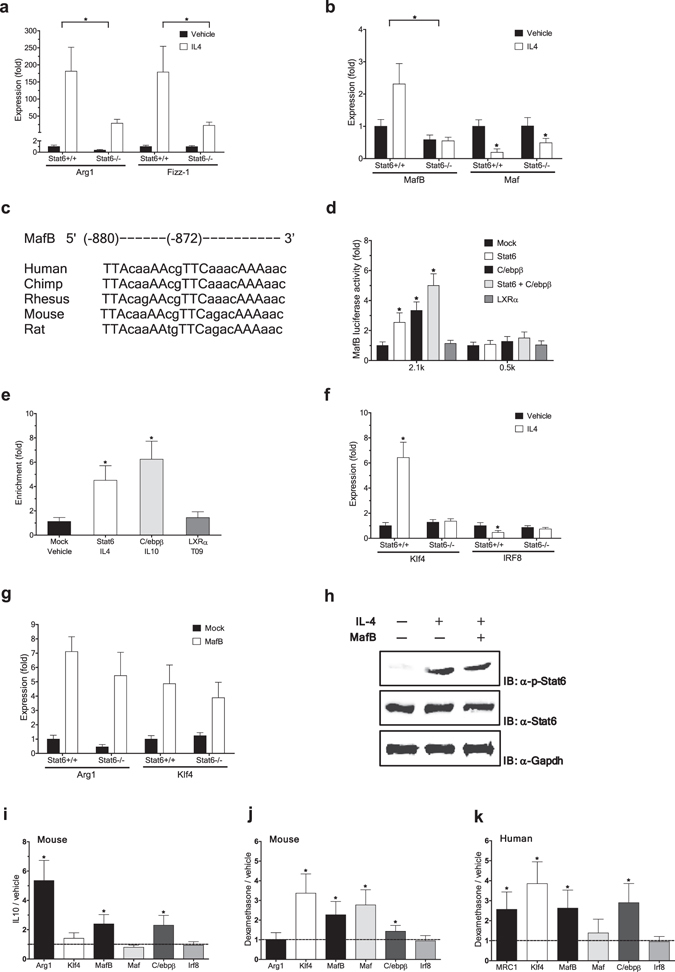
Figure 2 MafB mediates IL-4/STAT6-dependent signaling. (a,b,f,g) mouse BMDM from Stat6 KO mice and their wild-type littermates were compared. (a,b,f) Effect of IL-4 treatment (60 h) on indicated gene expression (RT-PCR). Expression levels are presented relative to expression by vehicle treated wild-type control. *p < 0.05, n = 4. (c) Putative C/ebpβ and Stat6 binding sites on MafB promoters. (d) Luciferase activity of 293ETN cells transfected with human MAFB promoter-derived reporters, with or without ectopic expression of indicated genes. 2.1k contains putative binding sites for Stat6 and C/ebpβ, whereas 0.5k does not. Activity was measured at 36 h after transfection. *p < 0.05, n = 8. (e) Effect of ectopic expression of indicated genes (HA tagged) on their recruitment to the MAFB promoter in 293ETN cells (ChIP). *p < 0.05, n = 4. (g) Effect of ectopic MafB expression on indicated gene expression (RT-PCR at 30 h after transduction), presented as in a. All MafB-mediated induction: p < 0.05 (n = 4). (h) Effect of MafB on Stat6 phosphorylation. Immunoblot (IB) analyses in Stat6-overexpressed 293ETN cells. Each panel has been run separately under the same experimental condition. Un-cropped blots are available upon request. (i–k) Effects of M2 polarizing stimuli on expression of genes involved in M2 polarization and cholesterol efflux (RT-PCR). (i) IL-10 (40 ng/ml for 8 h) in mouse BMDM. (j,k) dexamethasone (Dex) (100 nM for 12 h) in mouse BMDM (j) and human MDM (k). (i–k) Expression levels are presented relative to expression by vehicle-treated control. *p < 0.05 (n = 4) by paired sample t-test. All: Data are represented as mean ± SD.
Figure 2 MafB mediates IL-4/STAT6-dependent signaling. (a,b,f,g) mouse BMDM from Stat6 KO mice and their wild-type littermates were compared. (a,b,f) Effect of IL-4 treatment (60 h) on indicated gene expression (RT-PCR). Expression levels are presented relative to expression by vehicle treated wild-type control. *p < 0.05, n = 4. (c) Putative C/ebpβ and Stat6 binding sites on MafB promoters. (d) Luciferase activity of 293ETN cells transfected with human MAFB promoter-derived reporters, with or without ectopic expression of indicated genes. 2.1k contains putative binding sites for Stat6 and C/ebpβ, whereas 0.5k does not. Activity was measured at 36 h after transfection. *p < 0.05, n = 8. (e) Effect of ectopic expression of indicated genes (HA tagged) on their recruitment to the MAFB promoter in 293ETN cells (ChIP). *p < 0.05, n = 4. (g) Effect of ectopic MafB expression on indicated gene expression (RT-PCR at 30 h after transduction), presented as in a. All MafB-mediated induction: p < 0.05 (n = 4). (h) Effect of MafB on Stat6 phosphorylation. Immunoblot (IB) analyses in Stat6-overexpressed 293ETN cells. Each panel has been run separately under the same experimental condition. Un-cropped blots are available upon request. (i–k) Effects of M2 polarizing stimuli on expression of genes involved in M2 polarization and cholesterol efflux (RT-PCR). (i) IL-10 (40 ng/ml for 8 h) in mouse BMDM. (j,k) dexamethasone (Dex) (100 nM for 12 h) in mouse BMDM (j) and human MDM (k). (i–k) Expression levels are presented relative to expression by vehicle-treated control. *p < 0.05 (n = 4) by paired sample t-test. All: Data are represented as mean ± SD.CC BY · PubMed Central
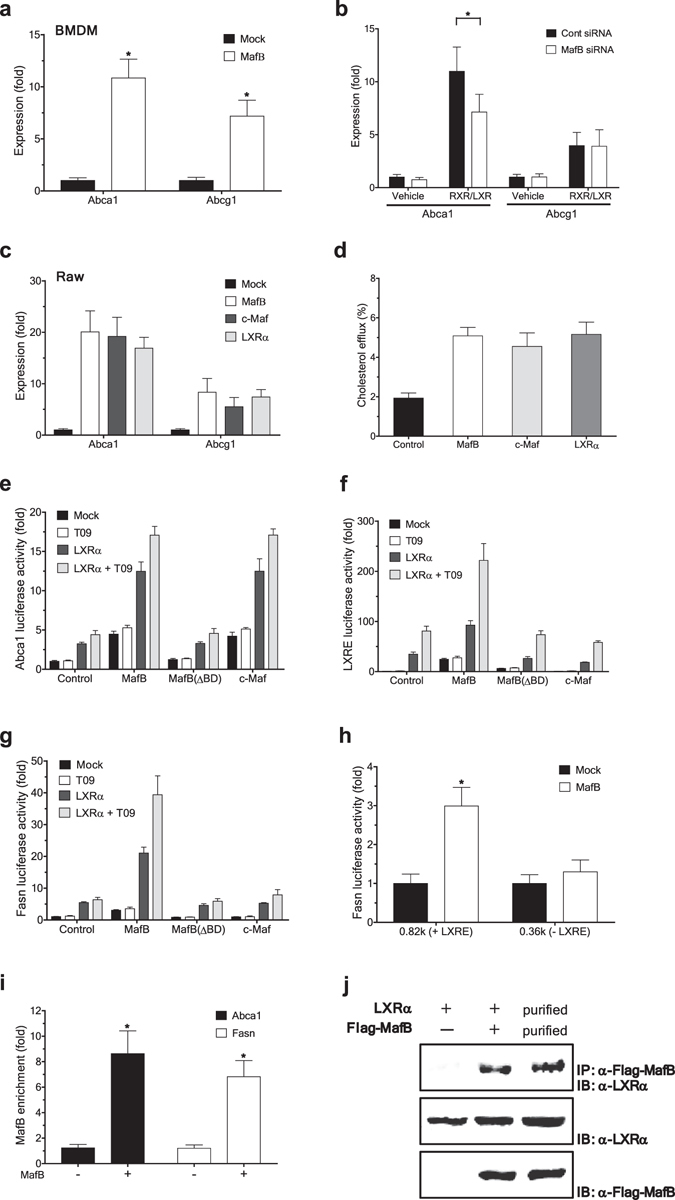
Figure 3 MafB facilitates cholesterol efflux by upregulating ATP-binding cassette transporters. (a,b) Effect of ectopic expression (a) or siRNA-mediated knockdown (b) of MafB on expression of Abca1 and Abcg1 in mouse BMDM (RT-PCR assay). Expression of ABC transporters was further induced using RXR and LXR agonists, 9cRA (0.5 µM) and GW3965 (1 μM), respectively. Expression levels are presented relative to expression by mock- and/or vehicle-treated control. *p < 0.05 (n = 4). (c) Effect of ectopic expression of an indicated gene on ABC transporter expression in RAW 264.7 cells (RT-PCR). Data are presented as in a. All: p < 0.05 (n = 4). (d) Effect of indicated gene overexpression on cholesterol efflux in J774A.1 cells. All: p < 0.05 (n = 6). (e–g) Effects of MafB, MafB (ΔBD) and c-Maf on activation of ABCA1 and FASN promoters in 293ETN cells. Luciferase activity of cells transfected with a reporter of human ABCA1 (e), LXRE (f) or FASN (g), with or without priming with LXRα co-expression. At 24 h after transfection, a LXRα agonist T0901317 (T09) (1 µM) was treated for 12 h. Activities are presented relative to expression by vehicle treated, mock-transfected control. n = 8. (h) Effect of MafB ectopic expression on activities of truncated FASN promoters (luciferase assay). n = 8. (i) Effect of Flag-MafB ectopic expression on its recruitment to the ABCA1 and FASN promoters in 293ETN cells (ChIP). *p < 0.05, n = 4. (j) Interaction of Flag-MafB with LXRα (Immunoprecipitation (IP) analyses) in 293ETN cells. Interaction between immunopurified Flag-MafB and Myc/DDK-LXRα was also shown (third column). Each panel has been run separately under the same experimental condition. All: Data are represented as mean ± SD.
Figure 3 MafB facilitates cholesterol efflux by upregulating ATP-binding cassette transporters. (a,b) Effect of ectopic expression (a) or siRNA-mediated knockdown (b) of MafB on expression of Abca1 and Abcg1 in mouse BMDM (RT-PCR assay). Expression of ABC transporters was further induced using RXR and LXR agonists, 9cRA (0.5 µM) and GW3965 (1 μM), respectively. Expression levels are presented relative to expression by mock- and/or vehicle-treated control. *p < 0.05 (n = 4). (c) Effect of ectopic expression of an indicated gene on ABC transporter expression in RAW 264.7 cells (RT-PCR). Data are presented as in a. All: p < 0.05 (n = 4). (d) Effect of indicated gene overexpression on cholesterol efflux in J774A.1 cells. All: p < 0.05 (n = 6). (e–g) Effects of MafB, MafB (ΔBD) and c-Maf on activation of ABCA1 and FASN promoters in 293ETN cells. Luciferase activity of cells transfected with a reporter of human ABCA1 (e), LXRE (f) or FASN (g), with or without priming with LXRα co-expression. At 24 h after transfection, a LXRα agonist T0901317 (T09) (1 µM) was treated for 12 h. Activities are presented relative to expression by vehicle treated, mock-transfected control. n = 8. (h) Effect of MafB ectopic expression on activities of truncated FASN promoters (luciferase assay). n = 8. (i) Effect of Flag-MafB ectopic expression on its recruitment to the ABCA1 and FASN promoters in 293ETN cells (ChIP). *p < 0.05, n = 4. (j) Interaction of Flag-MafB with LXRα (Immunoprecipitation (IP) analyses) in 293ETN cells. Interaction between immunopurified Flag-MafB and Myc/DDK-LXRα was also shown (third column). Each panel has been run separately under the same experimental condition. All: Data are represented as mean ± SD.CC BY · PubMed Central
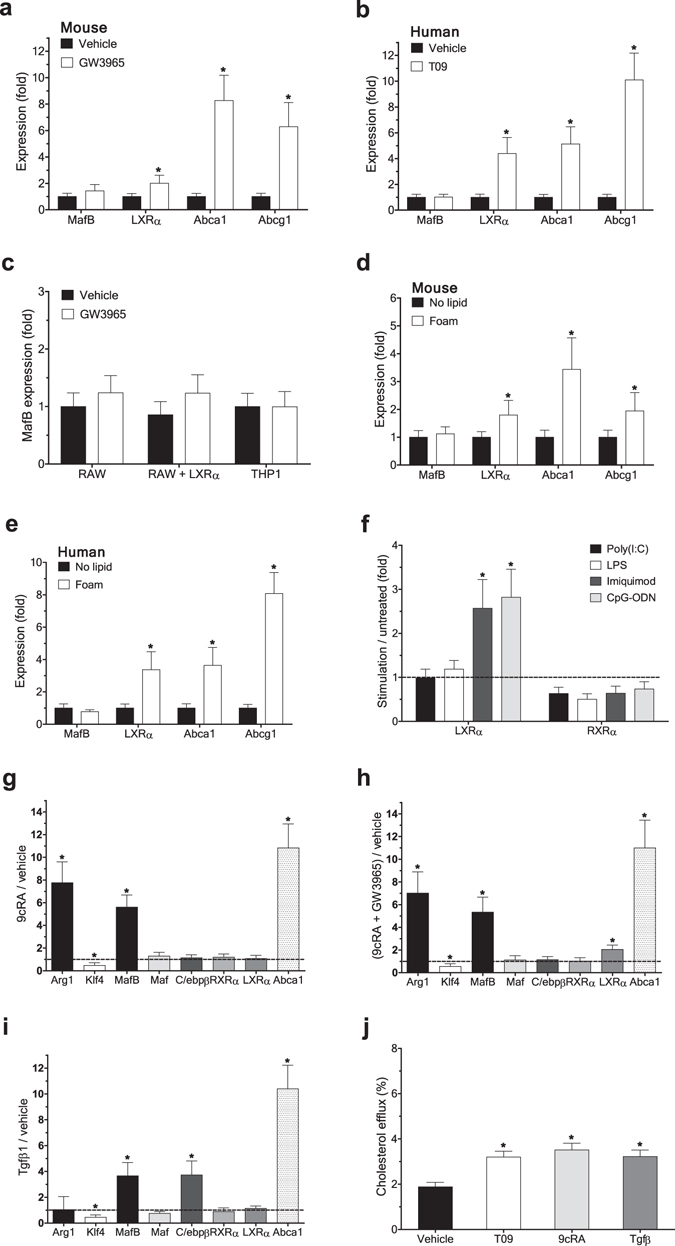
Figure 4 Cholesterol efflux-promoting signals upregulate MafB expression. (a–c) Effect of treatment of a LXR agonist, GW3965 (1 μM) or T09 (1 µM), for 18 h on expression of indicated genes in mouse BMDM (a), human MDM (b), and RAW 264.7 or THP1 cells (c) (RT-PCR). Expression levels are presented relative to expression by vehicle-treated control in each cell type. *p < 0.05, n = 4. (d,e) Effect of oxidized low-density lipoprotein (oxLDL) loading (for 24 h) on expression of indicated genes in mouse BMDM (d) and human MDM (e). Expression levels are presented relative to expression by no lipid loaded control. *p < 0.05, n = 4. (f) Effect of various pro-inflammatory stimuli in mouse BMDM on indicated gene expression. Expression levels are presented relative to expression by vehicle-treated control. *p < 0.05 (n = 4) by two-tailed paired sample t-test. (g–i) Effect of treatment of a RXR agonist, 9cRA (0.5 µM) (g), RXR and LXR agonists, 9cRA and GW3965 (h), or TGFβ (1 ng/ml) (i) for 18 h in mouse BMDM on indicated gene expression. Data are presented as in f. *p < 0.05, n = 4. (j) Effects of T09, 9cRA and TGFβ on cholesterol efflux in J774A.1 cells. *p < 0.05, n = 4. All: Data are represented as mean ± SD.
Figure 4 Cholesterol efflux-promoting signals upregulate MafB expression. (a–c) Effect of treatment of a LXR agonist, GW3965 (1 μM) or T09 (1 µM), for 18 h on expression of indicated genes in mouse BMDM (a), human MDM (b), and RAW 264.7 or THP1 cells (c) (RT-PCR). Expression levels are presented relative to expression by vehicle-treated control in each cell type. *p < 0.05, n = 4. (d,e) Effect of oxidized low-density lipoprotein (oxLDL) loading (for 24 h) on expression of indicated genes in mouse BMDM (d) and human MDM (e). Expression levels are presented relative to expression by no lipid loaded control. *p < 0.05, n = 4. (f) Effect of various pro-inflammatory stimuli in mouse BMDM on indicated gene expression. Expression levels are presented relative to expression by vehicle-treated control. *p < 0.05 (n = 4) by two-tailed paired sample t-test. (g–i) Effect of treatment of a RXR agonist, 9cRA (0.5 µM) (g), RXR and LXR agonists, 9cRA and GW3965 (h), or TGFβ (1 ng/ml) (i) for 18 h in mouse BMDM on indicated gene expression. Data are presented as in f. *p < 0.05, n = 4. (j) Effects of T09, 9cRA and TGFβ on cholesterol efflux in J774A.1 cells. *p < 0.05, n = 4. All: Data are represented as mean ± SD.CC BY · PubMed Central
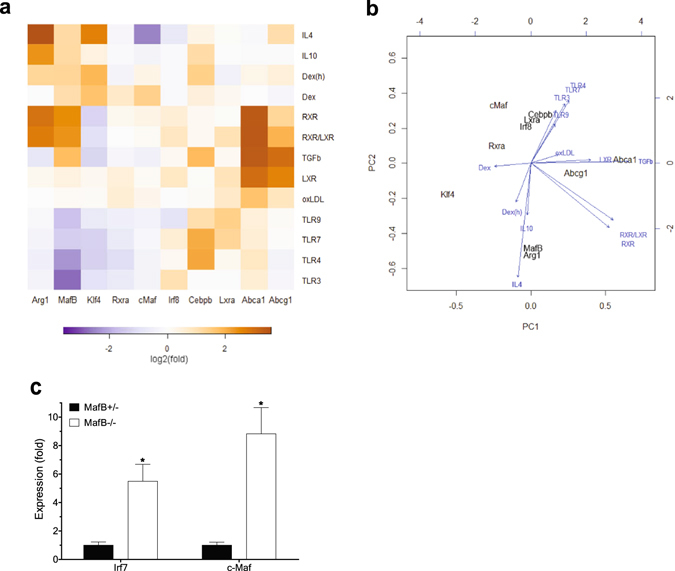
Figure 5 Global view of regulation of MafB expression and its therapeutic implications. (a,b) Integrative analyses of gene expression (RT-PCR, n = 4). Agonist used for each receptor is as follows. LXR: GW3965, RXR: 9cRA, TLR3: poly(I:C), TLR4: LPS, TLR7: imiquimod, and TLR9: CpG-ODN. Unless otherwise specified, results obtained in mouse BMDM were shown. Dex(h) indicates dexamethasone-treated human MDM, in which MRC1 expression was measured instead of Arg1. (a) Heatmap analysis. Row: different stimuli, Column: different genes. Log2 transformation of median fold changes (stimulation versus vehicle-treated) of expression levels of indicated genes were plotted. (b) Principal component analysis (PCA) and stimulation contribution plot. Principal component one (PC1) and two (PC2) primarily capture cholesterol efflux and M1/M2 polarization, respectively. Black: each gene in the PC space. Blue: contribution of each stimulus to the PCs. (c) Effect of MafB deficiency on c-Maf expression (RT-PCR). Mafb +/− and Mafb −/− MEFs were compared (*p < 0.05). Increase IRF7 was shown as a positive control.
Figure 5 Global view of regulation of MafB expression and its therapeutic implications. (a,b) Integrative analyses of gene expression (RT-PCR, n = 4). Agonist used for each receptor is as follows. LXR: GW3965, RXR: 9cRA, TLR3: poly(I:C), TLR4: LPS, TLR7: imiquimod, and TLR9: CpG-ODN. Unless otherwise specified, results obtained in mouse BMDM were shown. Dex(h) indicates dexamethasone-treated human MDM, in which MRC1 expression was measured instead of Arg1. (a) Heatmap analysis. Row: different stimuli, Column: different genes. Log2 transformation of median fold changes (stimulation versus vehicle-treated) of expression levels of indicated genes were plotted. (b) Principal component analysis (PCA) and stimulation contribution plot. Principal component one (PC1) and two (PC2) primarily capture cholesterol efflux and M1/M2 polarization, respectively. Black: each gene in the PC space. Blue: contribution of each stimulus to the PCs. (c) Effect of MafB deficiency on c-Maf expression (RT-PCR). Mafb +/− and Mafb −/− MEFs were compared (*p < 0.05). Increase IRF7 was shown as a positive control.CC BY · PubMed Central
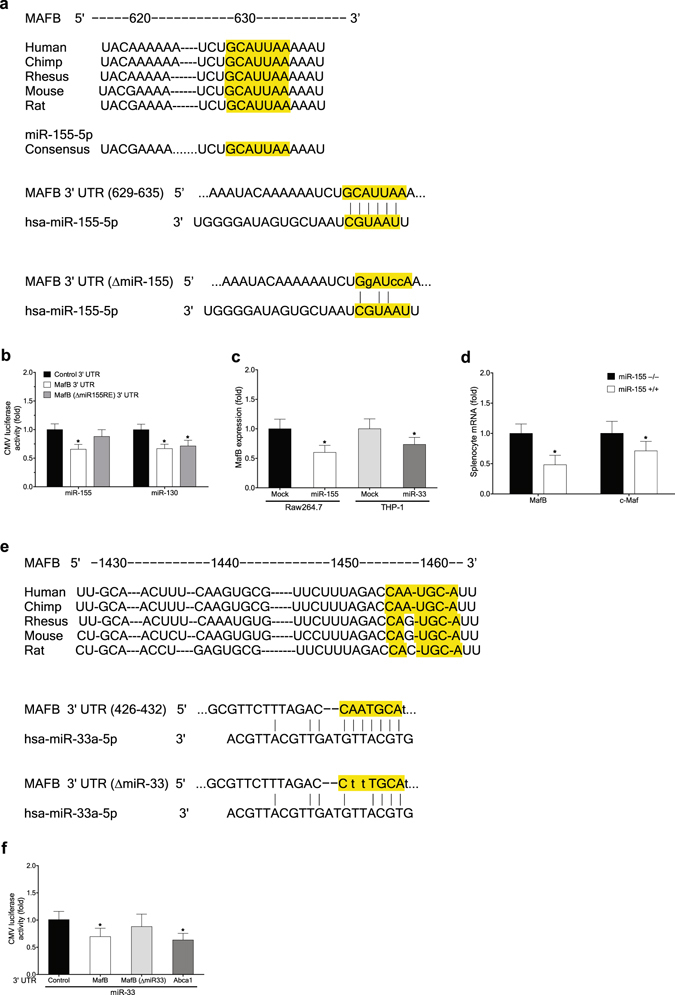
Figure 6 Atherogenic miR-155 and miR-33 negatively regulate MafB. (a) Sequence of MafB 3′ UTR targeted by miR-155 (TargetScan). (b) Effect of miR-155 ectopic expression in 293ETN cells on activities of a MafB 3′ UTR luciferase reporter and its mutant non-targetable by miR-155 (luciferase assay). Effect of miR-130 ectopic expression was compared as a positive control. *p < 0.05, n = 8. (c) Effects of ectopic expression of miR-155 (left) and miR-33 (right) on the endogenous level of MafB mRNA in RAW 264.7 (left) and THP-1 cells (right) (RT-PCR assay). *p < 0.05, n = 4. (d) Effect of miR-155 deficiency on the endogenous level of MafB mRNA (RT-PCR). Splenocytes isolated from miR-155-deficient mice were compared to those from wild-type mice. *p < 0.05, n = 4. (e) Sequence of MafB 3′ UTR targeted by miR-33 (TargetScan). (f) Effect of miR-33 ectopic expression in 293ETN cells on activities of MafB 3′ UTR luciferase reporters. Effect on an ABCA1 3′ UTR reporter was shown as a positive control. *p < 0.05, n = 8. All: Data are represented as mean ± SD.
Figure 6 Atherogenic miR-155 and miR-33 negatively regulate MafB. (a) Sequence of MafB 3′ UTR targeted by miR-155 (TargetScan). (b) Effect of miR-155 ectopic expression in 293ETN cells on activities of a MafB 3′ UTR luciferase reporter and its mutant non-targetable by miR-155 (luciferase assay). Effect of miR-130 ectopic expression was compared as a positive control. *p < 0.05, n = 8. (c) Effects of ectopic expression of miR-155 (left) and miR-33 (right) on the endogenous level of MafB mRNA in RAW 264.7 (left) and THP-1 cells (right) (RT-PCR assay). *p < 0.05, n = 4. (d) Effect of miR-155 deficiency on the endogenous level of MafB mRNA (RT-PCR). Splenocytes isolated from miR-155-deficient mice were compared to those from wild-type mice. *p < 0.05, n = 4. (e) Sequence of MafB 3′ UTR targeted by miR-33 (TargetScan). (f) Effect of miR-33 ectopic expression in 293ETN cells on activities of MafB 3′ UTR luciferase reporters. Effect on an ABCA1 3′ UTR reporter was shown as a positive control. *p < 0.05, n = 8. All: Data are represented as mean ± SD.CC BY · PubMed Central

Verification

Claims the paper makes

The claims and statistics of this paper haven’t been checked yet.

Run the check — free, no account needed. It reads the open-access text and checks the sources it cites.

A few free checks a day · papers already verified open instantly · results are public

Claims other papers make about this one

Each is checked against this paper’s own text: does it say what the citing paper says it does?

Self-check

Percentages, sums and reported differences re-computed from the paper’s own numbers.

The self-check needs the paper’s full text.

Citations

Cites

Show all 5 references

Research works printed but not linked: 35

  1. Moore, K. J., Sheedy, F. J. & Fisher, E. A. Macrophages in atherosclerosis: a dynamic balance. Nature reviews. Immunology 13, 709–721 (2013). · DOI · Paper page
  2. Chinetti-Gbaguidi, G., Colin, S. & Staels, B. Macrophage subsets in atherosclerosis. Nature reviews. Cardiology 12, 10–17 (2015). · DOI
  3. Joseph, S. B. et al. Synthetic LXR ligand inhibits the development of atherosclerosis in mice. Proceedings of the National Academy of Sciences of the United States of America 99, 7604–7609 (2002). · DOI
  4. Kim, H. & Seed, B. The transcription factor MafB antagonizes antiviral responses by blocking recruitment of coactivators to the transcription factor IRF3. Nat Immunol 11, 743–750 (2010). · DOI
  5. Kelly, L. M., Englmeier, U., Lafon, I., Sieweke, M. H. & Graf, T. MafB is an inducer of monocytic differentiation. Embo J 19, 1987–1997 (2000). · DOI
  6. Liu, G. & Abraham, E. MicroRNAs in immune response and macrophage polarization. Arteriosclerosis, thrombosis, and vascular biology 33, 170–177 (2013). · DOI
  7. Puig-Kroger, A. et al. Folate receptor beta is expressed by tumor-associated macrophages and constitutes a marker for M2 anti-inflammatory/regulatory macrophages. Cancer research 69, 9395–9403 (2009). · DOI
  8. Gemelli, C. et al. MafB is a downstream target of the IL-10/STAT3 signaling pathway, involved in the regulation of macrophage de-activation. Biochimica et biophysica acta 1843, 955–964 (2014). · DOI
  9. Pourcet, B. & Pineda-Torra, I. Transcriptional regulation of macrophage arginase 1 expression and its role in atherosclerosis. Trends in cardiovascular medicine 23, 143–152 (2013). · DOI
  10. Stocker, R. & Keaney, J. F. Jr. Role of oxidative modifications in atherosclerosis. Physiological reviews 84, 1381–1478 (2004). · DOI
  11. Liao, X. et al. Kruppel-like factor 4 regulates macrophage polarization. J Clin Invest 121, 2736–2749 (2011). · DOI · Paper page
  12. Lopez-Pajares, V. et al. A LncRNA-MAF:MAFB transcription factor network regulates epidermal differentiation. Developmental cell 32, 693–706 (2015). · DOI · Paper page
  13. Kurotaki, D. et al. Essential role of the IRF8-KLF4 transcription factor cascade in murine monocyte differentiation. Blood 121, 1839–1849 (2013). · DOI · Paper page
  14. Murray, P. J. Understanding and exploiting the endogenous interleukin-10/STAT3-mediated anti-inflammatory response. Current opinion in pharmacology 6, 379–386 (2006). · DOI · Paper page
  15. Dzik, J. M. Evolutionary roots of arginase expression and regulation. Frontiers in immunology 5, 544 (2014). · DOI
  16. Gray, M. J., Poljakovic, M., Kepka-Lenhart, D. & Morris, S. M. Jr. Induction of arginase I transcription by IL-4 requires a composite DNA response element for STAT6 and C/EBPbeta. Gene 353, 98–106 (2005). · DOI · Paper page
  17. Kurokawa, H. et al. Structural basis of alternative DNA recognition by Maf transcription factors. Molecular and cellular biology 29, 6232–6244 (2009). · DOI
  18. Chawla, A. et al. A PPAR gamma-LXR-ABCA1 pathway in macrophages is involved in cholesterol efflux and atherogenesis. Molecular cell 7, 161–171 (2001). · DOI · Paper page
  19. Roszer, T., Menendez-Gutierrez, M. P., Cedenilla, M. & Ricote, M. Retinoid X receptors in macrophage biology. Trends in endocrinology and metabolism: TEM 24, 460–468 (2013). · DOI · Paper page
  20. Menendez-Gutierrez, M. P. et al. Retinoid X receptors orchestrate osteoclast differentiation and postnatal bone remodeling. J Clin Invest 125, 809–823 (2015). · DOI
  21. Panousis, C. G., Evans, G. & Zuckerman, S. H. TGF-beta increases cholesterol efflux and ABC-1 expression in macrophage-derived foam cells: opposing the effects of IFN-gamma. Journal of lipid research 42, 856–863 (2001). · DOI
  22. Aziz, A. et al. Development of macrophages with altered actin organization in the absence of MafB. Molecular and cellular biology 26, 6808–6818 (2006). · DOI
  23. Castrillo, A. et al. Crosstalk between LXR and toll-like receptor signaling mediates bacterial and viral antagonism of cholesterol metabolism. Molecular cell 12, 805–816 (2003). · DOI
  24. Ramsey, S. A. et al. Epigenome-guided analysis of the transcriptome of plaque macrophages during atherosclerosis regression reveals activation of the Wnt signaling pathway. PLoS genetics 10, e1004828 (2014). · DOI
  25. Nazari-Jahantigh, M. et al. MicroRNA-155 promotes atherosclerosis by repressing Bcl6 in macrophages. J Clin Invest 122, 4190–4202 (2012). · DOI
  26. Worm, J. et al. Silencing of microRNA-155 in mice during acute inflammatory response leads to derepression of c/ebp Beta and down-regulation of G-CSF. Nucleic acids research 37, 5784–5792 (2009). · DOI
  27. Garzon, R. et al. MicroRNA fingerprints during human megakaryocytopoiesis. Proceedings of the National Academy of Sciences of the United States of America 103, 5078–5083 (2006). · DOI
  28. Rayner, K. J. et al. MiR-33 contributes to the regulation of cholesterol homeostasis. Science 328, 1570–1573 (2010). · DOI · Paper page
  29. Rayner, K. J. et al. Inhibition of miR-33a/b in non-human primates raises plasma HDL and lowers VLDL triglycerides. Nature 478, 404–407 (2011). · DOI · Paper page
  30. Rottiers, V. et al. Pharmacological inhibition of a microRNA family in nonhuman primates by a seed-targeting 8-mer antimiR. Science translational medicine 5, 212ra162 (2013). · DOI · Paper page
  31. Hasegawa, H. et al. The role of macrophage transcription factor MafB in atherosclerotic plaque stability. Atherosclerosis 250, 133–143 (2016). · DOI
  32. Tabas, I. & Bornfeldt, K. E. Macrophage Phenotype and Function in Different Stages of Atherosclerosis. Circulation research 118, 653–667 (2016). · DOI · Paper page
  33. Eychene, A., Rocques, N. & Pouponnot, C. A new MAFia in cancer. Nat Rev Cancer 8, 683–693 (2008). · DOI
  34. Kim, H. The transcription cofactor CRTC1 protects from aberrant hepatic lipid accumulation. Scientific reports 6, 37280 (2016). · DOI
  35. Kim, H. & Perelson, A. S. Viral and latent reservoir persistence in HIV-1-infected patients on therapy. PLoS Comput Biol 2, e135 (2006). · DOI

Cited by

Sorted by citations

Metadata

Authors
Kim, H.
Venue
Scientific Reports
Published
2017-08-08
Volume
7
Issue
1
ISSN
2045-2322
Cited by
126
References
5
Language
en

About these checks

Registry, retraction, Cites and statistics results are computed, not judged, with one exception: a printed reference that no index lists is read once by a model before it counts as a citation error. Claims are extracted by a model and kept only when their quote appears verbatim in the text; each cited source is then checked, with a model’s help, for whether it says what the claim relies on. Those verdicts can be wrong — read the claim’s quote and the cited source before relying on one.

Statistics and arithmetic are recomputed, not judged.

Confidence bands are shown only for fields calibrated on our annotated test set. None is calibrated yet, so no band is shown.

What counts as a claim ›How we measure confidence ›How we check this ›

Are you an author, or do you see a problem with this page? Request a review