

The DOI matches its Crossref record; 64 of the 64 references it cites were found in a registry or an index.
Reconstructing the Neanderthal brain using computational anatomy
Open accessAbstract
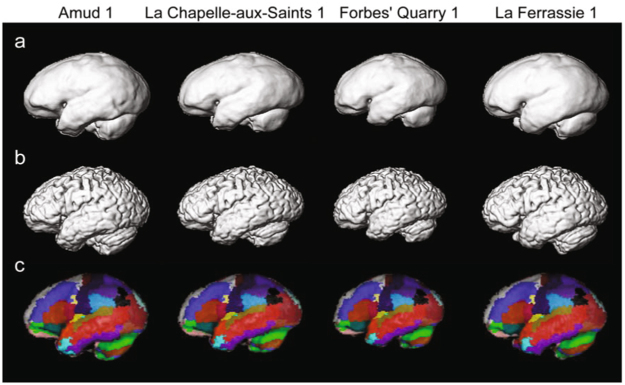
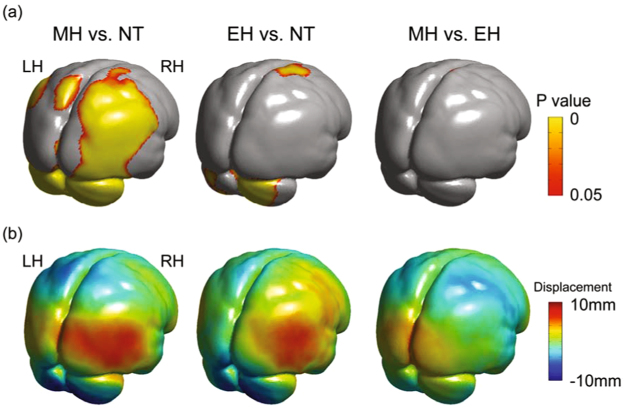
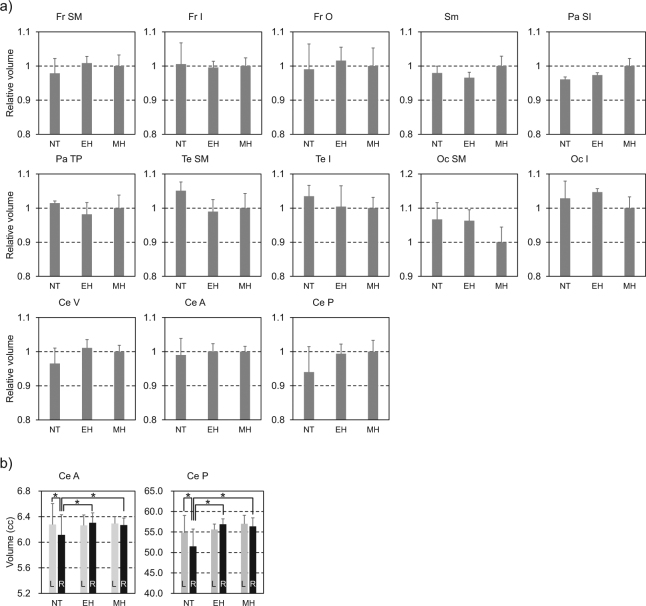
The present study attempted to reconstruct 3D brain shape of Neanderthals and early Homo sapiens based on computational neuroanatomy. We found that early Homo sapiens had relatively larger cerebellar hemispheres but a smaller occipital region in the cerebrum than Neanderthals long before the time that Neanderthals disappeared. Further, using behavioural and structural imaging data of living humans, the abilities such as cognitive flexibility, attention, the language processing, episodic and working memory capacity were positively correlated with size-adjusted cerebellar volume. As the cerebellar hemispheres are structured as a large array of uniform neural modules, a larger cerebellum may possess a larger capacity for cognitive information processing. Such a neuroanatomical difference in the cerebellum may have caused important differences in cognitive and social abilities between the two species and might have contributed to the replacement of Neanderthals by early Homo sapiens .
Overview
The claims and statistics of this paper haven’t been checked yet.
Run the check — free, no account needed. It reads the open-access text and checks the sources it cites.
Integrity signals
Registry
Cites
Statistics
Figures
Verification
Claims the paper makes
The claims and statistics of this paper haven’t been checked yet.
Run the check — free, no account needed. It reads the open-access text and checks the sources it cites.
Claims other papers make about this one
Each is checked against this paper’s own text: does it say what the citing paper says it does?
The cited source says what the claim attributes to it.
In the citing paper
“However, comparative studies indicate that the increased endocranial globularity of present-day humans as compared to Neandertals is not merely the result of absolute cerebellar enlargement [4, 5], suggesting that endocranial shape variation involves complex shifts in relative, rather than absolute, volumes of different brain structures.”
From Neandertal Introgression Sheds Light on Modern Human Endocranial Globularity (2019) · cites this paper as [5]
In the citing paper
“we find changes that might have affected the size of the cerebellum, a key contributor to our brain shape11,84, possibly even since the split from Neanderthals85”
From A catalog of single nucleotide changes distinguishing modern humans from archaic hominins (2019) · cites this paper as [84]
Self-check
Percentages, sums and reported differences re-computed from the paper’s own numbers.
The self-check needs the paper’s full text.
Citations
Cites
Tzourio-Mazoyer, N., Landeau, B., Papathanassiou, D., Crivello, F., Etard, O., Delcroix, N., Mazoyer, B., & Joliot, M. (2002) · NeuroImage · doi:10.1006/nimg.2001.0978 · Cited by 16,319
Diamond, A. (2013) · Annual Review of Psychology · doi:10.1146/annurev-psych-113011-143750 · Cited by 13,268
Fischl, B., Salat, D. H., Busa, E., Albert, M., Dieterich, M., Haselgrove, C., van der Kouwe, A., Killiany, R., Kennedy, D., Klaveness, S., et al. (2002) · Neuron · doi:10.1016/s0896-6273(02)00569-x · Cited by 8,610
A fast diffeomorphic image registration algorithm
Ashburner, J. (2007) · NeuroImage · doi:10.1016/j.neuroimage.2007.07.007 · Cited by 8,122
Zhang, Y., Brady, M., & Smith, S. M. (2001) · IEEE Transactions on Medical Imaging · doi:10.1109/42.906424 · Cited by 7,628
Ashburner, J., & Friston, K. J. (2005) · NeuroImage · doi:10.1016/j.neuroimage.2005.02.018 · Cited by 7,507
The WU-Minn Human Connectome Project: An overview
Van Essen, D. C., Smith, S. M., Barch, D. M., Behrens, T. E. J., Yacoub, E., & Ugurbil, K. (2013) · NeuroImage · doi:10.1016/j.neuroimage.2013.05.041 · Cited by 5,651
The precuneus: a review of its functional anatomy and behavioural correlates
Cavanna, A. E., & Trimble, M. R. (2006) · Brain · doi:10.1093/brain/awl004 · Cited by 5,128
Working Memory: Theories, Models, and Controversies
Baddeley, A. (2012) · Annual Review of Psychology · doi:10.1146/annurev-psych-120710-100422 · Cited by 4,271
The cerebellar cognitive affective syndrome
Schmahmann, J. (1998) · Brain · doi:10.1093/brain/121.4.561 · Cited by 3,230
Cited by
Sorted by citations
Diedrichsen, J., King, M., Hernandez-Castillo, C., Sereno, M., & Ivry, R. B. (2019) · Neuron · doi:10.1016/j.neuron.2019.04.021 · Cited by 281
The human cerebellum has almost 80% of the surface area of the neocortex
Sereno, M. I., Diedrichsen, J., Tachrount, M., Testa-Silva, G., D'Arceuil, H. E., & Zeeuw, C. I. D. (2020) · Proceedings of the National Academy of Sciences · doi:10.1073/pnas.2002896117 · Cited by 204
Are endocasts good proxies for brain size and shape in archosaurs throughout ontogeny?
Watanabe, A., Gignac, P. M., Balanoff, A. M., Green, T. L., Kley, N. J., & Norell, M. A. (2018) · Journal of Anatomy · doi:10.1111/joa.12918 · Cited by 142
Liang, K. J., & Carlson, E. S. (2019) · Neurobiology of Learning and Memory · doi:10.1016/j.nlm.2019.01.004 · Cited by 131
Neandertal Introgression Sheds Light on Modern Human Endocranial Globularity
Gunz, P., Tilot, A. K., Wittfeld, K., Teumer, A., Shapland, C. Y., van Erp, T. G. M., Dannemann, M., Vernot, B., Neubauer, S., Guadalupe, T., et al. (2019) · Current Biology · doi:10.1016/j.cub.2018.10.065 · Cited by 117
“However, comparative studies indicate that the increased endocranial globularity of present-day humans as compared to Neandertals is not merely the result of absolute cerebellar enlargement [4, 5], suggesting that endocranial shape variation involves complex shifts in relative, rather than absolute, volumes of differe…”
A catalog of single nucleotide changes distinguishing modern humans from archaic hominins
Kuhlwilm, M., & Boeckx, C. (2019) · Scientific Reports · doi:10.1038/s41598-019-44877-x · Cited by 108
Neubauer, S., Gunz, P., Scott, N. A., Hublin, J., & Mitterœcker, P. (2020) · Science Advances · doi:10.1126/sciadv.aax9935 · Cited by 89
Timmermann, A. (2020) · Quaternary Science Reviews · doi:10.1016/j.quascirev.2020.106331 · Cited by 86
The cis-regulatory effects of modern human-specific variants
Weiss, C. V., Harshman, L., Inoue, F., Fraser, H. B., Petrov, D. A., Ahituv, N., & Gokhman, D. (2021) · eLife · doi:10.7554/elife.63713 · Cited by 70
Quantitative uniqueness of human brain evolution revealed through phylogenetic comparative analysis
Miller, I. F., Barton, R. A., & Nunn, C. L. (2019) · eLife · doi:10.7554/elife.41250 · Cited by 70
Living on the edge: Was demographic weakness the cause of Neanderthal demise?
Degioanni, A., Bonenfant, C., Cabut, S., & Condémi, S. (2019) · PLoS ONE · doi:10.1371/journal.pone.0216742 · Cited by 72
Püschel, H. P., Bertrand, O., O’Reilly, J. E., Bobe, R. L., & Püschel, T. A. (2021) · Nature Ecology & Evolution · doi:10.1038/s41559-021-01431-1 · Cited by 67
A morphometric comparison of the parietal lobe in modern humans and Neanderthals
Pereira‐Pedro, A. S., Bruner, E., Gunz, P., & Neubauer, S. (2020) · Journal of Human Evolution · doi:10.1016/j.jhevol.2020.102770 · Cited by 61
Ríos, L., Kivell, T. L., Lalueza‐Fox, C., Estalrrich, A., García‐Tabernero, A., Huguet, R., Quintino, Y., de la Rasilla, M., & Rosas, A. (2019) · Scientific Reports · doi:10.1038/s41598-019-38571-1 · Cited by 56
Nakatani, H., Nakamura, Y., & Okanoya, K. (2022) · The Cerebellum · doi:10.1007/s12311-022-01451-y · Cited by 48
The Role of Geomagnetic Field Intensity in Late Quaternary Evolution of Humans and Large Mammals
Channell, J. E. T., & Vigliotti, L. (2019) · Reviews of Geophysics · doi:10.1029/2018rg000629 · Cited by 46
Craniofacial skeletal response to encephalization: How do we know what we think we know?
Lesciotto, K. M., & Richtsmeier, J. T. (2019) · American Journal of Physical Anthropology · doi:10.1002/ajpa.23766 · Cited by 45
de Sousa, A. A., Beaudet, A., Calvey, T., Bardo, A., Benoît, J., Charvet, C. J., Dehay, C., Gómez‐Robles, A., Gunz, P., Heuer, K., et al. (2023) · Communications Biology · doi:10.1038/s42003-023-04803-4 · Cited by 39
Reconstructing Neanderthal diet: The case for carbohydrates
Hardy, K., Bocherens, H., Brand-Miller, J. C., & Copeland, L. (2021) · Journal of Human Evolution · doi:10.1016/j.jhevol.2021.103105 · Cited by 39
García-Martínez, D., Torres-Tamayo, N., Torres-Sánchez, I., García-Río, F., Rosas, A., & Bastir, M. (2018) · Communications Biology · doi:10.1038/s42003-018-0125-4 · Cited by 38
Self-citationPeeters, S., & Zwart, H. A. E. (2020) · History & Philosophy of the Life Sciences · doi:10.1007/s40656-020-00327-w · Cited by 40
The metopic suture: Natural history
Vinchon, M. (2019) · Neurochirurgie · doi:10.1016/j.neuchi.2019.09.006 · Cited by 30
Labra, N., Mounier, A., Leprince, Y., Rivière, D., Didier, M., Bardinet, É., Santin, M. D., Mangin, J., Filippo, A., Albessard‐Ball, L., et al. (2023) · Journal of Anatomy · doi:10.1111/joa.13966 · Cited by 29
Development and evolution of the primate neocortex from a progenitor cell perspective
Dehay, C., & Huttner, W. Β. (2024) · Development · doi:10.1242/dev.199797 · Cited by 30
Botha, R. P. (2020) · Cambridge University Press eBooks · doi:10.1017/9781108868167 · Cited by 32
Unraveling Human Brain Development and Evolution Using Organoid Models
Fernandes, S., Klein, D., & Marchetto, M. C. (2021) · Frontiers in Cell and Developmental Biology · doi:10.3389/fcell.2021.737429 · Cited by 27
Gregory, M. D., Eisenberg, D. P., Hamborg, M., Kippenhan, J. S., Kohn, P., Kolachana, B., Dickinson, D., & Berman, K. F. (2021) · American Journal of Medical Genetics Part B: Neuropsychiatric Genetics · doi:10.1002/ajmg.b.32872 · Cited by 24
Gregory, M. D., Kippenhan, J. S., Kohn, P. D., Eisenberg, D. P., Callicott, J. H., Kolachana, B. S., & Berman, K. F. (2020) · Brain Connectivity · doi:10.1089/brain.2020.0809 · Cited by 24
Nowell, A. (2023) · Annual Review of Anthropology · doi:10.1146/annurev-anthro-052621-024752 · Cited by 23
The cerebellar components of the human language network
Casto, C., Poliak, M., Tuckute, G., Small, H., Sherlock, P., Wolna, A., Lipkin, B., D’Mello, A. M., & Fedorenko, E. G. (2026) · Neuron · doi:10.1016/j.neuron.2025.12.030 · Cited by 30
Evolution of the modern human brain
Beaudet, A., Du, A., & Wood, B. A. (2019) · Progress in brain research · doi:10.1016/bs.pbr.2019.01.004 · Cited by 22
Hidden Depths: The Origins of Human Connection
Spikins, P. (2022) · White Rose University Press eBooks · doi:10.22599/hiddendepths · Cited by 19
Evolutionary and genomic perspectives of brain aging and neurodegenerative diseases
Dames, B. A. R., Kilili, H., Charvet, C. J., Díaz-Barba, K., Proulx, M. J., de Sousa, A. A., & Urrutia, A. O. (2023) · Progress in brain research · doi:10.1016/bs.pbr.2022.10.004 · Cited by 18
A network approach to the topological organization of the Brodmann map
Bruner, E. (2022) · The Anatomical Record · doi:10.1002/ar.24941 · Cited by 17
Zug, R., & Uller, T. (2022) · Evolutionary Human Sciences · doi:10.1017/ehs.2022.42 · Cited by 16
Measuring ancient technological complexity and its cognitive implications using Petri nets
Fajardo, S., Kozowyk, P. R. B., & Langejans, G. H. J. (2023) · Scientific Reports · doi:10.1038/s41598-023-42078-1 · Cited by 14
Molecular archaeology of human cognitive traits
Kaczanowska, J., Ganglberger, F., Chernomor, O., Kargl, D., Gálik, B., Heß, A., Moodley, Y., von Haeseler, A., Bühler, K., & Haubensak, W. E. (2022) · Cell Reports · doi:10.1016/j.celrep.2022.111287 · Cited by 15
What made us “hunter-gatherers of words”
Boeckx, C. A. (2023) · Frontiers in Neuroscience · doi:10.3389/fnins.2023.1080861 · Cited by 15
Evolutionary mechanisms modulating the mammalian skull development
Kyomen, S., Murillo‐Rincón, A. P., & Kaucká, M. (2023) · Philosophical Transactions of the Royal Society B Biological Sciences · doi:10.1098/rstb.2022.0080 · Cited by 15
Scaling Palaeolithic tar production processes exponentially increases behavioural complexity
Kozowyk, P. R. B., Fajardo, S., & Langejans, G. H. J. (2023) · Scientific Reports · doi:10.1038/s41598-023-41963-z · Cited by 14
Peñaherrera‐Aguirre, M., Sarraf, M. A., Menie, M. A. W. O., & Miller, G. F. (2023) · Intelligence · doi:10.1016/j.intell.2023.101795 · Cited by 14
Monson, T. A., Brasil, M. F., Mahaney, M. C., Schmitt, C. A., Taylor, C. E., & Hlusko, L. J. (2022) · Biology · doi:10.3390/biology11081218 · Cited by 14
Comparative anatomy and 3D geometric morphometrics of the El Sidrón atlases (C1)
Palancar, C. A., Torres‐Tamayo, N., García‐Martínez, D., García‐Tabernero, A., Rosas, A., & Bastir, M. (2020) · Journal of Human Evolution · doi:10.1016/j.jhevol.2020.102897 · Cited by 15
Self-citationRomagnoli, F. (2021) · Cambridge Archaeological Journal · doi:10.1017/s0959774320000384 · Cited by 13
Pearson, A., Polly, P. D., & Bruner, E. (2020) · American Journal of Physical Anthropology · doi:10.1002/ajpa.24053 · Cited by 11
Icex: Advances in the automatic extraction and volume calculation of cranial cavities
Buzi, C., Profico, A., Liang, C., Khonsari, R. H., O’Higgins, P., Moazen, M., & Harvati, K. (2023) · Journal of Anatomy · doi:10.1111/joa.13843 · Cited by 10
Bastir, M. (2019) · Bulletins et Mémoires de la Société d anthropologie de Paris · doi:10.3166/bmsap-2019-0055 · Cited by 10
Self-citationBeaudet, A., Holloway, R. L., & Benazzi, S. (2021) · Journal of Human Evolution · doi:10.1016/j.jhevol.2021.103010 · Cited by 10
Asymmetries of Cerebellar Lobe in the Genus Homo
Zhang, Y., & Wu, X. (2021) · Symmetry · doi:10.3390/sym13060988 · Cited by 9
Palaeoneurology and the Emergence of Language
Mounier, A., Noûs, C., & Balzeau, A. (2020) · Bulletins et Mémoires de la Société d anthropologie de Paris · doi:10.3166/bmsap-2020-0098 · Cited by 9
Did increasing brain size place early humans at risk of extinction?
Stibel, J. M. (2025) · Brain and Cognition · doi:10.1016/j.bandc.2025.106336 · Cited by 9
Neanderthal Language: Demystifying the Linguistic Powers of our Extinct Cousins
Botha, R. P. (2020) · Cited by 8
What Are the Synergies between Paleoanthropology and Brain Imaging?
Balzeau, A., & Mangin, J. (2021) · Symmetry · doi:10.3390/sym13101974 · Cited by 8
The Neanderthal brain: Biological and cognitive evolution
Macciardi, F. M., & Martini, F. (2022) · Elsevier eBooks · doi:10.1016/b978-0-12-821428-2.00008-1 · Cited by 8
The role of the cerebellum in creativity and expert stone knapping
Coolidge, F. L. (2020) · Adaptive Behavior · doi:10.1177/1059712320966462 · Cited by 7
The Superior Visual Perception Hypothesis: Neuroaesthetics of Cave Art
Фолгеро, П. О., Johansson, C., & Stokkedal, L. H. (2021) · Behavioral Sciences · doi:10.3390/bs11060081 · Cited by 7
Coolidge, F. L. (2020) · doi:10.1093/oso/9780190940942.001.0001 · Cited by 11
Insights into brain evolution through the genotype-phenotype connection
Ganapathee, D. S., & Gunz, P. (2023) · Progress in brain research · doi:10.1016/bs.pbr.2022.12.013 · Cited by 7
Palaeolithic toolmaking and the evolution of cognition and languagePreprint
Gabrić, P., Banda, M., & Karavanić, I. (2021) · PsyArXiv (OSF Preprints) · doi:10.31234/osf.io/ahp9u · Cited by 7
Virtually estimated endocranial volumes of the Krapina Neandertals
Cofran, Z., Boone, M., & Petticord, M. C. (2020) · American Journal of Physical Anthropology · doi:10.1002/ajpa.24165 · Cited by 5
The Expert Neandertal Mind and Brain, Revisited
Coolidge, F. L., Wynn, T., & Overmann, K. A. (2023) · Oxford University Press eBooks · doi:10.1093/oxfordhb/9780192895950.013.2 · Cited by 5
Li, H., & Xie, X. (2024) · Neuroscience · doi:10.1016/j.neuroscience.2024.11.077 · Cited by 5
Brain region-specific effects of nearly fixed sapiens-derived alleles
Andirkó, A., & Boeckx, C. A. (2022) · BMC Genomic Data · doi:10.1186/s12863-022-01048-8 · Cited by 4
Gabrić, P., Banda, M., & Karavanić, I. (2021) · PsyArXiv (OSF Preprints) · doi:10.21203/rs.3.rs-1212115/v1 · Cited by 4
Vicedomini, R., Righetti, N., Polit, L., Condémi, S., Longo, L., & Carbone, A. (2021) · bioRxiv (Cold Spring Harbor Laboratory) · doi:10.1101/2021.10.30.466563 · Cited by 5
Morphological evolution of the hominid brain
Bisconti, M., & Tartarelli, G. (2025) · Academia Biology · doi:10.20935/acadbiol7710 · Cited by 4
Brain vs. endocast: Does size differ? A unique experiment based on a cohort of 75 volunteers
Kubicka, A. M., Prima, S., Filippo, A., Giolland, V., Bardinet, É., Didier, M., Santin, M. D., & Balzeau, A. (2025) · Journal of Anatomy · doi:10.1111/joa.70032 · Cited by 3
The evolution of the parietal lobes in the genus Homo: the fossil evidence
Bruner, E. (2023) · Elsevier eBooks · doi:10.1016/b978-0-323-99193-3.00006-4 · Cited by 3
Amadei, A., Lin, G., & Fattorini, S. (2025) · Scientific Reports · doi:10.1038/s41598-025-22376-6 · Cited by 2
The Evolution of Brain and Body Size in Genus Homo
Monson, T. A., Weitz, A. P., & Brasil, M. F. (2026) · Humans · doi:10.3390/humans6020012 · Cited by 3
Social cognitive processes explain bias in juror decisions
Castrellon, J. J., Hakimi, S., Parelman, J. M., Yin, L., Law, J. R., Skene, J. H. P., Ball, D. A., Malekpour, A., Beskind, D. H., Vidmar, N. J., et al. (2022) · Social Cognitive and Affective Neuroscience · doi:10.1093/scan/nsac057 · Cited by 4
Neurobiología de sapiens y neandertales para su aplicación en la Arqueología Cognitiva
Capín, M. G. (2023) · SAGVNTVM Papeles del Laboratorio de Arqueología de Valencia · doi:10.7203/sagvntvm.55.26526 · Cited by 2
Learning Behaviors Among Neanderthals and Palaeolithic Modern Humans: An Introduction
Nishiaki, Y. A., & Jöris, O. (2019) · Replacement of neanderthals by modern humans series · doi:10.1007/978-981-13-8980-1_1 · Cited by 2
Paar, V., Vlahović, I., Rosandić, M., & Glunčić, M. (2021) · Progress in molecular and subcellular biology · doi:10.1007/978-3-030-74889-0_8 · Cited by 2
Hominin cognition: The null hypothesis
Stibbard‐Hawkes, D. N. E. (2025) · Behavioral and Brain Sciences · doi:10.1017/s0140525x24001055 · Cited by 1
Amano, H., Tanabe, H. C., & Ogihara, N. (2025) · Brain Structure and Function · doi:10.1007/s00429-025-02896-7 · Cited by 2
Self-citationA test of the Archaic Homo Introgression Hypothesis for the Chiari malformation type I
Plomp, K. A., Lewis, D. G., Buck, L. T., Bukhari, S., Rae, T. C., Gnanalingham, K. K., & Mark Collard, A. (2025) · Evolution Medicine and Public Health · doi:10.1093/emph/eoaf009 · Cited by 1
Multilevel innovativeness and cross-species comparisons
Ramsey, G., & Meneganzin, A. (2025) · European Journal for Philosophy of Science · doi:10.1007/s13194-025-00666-0 · Cited by 1
Balzeau, A., Bardinet, É., Bardo, A., Bernat, A.-L., Derrey, T., Didier, M., Filippo, A., Hui, J., Kubicka, A. M., Labra, N., et al. (2026) · Journal of Anatomy · doi:10.1111/joa.70101 · Cited by 2
Neanderthal brain and cognition reconsidered
Schoenemann, P. T., Holloway, R. L., Gao, J., & Yang, G. (2026) · Proceedings of the National Academy of Sciences · doi:10.1073/pnas.2426638123 · Cited by 1
de León, M. S. P., & Zollikofer, C. P. (2026) · Cambridge University Press eBooks · doi:10.1017/9781316756492.004 · Cited by 1
Self-citationBiophysical modeling of anatomically realistic prenatal cortical folding development
Hou, J., Wu, Z., Jiang, K., Wu, T., Zhang, L., Zhu, D., Gao, W., Razavi, M. J., Liu, T., Ellen Kuhl, A., et al. (2026) · Nature Communications · doi:10.1038/s41467-026-75582-9 · Cited by 2
The Evolution of Sleep and Dreams
Coolidge, F. L. (2020) · Oxford University Press eBooks · doi:10.1093/oso/9780190940942.003.0009 · Cited by 1
Long, K. R., & Huttner, W. Β. (2020) · Elsevier eBooks · doi:10.1016/b978-0-12-814405-3.00011-4 · Cited by 1
Zhou, W., Wu, J., Li, Y., Li, J., Sun, M., Li, R., Yang, C., Zhang, M., Gong, L., Yu, J., et al. (2023) · Cognitive Computation · doi:10.1007/s12559-023-10150-7 · Cited by 1
Postnatal interaction of size and shape in the human endocranium and brain structures
Takagi, K., & Kondo, O. (2025) · Journal of Anatomy · doi:10.1111/joa.70040 · Cited by 2
Self-citationNeural Underpinnings of Creative Thinking and Tool Use: A Meta-Analysis of Neuroimaging Data
Miura, N., Sasaki, Y., Hasegawa, K., & Tanabe, H. C. (2019) · Replacement of neanderthals by modern humans series · doi:10.1007/978-981-13-8980-1_2 · Cited by 1
Self-citationUse gesture instead of speech: Hand action and language evolution
Yin, R. (2020) · Advances in Psychological Science · doi:10.3724/sp.j.1042.2020.01141 · Cited by 1
van den Heuvel, M. P., & Danielle Posthuma, B. (2021) · Nature Genetics · doi:10.1038/s41588-021-00858-3 · Cited by 1
Andirkó, A., & Boeckx, C. A. (2019) · bioRxiv (Cold Spring Harbor Laboratory) · doi:10.1101/771816 · Cited by 2
Social cognitive processes explain bias in juror decisionsPreprint
Castrellon, J. J., Hakimi, S., Parelman, J. M., Yin, L., Law, J. R., Skene, J. A. G., Ball, D. A., Malekpour, A., Beskind, D. H., Vidmar, N. J., et al. (2021) · doi:10.31234/osf.io/v56wz · Cited by 1
Effects of introgressed Neanderthal alleles on present-day brain morphology
Zeloni, R., Amaolo, A., Morez Jacobs, A., Zapparoli, E., Akl, Y., Shafie, M., Huerta-Sanchez, E., Pizzagalli, F., Provero, P., Pagani, L., et al. (2026) · bioRxiv · doi:10.64898/2026.04.14.718380
“This divergence likely develops in the perinatal period 29 and is chiefly derived from a bulging cerebellum and parietal lobes, together with a smaller occipital lobe 25,27,28 .”
Impact of the Palaeolithic Toolmaking on the Evolution of Cognition and Language
Gabri, P., Banda, M., & Karavani, I. (2019) · International Journal of Computational Linguistics Research · doi:10.6025/jcl/2019/10/1/13-18
Molecular archaeology of the human brainPreprint
Kaczanowska, J., Ganglberger, F., Gálik, B., Heß, A., Moodley, Y., Bühler, K., & Haubensak, W. E. (2019) · bioRxiv (Cold Spring Harbor Laboratory) · doi:10.1101/598094
Characterization of an enhancer element that regulates FOXP2 expression in human cerebellumPreprint
Madurga, J., & Novo, F. J. (2019) · bioRxiv (Cold Spring Harbor Laboratory) · doi:10.1101/641597
Dec, O. (2019) · Folia Praehistorica Posnaniensia · doi:10.14746/fpp.2018.23.03
Kimura, T. (2019) · Anthropological Science (Japanese Series) · doi:10.1537/asj.191031
Coolidge, F. L. (2020) · Oxford University Press eBooks · doi:10.1093/oso/9780190940942.003.0005
Coolidge, F. L. (2020) · Oxford University Press eBooks · doi:10.1093/oso/9780190940942.003.0004
Coolidge, F. L. (2020) · Oxford University Press eBooks · doi:10.1093/oso/9780190940942.003.0003
Metadata
- Authors
- Kochiyama, T., Ogihara, N., Tanabe, H. C., Kondo, O., Amano, H., Hasegawa, K., Suzuki, H., Ponce de León, M. S., Zollikofer, C. P. E., Bastir, M., Stringer, C., Sadato, N., & Akazawa, T.
- Affiliations
- Advanced Telecommunications Research Institute International (JP)
- Keio University (JP)
- Nagoya University (JP)
- The University of Tokyo (JP)
- National Institute of Advanced Industrial Science and Technology (JP)
- University of Zurich (CH)
- Museo Nacional de Ciencias Naturales (ES)
- Natural History Museum (GB)
- National Institute for Physiological Sciences (JP)
- Kochi University of Technology (JP)
- Corresponding author
- Ogihara, Naomichi
- Tanabe, Hiroki C.
- ORCID
- Venue
- Scientific Reports
- Published
- 2018-04-26
- Volume
- 8
- Issue
- 1
- Pages
- 6296-6296
- ISSN
- 2045-2322 (ISSN-L)
- PMC
- PMC5919901
- OpenAlex
- W2801185600
- Cited by
- 156
- References
- 64
- Citations by year
- 2026: 11 · 2025: 12 · 2024: 5 · 2023: 18 · 2022: 16 · 2021: 21 · 2020: 50 · 2019: 20 · 2018: 3
- FWCI
- 99.55
- Type
- journal article
- Language
- en
- Open access
- gold
- doi.org
- Locations
- Scientific Reports (publishedVersion, cc-by)
- Europe PMC (PubMed Central) (publishedVersion, cc-by)
- PubMed Central (publishedVersion, cc-by)
- PubMed (publishedVersion)
- Zurich Open Repository and Archive (University of Zurich) (acceptedVersion, cc-by)
- DIGITAL.CSIC (Spanish National Research Council (CSIC)) (submittedVersion, cc-by)
- DOAJ (DOAJ: Directory of Open Access Journals) (submittedVersion)
- Natural History Museum, London (submittedVersion, cc-by)
- Zurich Open Repository and Archive (University of Zurich) (submittedVersion, cc-by)
- Zurich Open Repository and Archive (University of Zurich)
- Funders
- National Science Foundation (NS092988, 1U54MH091657)
- Harvard University
- Calleva Foundation
- Ministry of Education, Culture, Sports, Science and Technology (22101006, 22101007, 22101001)
- Universität Wien
- Tel Aviv University
- Muséum National d'Histoire Naturelle
- National Institutes of Health (5u54mh091657-05, 1U54‐MH‐091657)
- McDonnell Center for Systems Neuroscience (1U54MH091657)
- Japan Society for the Promotion of Science (15H01846, 17H06381, 16K16080)
- National Institute of Mental Health (U54-MH091657)
- National Institute of Neurological Disorders and Stroke (NS‐092988, 1U54MH091657, R24NS092988)
- NIH Blueprint for Neuroscience Research (NS092988, 1U54-MH-091657)
- Topics
- Social Sciences › Anthropology › Pleistocene-Era Hominins and Archaeology
- Life Sciences › Agricultural and Biological Sciences › Ecology, Evolution, Behavior and Systematics › Primate Behavior and Ecology
- Social Sciences › Psychology › Experimental and Cognitive Psychology › Evolutionary Psychology and Human Behavior
- Keywords
- Neanderthals, early Homo sapiens, cerebellum, cerebellar volume, computational neuroanatomy, cognitive flexibility, attention, language processing, episodic memory, working memory, Neanderthal replacement, human evolution
- MeSH terms
- Algorithms, Analysis of Variance, Animals, Anthropology, Cerebellum, Cognition, Fossils, Humans, Memory, Short-Term, Skull, Tomography Scanners, X-Ray Computed, Linear Models, Computational Biology, Imaging, Three-Dimensional, Executive Function, Climate Change, Neanderthals, Social Skills
About these checks
Registry, retraction, Cites and statistics results are computed, not judged, with one exception: a printed reference that no index lists is read once by a model before it counts as a citation error. Claims are extracted by a model and kept only when their quote appears verbatim in the text; each cited source is then checked, with a model’s help, for whether it says what the claim relies on. Those verdicts can be wrong — read the claim’s quote and the cited source before relying on one.
Statistics and arithmetic are recomputed, not judged.
Confidence bands are shown only for fields calibrated on our annotated test set. None is calibrated yet, so no band is shown.
What counts as a claim ›How we measure confidence ›How we check this ›
Are you an author, or do you see a problem with this page? Request a review
