

The DOI matches its Crossref record; 105 of the 105 references it cites were found in a registry or an index.
Neural cell adhesion molecule Negr1 deficiency in mouse results in structural brain endophenotypes and behavioral deviations related to psychiatric disorders
Open accessAbstract
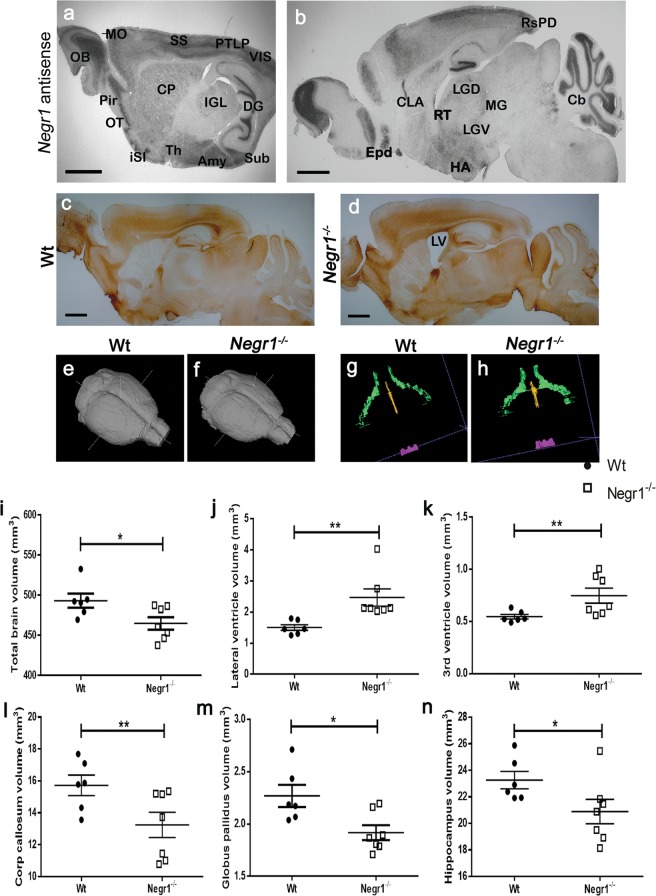
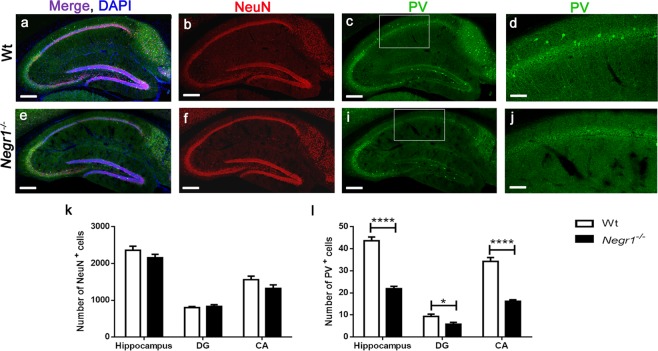
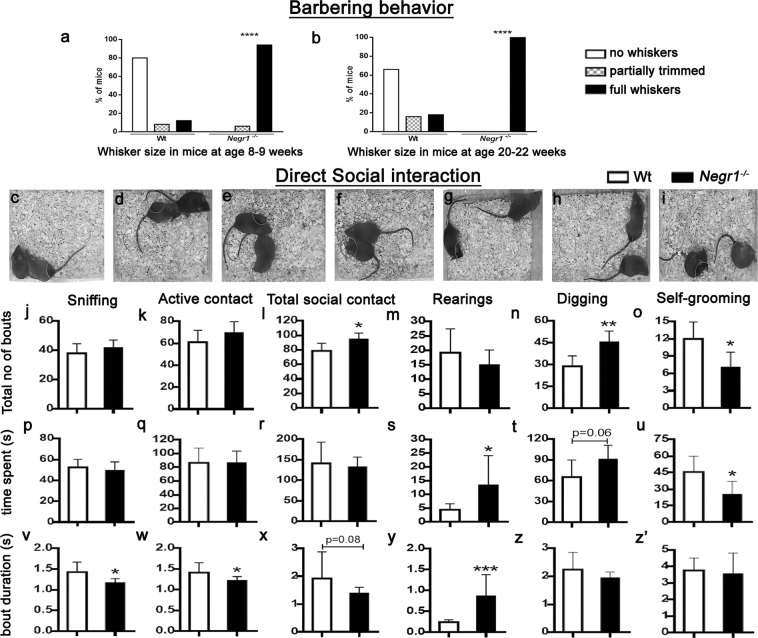
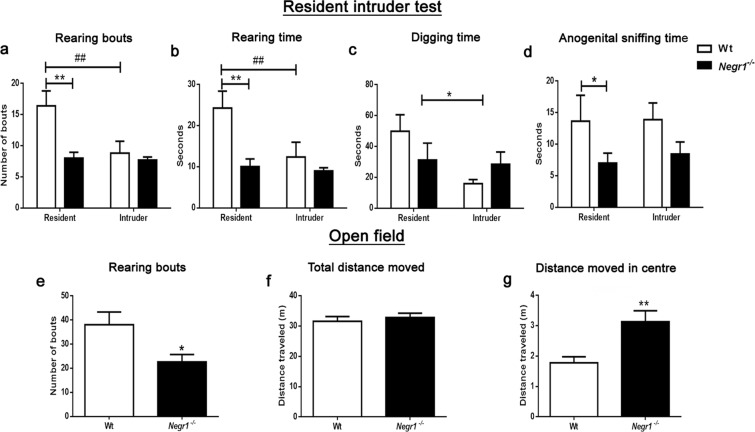
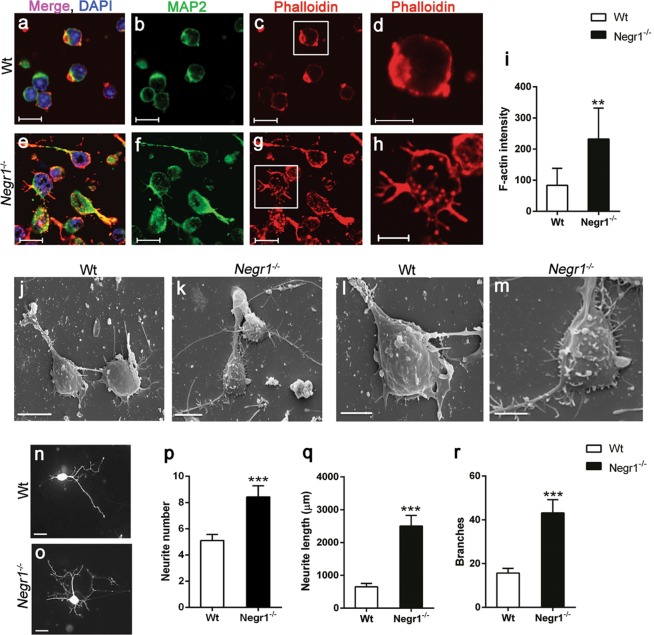
Neuronal growth regulator 1 (NEGR1) belongs to the immunoglobulin (IgLON) superfamily of cell adhesion molecules involved in cortical layering. Recent functional and genomic studies implicate the role of NEGR1 in a wide spectrum of psychiatric disorders, such as major depression, schizophrenia and autism. Here, we investigated the impact of Negr1 deficiency on brain morphology, neuronal properties and social behavior of mice. In situ hybridization shows Negr1 expression in the brain nuclei which are central modulators of cortical-subcortical connectivity such as the island of Calleja and the reticular nucleus of thalamus. Brain morphological analysis revealed neuroanatomical abnormalities in Negr1−/− mice, including enlargement of ventricles and decrease in the volume of the whole brain, corpus callosum, globus pallidus and hippocampus. Furthermore, decreased number of parvalbumin-positive inhibitory interneurons was evident in Negr1−/− hippocampi. Behaviorally, Negr1−/− mice displayed hyperactivity in social interactions and impairments in social hierarchy. Finally, Negr1 deficiency resulted in disrupted neurite sprouting during neuritogenesis. Our results provide evidence that NEGR1 is required for balancing the ratio of excitatory/inhibitory neurons and proper formation of brain structures, which is prerequisite for adaptive behavioral profiles. Therefore, Negr1−/− mice have a high potential to provide new insights into the neural mechanisms of neuropsychiatric disorders.
Overview
The claims and statistics of this paper haven’t been checked yet.
Run the check — free, no account needed. It reads the open-access text and checks the sources it cites.
Integrity signals
Registry
Cites
Statistics
Figures
Verification
Claims the paper makes
The claims and statistics of this paper haven’t been checked yet.
Run the check — free, no account needed. It reads the open-access text and checks the sources it cites.
Claims other papers make about this one
Each is checked against this paper’s own text: does it say what the citing paper says it does?
In the citing paper
“Negr −/− mice have shown irregularities in several brain regions, including reduced brain volume in the hippocampus and have also shown abnormalities in social behavior and non-social interest.20”
From Bi-ancestral depression GWAS in the Million Veteran Program and meta-analysis in >1.2 million individuals highlight new therapeutic directions (2021) · cites this paper as [20]
Self-check
Percentages, sums and reported differences re-computed from the paper’s own numbers.
The self-check needs the paper’s full text.
Citations
Cites
Biological insights from 108 schizophrenia-associated genetic loci
Schizophrenia Working Group of the Psychiatric Genomics Consortium (2014) · Nature · doi:10.1038/nature13595 · Cited by 7,577
Zhang, Y., Chen, K., Sloan, S. A., Bennett, M. L., Scholze, A. R., O'Keeffe, S., Phatnani, H. P., Guarnieri, P., Caneda, C., Ruderisch, N., et al. (2014) · The Journal of Neuroscience · doi:10.1523/jneurosci.1860-14.2014 · Cited by 4,875
Association analyses of 249,796 individuals reveal 18 new loci associated with body mass index
MAGIC, Speliotes, E. K., on behalf of Procardis Consortium, Willer, C. J., Berndt, S. I., Monda, K. L., Thorleifsson, G., Jackson, A. U., Allen, H. L., Lindgren, C. M., et al. (2010) · Nature Genetics · doi:10.1038/ng.686 · Cited by 2,912
Molecular anatomy of a trafficking organelle
Takamori, S., Holt, M., Stenius, K., Lemke, E. A., Grønborg, M., Riedel, D., Urlaub, H., Schenck, S., Brügger, B., Ringler, P., et al. (2006) · Cell · doi:10.1016/j.cell.2006.10.030 · Cited by 2,373
Genetic relationship between five psychiatric disorders estimated from genome-wide SNPs
Cross-Disorder Group of the Psychiatric Genomics Consortium (2013) · Nature Genetics · doi:10.1038/ng.2711 · Cited by 2,263
Thorleifsson, G., Walters, G. B., Gudbjartsson, D. F., Steinthorsdottir, V., Sulem, P., Helgadottir, A., Styrkarsdottir, U., Gretarsdottir, S., Thorlacius, S., Jonsdottir, I., et al. (2009) · Nature Genetics · doi:10.1038/ng.274 · Cited by 1,375
Shared molecular neuropathology across major psychiatric disorders parallels polygenic overlap
Gandal, M. J., Haney, J. R., Parikshak, N. N., Leppa, V., Ramaswami, G., Hartl, C., Schork, A. J., Appadurai, V., Buil, A., Werge, T. M., et al. (2018) · Science · doi:10.1126/science.aad6469 · Cited by 1,095
Neurobiology of rodent self-grooming and its value for translational neuroscience
Kalueff, A. V., Stewart, A. M., Song, C., Berridge, K. C., Graybiel, A. M., & Fentress, J. C. (2016) · Nature Reviews Neuroscience · doi:10.1038/nrn.2015.8 · Cited by 852
Hyde, C. L., Nagle, M. W., Tian, C., Chen, X., Paciga, S. A., Wendland, J. R., Tung, J. Y., Hinds, D. A., Perlis, R. H., & Winslow, A. R. (2016) · Nature Genetics · doi:10.1038/ng.3623 · Cited by 784
Marble burying reflects a repetitive and perseverative behavior more than novelty-induced anxiety
Thomas, A., Burant, A., Bui, N., Graham, D., Yuva-Paylor, L. A., & Paylor, R. (2009) · Psychopharmacology · doi:10.1007/s00213-009-1466-y · Cited by 698
Cited by
Sorted by citations
The genetics of obesity: From discovery to biology
Loos, R. J. F., & Yeo, G. S. H. (2022) · Nature Reviews Genetics · doi:10.1038/s41576-021-00414-z · Cited by 1,291
Levey, D. F., Stein, M. B., Wendt, F. R., Pathak, G. A., Zhou, H., Aslan, M., Quaden, R., Harrington, K. M., Nuñez, Y. Z., Overstreet, C., et al. (2021) · Nature Neuroscience · doi:10.1038/s41593-021-00860-2 · Cited by 422
Zhao, Y.-N., Cao, Y.-F., Zhang, Y.-H., Lu, Y., Ping, X., Qin, S.-K., Liu, S.-N., Chu, L., Sun, G.-Q., & Pei, L. (2020) · Evidence-Based Complementary and Alternative Medicine · doi:10.1155/2020/3056954 · Cited by 13
Metadata
- Authors
- Singh, K., Jayaram, M., Kaare, M., Leidmaa, E., Jagomäe, T., Heinla, I., Hickey, M. A., Kaasik, A., Schäfer, M. K., Innos, J., Lilleväli, K., Philips, M.-A., & Vasar, E.
- Affiliations
- University of Tartu (EE)
- University of Bonn (DE)
- UiT The Arctic University of Norway (NO)
- Johannes Gutenberg University Mainz (DE)
- Corresponding author
- Singh, Katyayani
- ORCID
- Venue
- Scientific Reports
- Published
- 2019-04-01
- Volume
- 9
- Issue
- 1
- Pages
- 5457-5457
- ISSN
- 2045-2322 (ISSN-L)
- PMC
- PMC6443666
- OpenAlex
- W2930826460
- Cited by
- 65
- References
- 105
- Citations by year
- 2026: 5 · 2025: 13 · 2024: 12 · 2023: 9 · 2022: 7 · 2021: 9 · 2020: 8 · 2019: 1
- FWCI
- 3.76
- Type
- journal article
- Language
- en
- Open access
- gold
- doi.org
- Locations
- Scientific Reports (publishedVersion, cc-by)
- Europe PMC (PubMed Central) (publishedVersion, cc-by)
- PubMed Central (publishedVersion, cc-by)
- PubMed (publishedVersion)
- DOAJ (DOAJ: Directory of Open Access Journals) (submittedVersion)
- NORA - Norwegian Open Research Archives (submittedVersion, other-oa)
- Funders
- European Commission (IUT20-41, 2014‐2020, 2020 ‘, 2014‐2020.4.01.15‐0012, HORIZON2020, 15-0012, 692202)
- Eesti Teadusagentuur (2014-2020, 2014-2020.4.01.15-0012, IUT20-41)
- European Regional Development Fund (IUT20-41, 2014-2020’, 2014-2020.4.01.15-0012, (Project No. 2014-2020.4.01.15-0012), 15-0012, No. 2014-2020.4.01.15-0012)
- Topics
- Life Sciences › Biochemistry, Genetics and Molecular Biology › Genetics › Genetics and Neurodevelopmental Disorders
- Life Sciences › Neuroscience › Cellular and Molecular Neuroscience › Neuroscience and Neuropharmacology Research
- Life Sciences › Neuroscience › Developmental Neuroscience › Neurogenesis and neuroplasticity mechanisms
- Keywords
- NEGR1, adhesion molecules, brain structure, neuroanatomical abnormalities, parvalbumin interneurons, excitation-inhibition balance, social behavior, hyperactivity, social hierarchy, neurite sprouting, neurite outgrowth, thalamic reticular nucleus, mental illness, schizophrenia, autism spectrum disorder, major depressive disorder
- MeSH terms
- Animals, Behavior, Animal, Mental Disorders, Brain, Cell Adhesion Molecules, Neuronal, Mice, Knockout, Mice, Endophenotypes
About these checks
Registry, retraction, Cites and statistics results are computed, not judged, with one exception: a printed reference that no index lists is read once by a model before it counts as a citation error. Claims are extracted by a model and kept only when their quote appears verbatim in the text; each cited source is then checked, with a model’s help, for whether it says what the claim relies on. Those verdicts can be wrong — read the claim’s quote and the cited source before relying on one.
Statistics and arithmetic are recomputed, not judged.
Confidence bands are shown only for fields calibrated on our annotated test set. None is calibrated yet, so no band is shown.
What counts as a claim ›How we measure confidence ›How we check this ›
Are you an author, or do you see a problem with this page? Request a review
