

The DOI matches its Crossref record; 4 of the 4 references it cites were found in a registry or an index.
Characterization of serum small extracellular vesicles and their small RNA contents across humans, rats, and mice.
Abstract
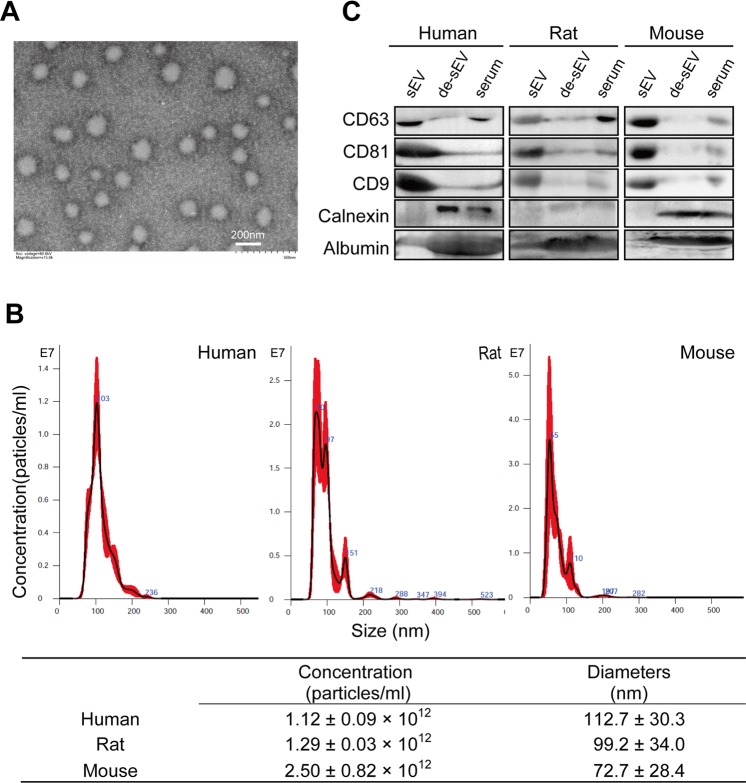
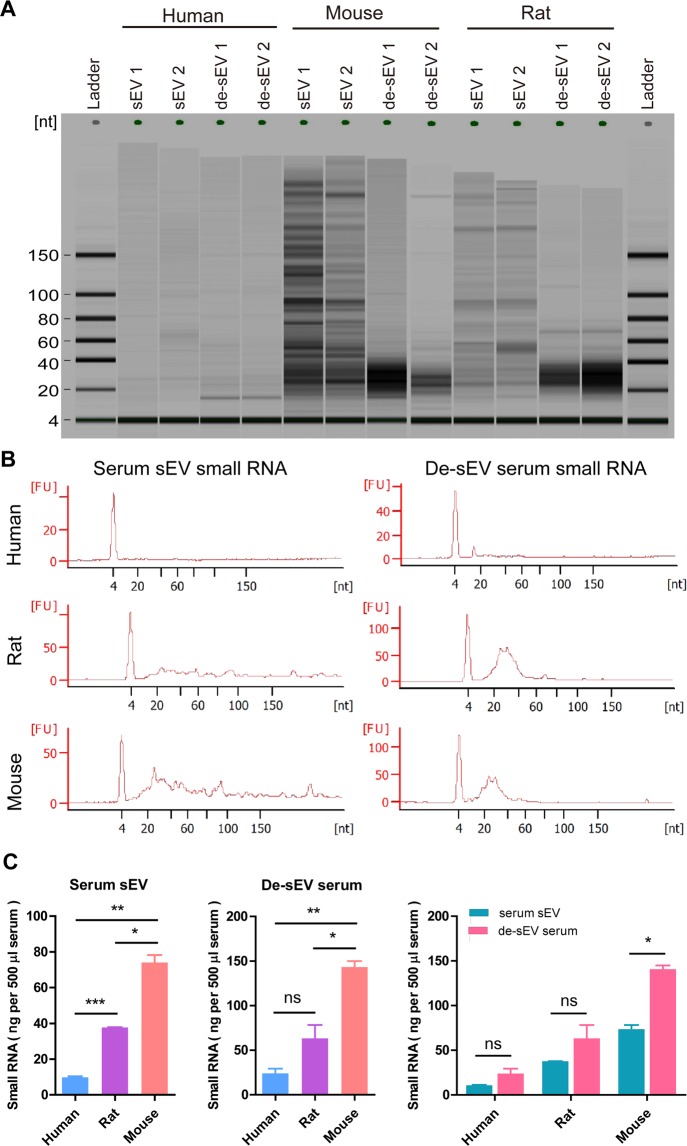
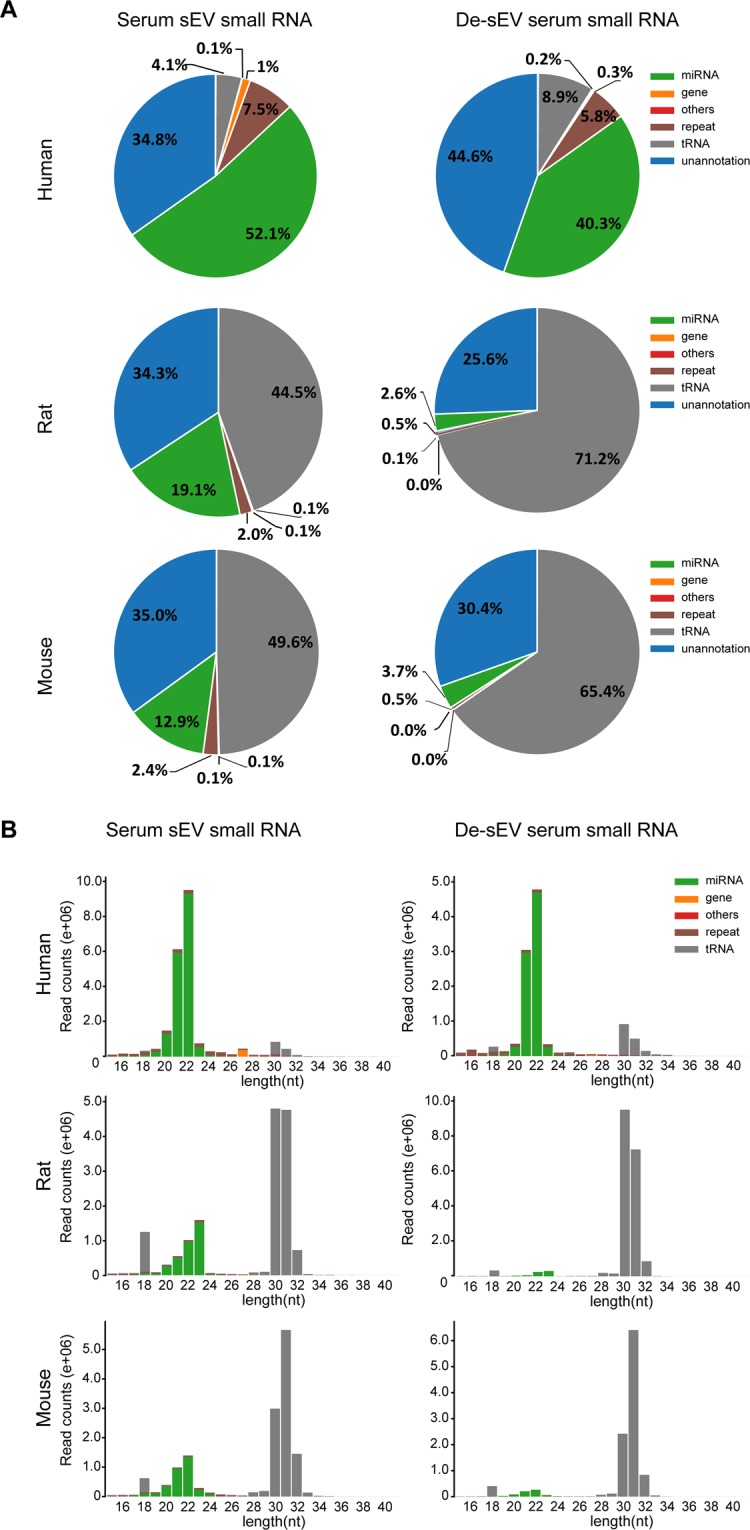
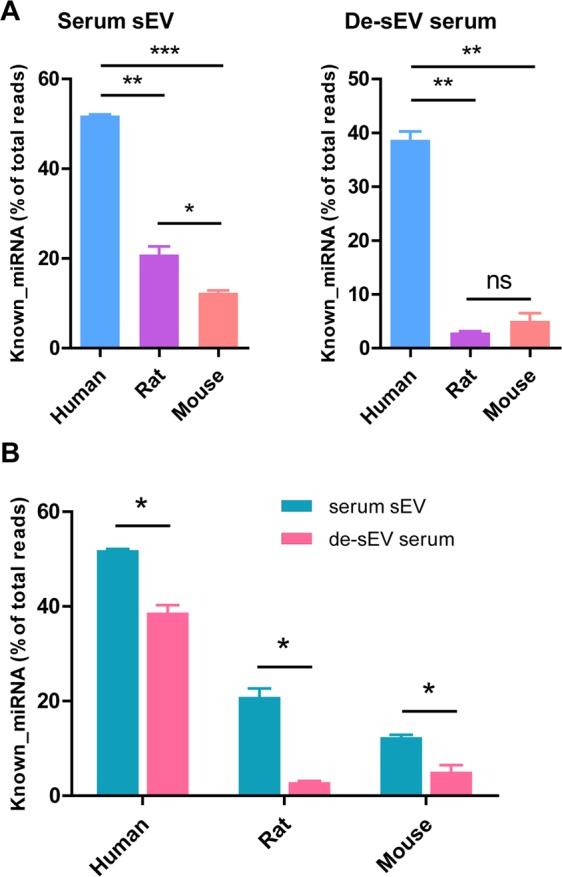
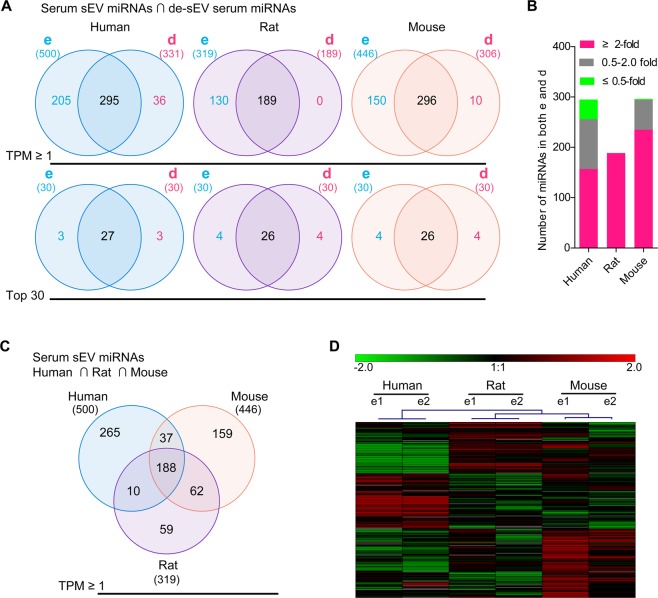
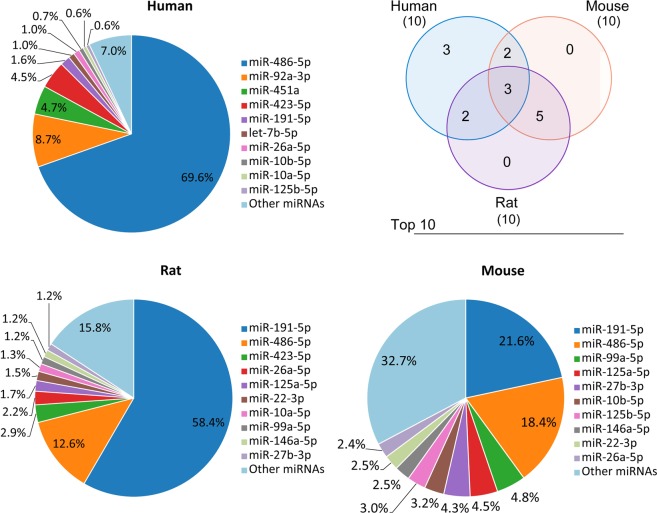
Serum small extracellular vesicles (sEVs) have recently drawn considerable interest because of the diagnostic and therapeutic potential of their miRNAs content. However, the characteristics of human, mouse and rat serum sEVs and their differences in small RNA contents are still unknown. In this study, through nanoparticle tracking analysis and small RNA sequencing, we found that human, rat, and mouse serum sEVs exhibited distinct sizes and particle numbers as well as small RNA contents. Serum sEVs contained not only abundant miRNAs but also a large number of tRNA fragments. Most serum miRNAs existed both inside and outside of sEVs but were enriched in sEVs. Common serum sEV miRNAs (188 miRNAs) and species-specific serum sEV miRNAs (265, 58, and 159 miRNAs, respectively) were identified in humans, rats, or mice. The serum sEVs contained miRNAs from tissues and organs throughout the body, with blood cells as the main contributors. In conclusion, our findings confirmed the rationality of exploring serum sEV miRNAs as noninvasive diagnostic markers and revealed great differences in serum sEV small RNAs between humans, rats, and mice. Inadequate attention to these differences and the contribution of blood cells to serum sEV miRNAs could hinder the clinical translation of basic studies.
Overview
The claims and statistics of this paper haven’t been checked yet.
Run the check — free, no account needed. It reads the open-access text and checks the sources it cites.
Integrity signals
Registry
Cites
Statistics
Figures
Verification
Claims the paper makes
The claims and statistics of this paper haven’t been checked yet.
Run the check — free, no account needed. It reads the open-access text and checks the sources it cites.
Claims other papers make about this one
Each is checked against this paper’s own text: does it say what the citing paper says it does?
In the citing paper
“Serum sEVs contain hundreds of miRNAs (Li X. et al., 2017; Zhao et al., 2020).”
From Acute Cerebral Ischemia Increases a Set of Brain-Specific miRNAs in Serum Small Extracellular Vesicles (2022) · cites this paper as Zhao et al., 2020
Self-check
Percentages, sums and reported differences re-computed from the paper’s own numbers.
The self-check needs the paper’s full text.
Citations
Cites
Johnstone, R. M., Adam, M., Hammond, J. R., Orr, L., & Turbide, C. (1987) · Journal of Biological Chemistry · doi:10.1016/s0021-9258(18)48095-7 · Cited by 2,931
Sperm tsRNAs contribute to intergenerational inheritance of an acquired metabolic disorder
Chen, Q., Yan, M., Cao, Z., Li, X., Zhang, Y., Shi, J., Feng, G.-H., Peng, H., Zhang, X., Zhang, Y., et al. (2016) · Science · doi:10.1126/science.aad7977 · Cited by 1,470
Body size, energy metabolism and lifespan
Speakman, J. R. (2005) · Journal of Experimental Biology · doi:10.1242/jeb.01556 · Cited by 914
Exosomes maintain cellular homeostasis by excreting harmful DNA from cells
Takahashi, A., Okada, R., Nagao, K., Kawamata, Y., Hanyu, A., Yoshimoto, S., Takasugi, M., Watanabe, S., Kanemaki, M. T., Obuse, C., et al. (2017) · Nature Communications · doi:10.1038/ncomms15287 · Cited by 761
Research works printed but not linked: 36
- Chen, X. et al. Characterization of microRNAs in serum: a novel class of biomarkers for diagnosis of cancer and other diseases. Cell research 18, 997–1006, https://doi.org/10.1038/cr.2008.282 (2008). · DOI · Paper page
- Valadi, H. et al. Exosome-mediated transfer of mRNAs and microRNAs is a novel mechanism of genetic exchange between cells. Nature cell biology 9, 654–659, https://doi.org/10.1038/ncb1596 (2007). · DOI · Paper page
- Cheng, L., Sharples, R. A., Scicluna, B. J. & Hill, A. F. Exosomes provide a protective and enriched source of miRNA for biomarker profiling compared to intracellular and cell-free blood. Journal of extracellular vesicles 3, https://doi.org/10.3402/jev.v3.23743 (2014). · DOI · Paper page
- Chen, F. et al. Effects of Focal Cerebral Ischemia on Exosomal Versus Serum miR126. Translational stroke research 6, 478–484, https://doi.org/10.1007/s12975-015-0429-3 (2015). · DOI
- Bala, S. et al. Circulating microRNAs in exosomes indicate hepatocyte injury and inflammation in alcoholic, drug-induced, and inflammatory liver diseases. Hepatology 56, 1946–1957, https://doi.org/10.1002/hep.25873 (2012). · DOI
- Saha, B. et al. Extracellular vesicles from mice with alcoholic liver disease carry a distinct protein cargo and induce macrophage activation through heat shock protein 90. Hepatology 67, 1986–2000, https://doi.org/10.1002/hep.29732 (2018). · DOI
- Mitchell, P. S. et al. Circulating microRNAs as stable blood-based markers for cancer detection. Proceedings of the National Academy of Sciences of the United States of America 105, 10513–10518, https://doi.org/10.1073/pnas.0804549105 (2008). · DOI · Paper page
- Thery, C. et al. Minimal information for studies of extracellular vesicles 2018 (MISEV2018): a position statement of the International Society for Extracellular Vesicles and update of the MISEV2014 guidelines. Journal of extracellular vesicles 7, 1535750, https://doi.org/10.1080/20013078.2018.1535750 (2018). · DOI · Paper page
- Vickers, K. C., Palmisano, B. T., Shoucri, B. M., Shamburek, R. D. & Remaley, A. T. MicroRNAs are transported in plasma and delivered to recipient cells by high-density lipoproteins. Nature cell biology 13, 423–433, https://doi.org/10.1038/ncb2210 (2011). · DOI · Paper page
- Arroyo, J. D. et al. Argonaute2 complexes carry a population of circulating microRNAs independent of vesicles in human plasma. Proceedings of the National Academy of Sciences of the United States of America 108, 5003–5008, https://doi.org/10.1073/pnas.1019055108 (2011). · DOI · Paper page
- Kuksa, P. P. et al. DASHR 2.0: integrated database of human small non-coding RNA genes and mature products. Bioinformatics 35, 1033–1039, https://doi.org/10.1093/bioinformatics/bty709 (2019). · DOI
- Minami, K. et al. miRNA expression atlas in male rat. Scientific data 1, 140005, https://doi.org/10.1038/sdata.2014.5 (2014). · DOI · Paper page
- Ji, Q. et al. Increased Brain-Specific MiR-9 and MiR-124 in the Serum Exosomes of Acute Ischemic Stroke Patients. PloS one 11, e0163645, https://doi.org/10.1371/journal.pone.0163645 (2016). · DOI
- Zhou, X. et al. Characterization of mouse serum exosomal small RNA content: The origins and their roles in modulating inflammatory response. Oncotarget 8, 42712–42727, https://doi.org/10.18632/oncotarget.17448 (2017). · DOI
- Buschmann, D. et al. Evaluation of serum extracellular vesicle isolation methods for profiling miRNAs by next-generation sequencing. Journal of extracellular vesicles 7, 1481321, https://doi.org/10.1080/20013078.2018.1481321 (2018). · DOI
- Raposo, G. & Stoorvogel, W. Extracellular vesicles: exosomes, microvesicles, and friends. The Journal of cell biology 200, 373–383, https://doi.org/10.1083/jcb.201211138 (2013). · DOI · Paper page
- Szabo, G. & Momen-Heravi, F. Extracellular vesicles in liver disease and potential as biomarkers and therapeutic targets. Nature reviews. Gastroenterology & hepatology 14, 455–466, https://doi.org/10.1038/nrgastro.2017.71 (2017). · DOI
- Vallabhajosyula, P. et al. Tissue-specific exosome biomarkers for noninvasively monitoring immunologic rejection of transplanted tissue. J. Clin. Invest. 127, 1375–1391, 87993 [pii]10.1172/JCI87993 (2017). · DOI
- Tian, F. et al. Aberrant miR-181b-5p and miR-486-5p expression in serum and tissue of non-small cell lung cancer. Gene 591, 338–343, https://doi.org/10.1016/j.gene.2016.06.014 (2016). · DOI
- Ji, X. et al. The Anti-fibrotic Effects and Mechanisms of MicroRNA-486-5p in Pulmonary Fibrosis. Scientific reports 5, 14131, https://doi.org/10.1038/srep14131 (2015). · DOI
- Regev, K. et al. Association Between Serum MicroRNAs and Magnetic Resonance Imaging Measures of Multiple Sclerosis Severity. JAMA neurology 74, 275–285, https://doi.org/10.1001/jamaneurol.2016.5197 (2017). · DOI · Paper page
- Cun, J. & Yang, Q. Bioinformatics-based interaction analysis of miR-92a-3p and key genes in tamoxifen-resistant breast cancer cells. Biomedicine & pharmacotherapy = Biomedecine & pharmacotherapie 107, 117–128, https://doi.org/10.1016/j.biopha.2018.07.158 (2018). · DOI
- Kong, R., Gao, J., Si, Y. & Zhao, D. Combination of circulating miR-19b-3p, miR-122-5p and miR-486-5p expressions correlates with risk and disease severity of knee osteoarthritis. American journal of translational research 9, 2852–2864 (2017).
- Li, C. et al. Serum miR-486-5p as a diagnostic marker in cervical cancer: with investigation of potential mechanisms. BMC cancer 18, 61, https://doi.org/10.1186/s12885-017-3753-z (2018). · DOI
- Anderson, P. & Ivanov, P. tRNA fragments in human health and disease. FEBS letters 588, 4297–4304, https://doi.org/10.1016/j.febslet.2014.09.001 (2014). · DOI · Paper page
- Garcia-Silva, M. R., Cabrera-Cabrera, F., Guida, M. C. & Cayota, A. Hints of tRNA-Derived Small RNAs Role in RNA Silencing Mechanisms. Genes 3, 603–614, https://doi.org/10.3390/genes3040603 (2012). · DOI
- Sobala, A. & Hutvagner, G. Small RNAs derived from the 5′ end of tRNA can inhibit protein translation in human cells. RNA biology 10, 553–563, https://doi.org/10.4161/rna.24285 (2013). · DOI · Paper page
- Maute, R. L. et al. tRNA-derived microRNA modulates proliferation and the DNA damage response and is down-regulated in B cell lymphoma. Proceedings of the National Academy of Sciences of the United States of America 110, 1404–1409, https://doi.org/10.1073/pnas.1206761110 (2013). · DOI
- Goodarzi, H. et al. Endogenous tRNA-Derived Fragments Suppress Breast Cancer Progression via YBX1 Displacement. Cell 161, 790–802, https://doi.org/10.1016/j.cell.2015.02.053 (2015). · DOI · Paper page
- Hanada, T. et al. CLP1 links tRNA metabolism to progressive motor-neuron loss. Nature 495, 474–480, https://doi.org/10.1038/nature11923 (2013). · DOI
- Selitsky, S. R. et al. Small tRNA-derived RNAs are increased and more abundant than microRNAs in chronic hepatitis B and C. Scientific reports 5, 7675, https://doi.org/10.1038/srep07675 (2015). · DOI
- Dhahbi, J. M. et al. 5′ tRNA halves are present as abundant complexes in serum, concentrated in blood cells, and modulated by aging and calorie restriction. BMC genomics 14, 298, https://doi.org/10.1186/1471-2164-14-298 (2013). · DOI
- Telonis, A. G. et al. Dissecting tRNA-derived fragment complexities using personalized transcriptomes reveals novel fragment classes and unexpected dependencies. Oncotarget 6, 24797–24822, https://doi.org/10.18632/oncotarget.4695 (2015). · DOI · Paper page
- Witwer, K. W. et al. Standardization of sample collection, isolation and analysis methods in extracellular vesicle research. Journal of extracellular vesicles 2, https://doi.org/10.3402/jev.v2i0.20360 [pii] (2013). · DOI
- Thery, C., Amigorena, S., Raposo, G. & Clayton, A. Isolation and characterization of exosomes from cell culture supernatants and biological fluids. Current protocols in cell biology / editorial board, Juan S. Bonifacino… [et al.] Chapter 3, Unit 3, 22, https://doi.org/10.1002/0471143030.cb0322s30 (2006). · DOI · Paper page
- Kumar, P., Mudunuri, S. B., Anaya, J. & Dutta, A. tRFdb: a database for transfer RNA fragments. Nucleic acids research 43, D141–145, https://doi.org/10.1093/nar/gku1138 (2015). · DOI
Cited by
Sorted by citations
Sikora, M., Śmieszek, A., & Marycz, K. (2021) · Journal of Cellular and Molecular Medicine · doi:10.1111/jcmm.16667 · Cited by 35
Zhou, X., Xu, C., Chao, D., Chen, Z., Li, S., Shi, M., Pei, Y., Dai, Y., Ji, J., Ji, Y., et al. (2022) · Frontiers in Molecular Neuroscience · doi:10.3389/fnmol.2022.874903 · Cited by 13
Self-citation
Metadata
- Authors
- Zhao, F., Cheng, L., Shao, Q., Chen, Z., Lv, X., Li, J., He, L., Sun, Y., Ji, Q., Lu, P., Ji, Y., & Ji, J.
- Venue
- Scientific Reports
- Published
- 2020-03-06
- Volume
- 10
- Issue
- 1
- ISSN
- 2045-2322
- PMC
- PMC7060188
- Cited by
- 45
- References
- 4
- Language
- en
- Funders
- National Natural Science Foundation of China (81201016, 81272027, 81761128018)
- Six Talents Peak Project of Jiangsu Province (2017-WSN-094)
- Natural Science Foundation of Jiangsu Province (BK20151277)
About these checks
Registry, retraction, Cites and statistics results are computed, not judged, with one exception: a printed reference that no index lists is read once by a model before it counts as a citation error. Claims are extracted by a model and kept only when their quote appears verbatim in the text; each cited source is then checked, with a model’s help, for whether it says what the claim relies on. Those verdicts can be wrong — read the claim’s quote and the cited source before relying on one.
Statistics and arithmetic are recomputed, not judged.
Confidence bands are shown only for fields calibrated on our annotated test set. None is calibrated yet, so no band is shown.
What counts as a claim ›How we measure confidence ›How we check this ›
Are you an author, or do you see a problem with this page? Request a review
