

The DOI matches its Crossref record; 4 of the 4 references it cites were found in a registry or an index.
MYCL promotes iPSC-like colony formation via MYC Box 0 and 2 domains
Open accessPublished version of a preprint
Abstract
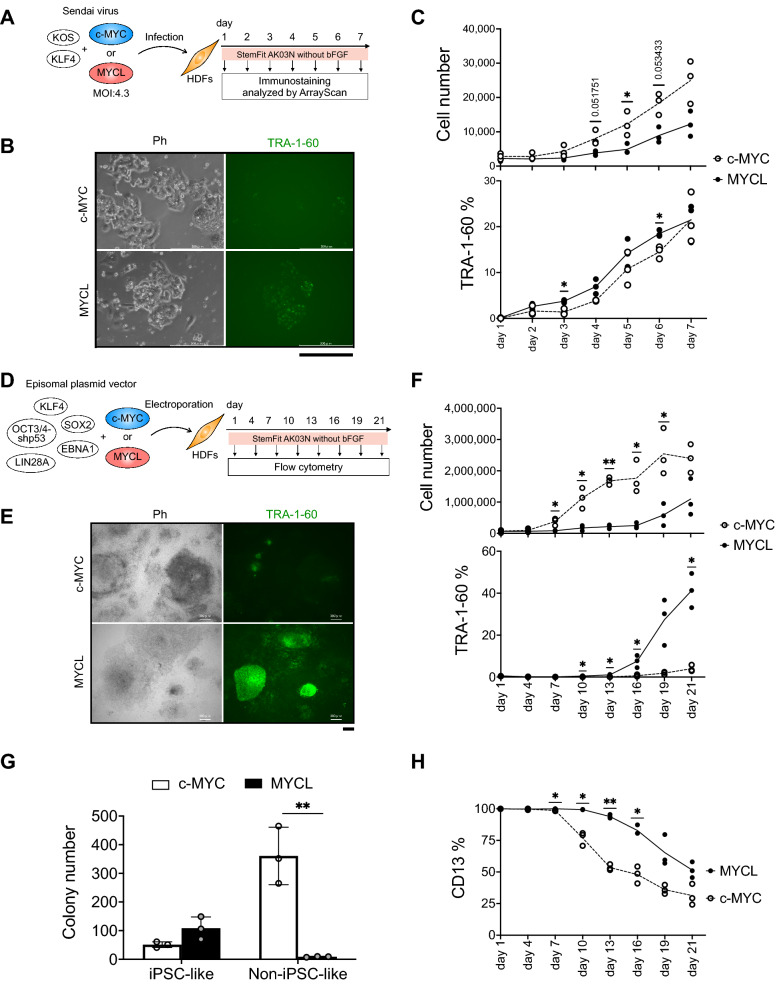
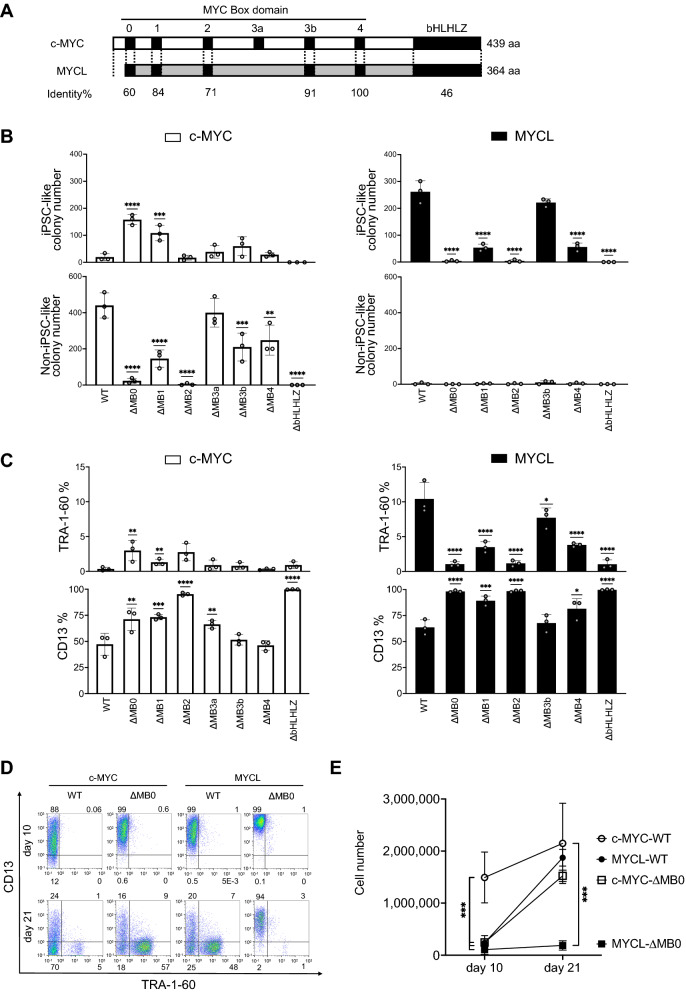
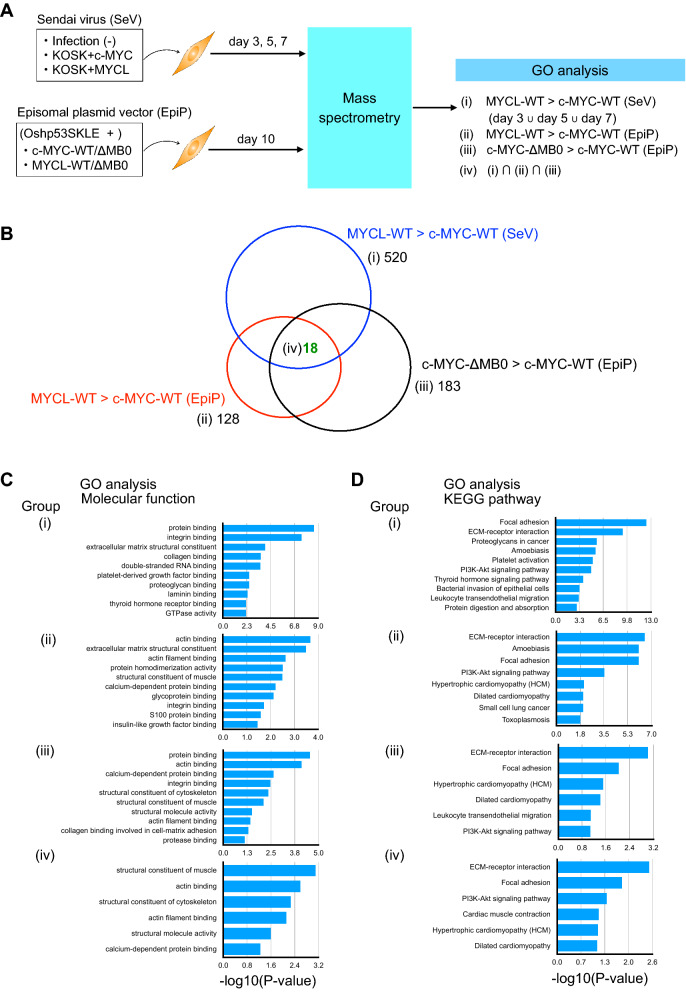
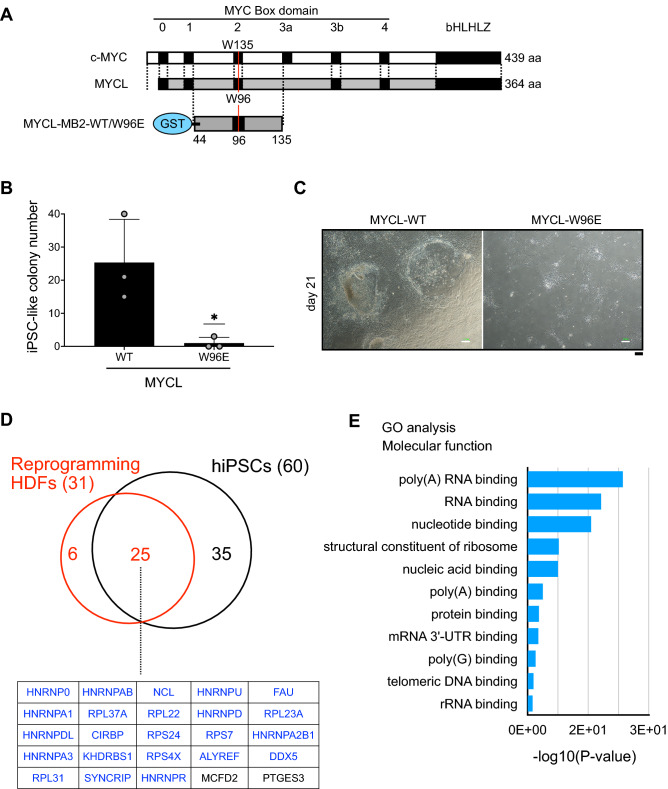
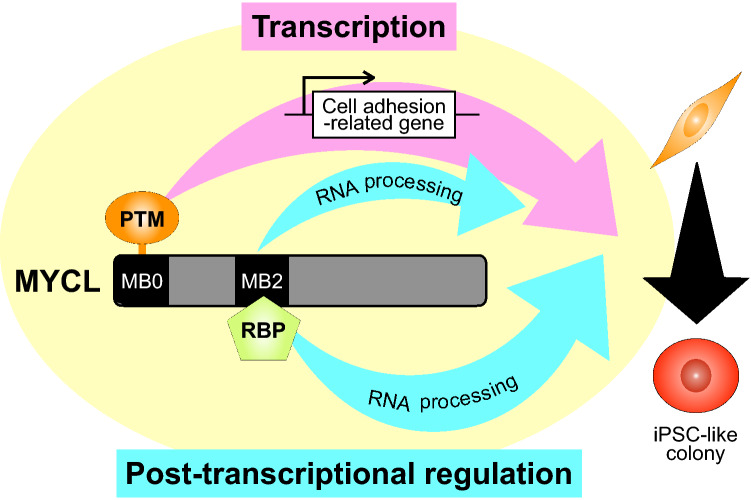
Human induced pluripotent stem cells (hiPSCs) can differentiate into cells of the three germ layers and are promising cell sources for regenerative medicine therapies. However, current protocols generate hiPSCs with low efficiency, and the generated iPSCs have variable differentiation capacity among different clones. Our previous study reported that MYC proteins (c-MYC and MYCL) are essential for reprogramming and germline transmission but that MYCL can generate hiPSC colonies more efficiently than c-MYC. The molecular underpinnings for the different reprogramming efficiencies between c-MYC and MYCL, however, are unknown. In this study, we found that MYC Box 0 (MB0) and MB2, two functional domains conserved in the MYC protein family, contribute to the phenotypic differences and promote hiPSC generation in MYCL-induced reprogramming. Proteome analyses suggested that in MYCL-induced reprogramming, cell adhesion-related cytoskeletal proteins are regulated by the MB0 domain, while the MB2 domain regulates RNA processes. These findings provide a molecular explanation for why MYCL has higher reprogramming efficiency than c-MYC.
Overview
The claims and statistics of this paper haven’t been checked yet.
Run the check — free, no account needed. It reads the open-access text and checks the sources it cites.
Integrity signals
Registry
Cites
Statistics
Figures
Verification
Claims the paper makes
The claims and statistics of this paper haven’t been checked yet.
Run the check — free, no account needed. It reads the open-access text and checks the sources it cites.
Self-check
Percentages, sums and reported differences re-computed from the paper’s own numbers.
The self-check needs the paper’s full text.
Citations
Cites
Global quantification of mammalian gene expression control
Schwanhäusser, B., Busse, D., Li, N., Dittmar, G., Schuchhardt, J., Wolf, J., Chen, W., & Selbach, M. (2011) · Nature · doi:10.1038/nature10098 · Cited by 6,566
Nakagawa, M., Taniguchi, Y., Senda, S., Takizawa, N., Ichisaka, T., Asano, K., Morizane, A., Doi, D., Takahashi, J., Nishizawa, M., et al. (2014) · Scientific Reports · doi:10.1038/srep03594 · Cited by 673
Target gene-independent functions of MYC oncoproteins
Baluapuri, A., Wolf, E., & Eilers, M. (2020) · Nature Reviews Molecular Cell Biology · doi:10.1038/s41580-020-0215-2 · Cited by 310
Xing, Q. R., El Farran, C. A., Gautam, P., Chuah, Y. S., Warrier, T., Toh, C. X. D., Kang, N. Y., Sugii, S., Chang, Y. T., Xu, J., et al. (2020) · Science Advances · doi:10.1126/sciadv.aba1190 · Cited by 51
Research works printed but not linked: 41
- Takahashi, K. & Yamanaka, S. Induction of pluripotent stem cells from mouse embryonic and adult fibroblast cultures by defined factors. Cell 126, 663–676 (2006). · DOI · Paper page
- Takahashi, K. et al. Induction of pluripotent stem cells from adult human fibroblasts by defined factors. Cell 131, 861–872 (2007). · DOI · Paper page
- Azuma, K. & Yamanaka, S. Recent policies that support clinical application of induced pluripotent stem cell-based regenerative therapies. Regen. Ther. 4, 36–47 (2016). · DOI · Paper page
- Huang, C.-Y. et al. Human iPSC banking: barriers and opportunities. J. Biomed. Sci. 26, 87 (2019). · DOI
- Moradi, S. et al. Research and therapy with induced pluripotent stem cells (iPSCs): social, legal, and ethical considerations. Stem Cell Res. Ther. 10, 341 (2019). · DOI
- Koyanagi-Aoi, M. et al. Differentiation-defective phenotypes revealed by large-scale analyses of human pluripotent stem cells. Proc. Natl. Acad. Sci. 110, 20569–20574 (2013). · DOI
- Nakagawa, M., Takizawa, N., Narita, M., Ichisaka, T. & Yamanaka, S. Promotion of direct reprogramming by transformation-deficient Myc. Proc. Natl. Acad. Sci. 107, 14152–14157 (2010). · DOI
- Varmus, H. E. The molecular genetics of cellular oncogenes. Annu. Rev. Genet. 18, 553–612 (1984). · DOI
- Oster, S. K., Mao, D. Y. L., Kennedy, J. & Penn, L. Z. Functional analysis of the N-terminal domain of the Myc oncoprotein. Oncogene 22, 1998–2010 (2003). · DOI
- Beaulieu, M.-E., Castillo, F. & Soucek, L. Structural and biophysical insights into the function of the intrinsically disordered myc oncoprotein. Cells 9, 1038 (2020). · DOI
- Amati, B. et al. Transcriptional activation by the human c-Myc oncoprotein in yeast requires interaction with Max. Nature 359, 423–426 (1992). · DOI
- Zhang, Q. et al. MB0 and MBI are independent and distinct transactivation domains in MYC that are essential for transformation. Genes 8, 134 (2017). · DOI
- Kalkat, M. et al. MYC protein interactome profiling reveals functionally distinct regions that cooperate to drive tumorigenesis. Mol. Cell 72, 836-848.e7 (2018). · DOI
- Fusaki, N., Ban, H., Nishiyama, A., Saeki, K. & Hasegawa, M. Efficient induction of transgene-free human pluripotent stem cells using a vector based on Sendai virus, an RNA virus that does not integrate into the host genome. Proc. Jpn. Acad. Ser. B 85, 348–362 (2009). · DOI · Paper page
- Tanabe, K., Nakamura, M., Narita, M., Takahashi, K. & Yamanaka, S. Maturation, not initiation, is the major roadblock during reprogramming toward pluripotency from human fibroblasts. Proc. Natl. Acad. Sci. 110, 12172–12179 (2013). · DOI
- Okita, K. et al. A more efficient method to generate integration-free human iPS cells. Nat. Methods 8, 409–412 (2011). · DOI · Paper page
- Wolf, E. & Eilers, M. Targeting MYC proteins for tumor therapy. Annu. Rev. Cancer Biol. 4, 61–75 (2020). · DOI
- Huang, D. W., Sherman, B. T. & Lempicki, R. A. Systematic and integrative analysis of large gene lists using DAVID bioinformatics resources. Nat. Protoc. 4, 44–57 (2009). · DOI · Paper page
- Huang, D. W., Sherman, B. T. & Lempicki, R. A. Bioinformatics enrichment tools: paths toward the comprehensive functional analysis of large gene lists. Nucl. Acids Res. 37, 1–13 (2009). · DOI · Paper page
- Wasylishen, A. R. et al. New model systems provide insights into Myc-induced transformation. Oncogene 30, 3727–3734 (2011). · DOI
- Okita, K., Ichisaka, T. & Yamanaka, S. Generation of germline-competent induced pluripotent stem cells. Nature 448, 313–317 (2007). · DOI
- Yu, J. et al. Induced pluripotent stem cell lines derived from human somatic cells. Science 318, 1917–1920 (2007). · DOI · Paper page
- Sone, M. et al. Hybrid cellular metabolism coordinated by Zic3 and Esrrb synergistically enhances induction of naive pluripotency. Cell Metab. 25, 1103-1117.e6 (2017). · DOI
- Maekawa, M. et al. Direct reprogramming of somatic cells is promoted by maternal transcription factor Glis1. Nature 474, 225–229 (2011). · DOI
- Zahn-Zabal, M. et al. The neXtProt knowledgebase in 2020: data, tools and usability improvements. Nucl. Acids Res. 48, D328–D334 (2020).
- Rodriguez-Boulan, E. & Macara, I. G. Organization and execution of the epithelial polarity programme. Nat. Rev. Mol. Cell Biol. 15, 225–242 (2014). · DOI
- Li, R. et al. A mesenchymal-to-epithelial transition initiates and is required for the nuclear reprogramming of mouse fibroblasts. Cell Stem Cell 7, 51–63 (2010). · DOI · Paper page
- Sakurai, K. et al. Kinome-wide functional analysis highlights the role of cytoskeletal remodeling in somatic cell reprogramming. Cell Stem Cell 14, 523–534 (2014). · DOI
- Pei, D., Shu, X., Gassama-Diagne, A. & Thiery, J. P. Mesenchymal–epithelial transition in development and reprogramming. Nat. Cell Biol. 21, 44–53 (2019). · DOI
- Bonomi, S. et al. HnRNP A1 controls a splicing regulatory circuit promoting mesenchymal-to-epithelial transition. Nucl. Acids Res. 41, 8665–8679 (2013). · DOI
- Price, D. H. Regulation of RNA polymerase II elongation by c-Myc. Cell 141, 399–400 (2010). · DOI
- Welcker, M. et al. The Fbw7 tumor suppressor regulates glycogen synthase kinase 3 phosphorylation-dependent c-Myc protein degradation. Proc. Natl. Acad. Sci. 101, 9085–9090 (2004). · DOI
- Tamkun, J. W. et al. Structure of integrin, a glycoprotein involved in the transmembrane linkage between fibronectin and actin. Cell 46, 271–282 (1986). · DOI
- Hynes, R. Integrins: A family of cell surface receptors. Cell 48, 549–554 (1987). · DOI
- Närvä, E. et al. A strong contractile actin fence and large adhesions direct human pluripotent colony morphology and adhesion. Stem Cell Rep. 9, 67–76 (2017). · DOI
- Santoro, R., Perrucci, G. L., Gowran, A. & Pompilio, G. Unchain My heart: integrins at the basis of iPSC cardiomyocyte differentiation. Stem Cells Int. 2019, 1–20 (2019). · DOI
- Hansson, J. et al. Highly coordinated proteome dynamics during reprogramming of somatic cells to pluripotency. Cell Rep. 2, 1579–1592 (2012). · DOI · Paper page
- Ohta, S., Nishida, E., Yamanaka, S. & Yamamoto, T. Global splicing pattern reversion during somatic cell reprogramming. Cell Rep. 5, 357–366 (2013). · DOI
- Kanehisa, M. & Goto, S. KEGG: Kyoto encyclopedia of genes and genomes. Nucleic Acids Res. 28, 27–30 (2000). · DOI · Paper page
- Kanehisa, M. Toward understanding the origin and evolution of cellular organisms. Protein Sci. 28, 1947–1951 (2019). · DOI · Paper page
- Kanehisa, M., Furumichi, M., Sato, Y., Ishiguro-Watanabe, M. & Tanabe, M. KEGG: integrating viruses and cellular organisms. Nucl. Acids Res. 49, D545–D551 (2021). · DOI · Paper page
Metadata
- Authors
- Akifuji, C., Iwasaki, M., Kawahara, Y., Sakurai, C., Cheng, Y.-S., Imai, T., & Nakagawa, M.
- Affiliations
- Kyoto University (JP)
- Corresponding author
- Nakagawa, Masato
- Venue
- Scientific Reports
- Published
- 2021-12-20
- Volume
- 11
- Issue
- 1
- Pages
- 24254-24254
- ISSN
- 2045-2322 (ISSN-L)
- PMC
- PMC8688507
- OpenAlex
- W4226025092
- Cited by
- 3
- References
- 4
- Citations by year
- 2025: 1 · 2024: 1 · 2023: 1
- FWCI
- 0.16
- Type
- journal article
- Language
- en
- Open access
- gold
- doi.org
- Locations
- Scientific Reports (publishedVersion, cc-by)
- PubMed Central (publishedVersion, cc-by)
- PubMed (publishedVersion)
- DOAJ (DOAJ: Directory of Open Access Journals) (submittedVersion, cc-by-sa)
- Funders
- Japan Agency for Medical Research and Development (JP21bm0104001)
- Topics
- Life Sciences › Biochemistry, Genetics and Molecular Biology › Molecular Biology › Pluripotent Stem Cells Research
- Life Sciences › Biochemistry, Genetics and Molecular Biology › Molecular Biology › Developmental Biology and Gene Regulation
- Life Sciences › Neuroscience › Developmental Neuroscience › Neurogenesis and neuroplasticity mechanisms
- Keywords
- MYCL, induced pluripotent stem cells, reprogramming efficiency, c-Myc, cell adhesion, cytoskeletal proteins, RNA processing, proteomics
- MeSH terms
- Protein Domains, Cell Adhesion, Cell Differentiation, Cells, Cultured, Flow Cytometry, Humans, Mutation, Phenotype, Recombinant Proteins, Proto-Oncogene Proteins c-myc, Gene Deletion, Cell Culture Techniques, Proteome, Proteomics, Induced Pluripotent Stem Cells, Cellular Reprogramming
About these checks
Registry, retraction, Cites and statistics results are computed, not judged, with one exception: a printed reference that no index lists is read once by a model before it counts as a citation error. Claims are extracted by a model and kept only when their quote appears verbatim in the text; each cited source is then checked, with a model’s help, for whether it says what the claim relies on. Those verdicts can be wrong — read the claim’s quote and the cited source before relying on one.
Statistics and arithmetic are recomputed, not judged.
Confidence bands are shown only for fields calibrated on our annotated test set. None is calibrated yet, so no band is shown.
What counts as a claim ›How we measure confidence ›How we check this ›
Are you an author, or do you see a problem with this page? Request a review
