

The DOI matches its Crossref record; 72 of the 76 references it cites were found in a registry or an index.
The influence of the respiratory cycle on reaction times in sensory-cognitive paradigms
Open accessPublished version of a preprint
Abstract
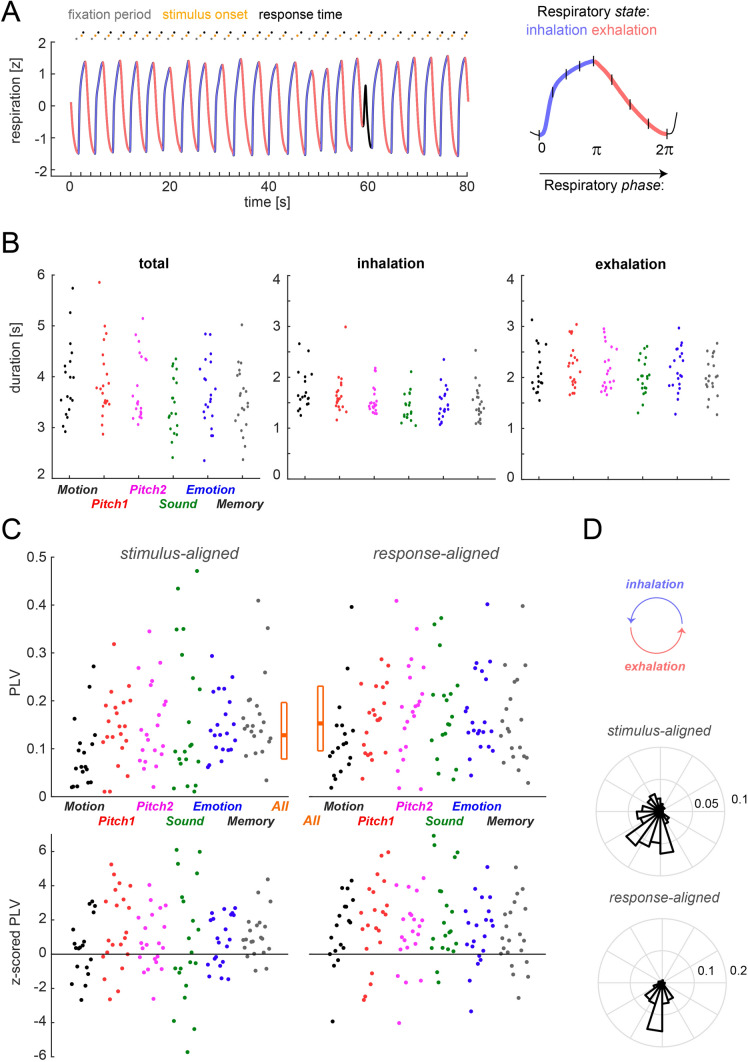
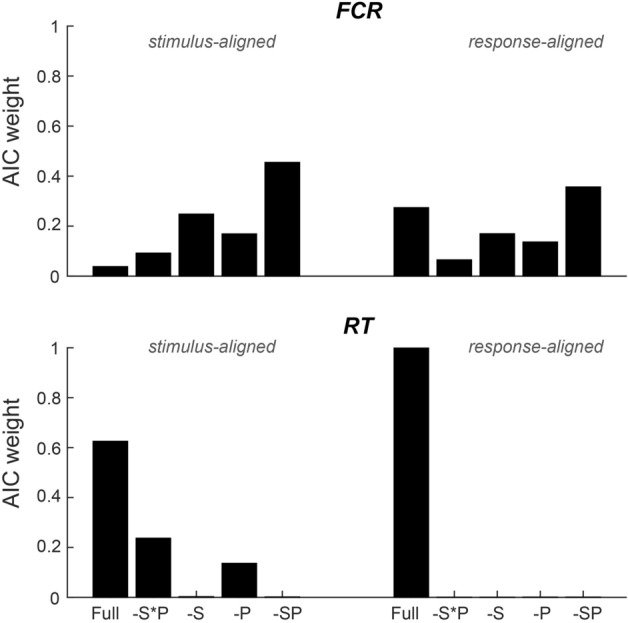
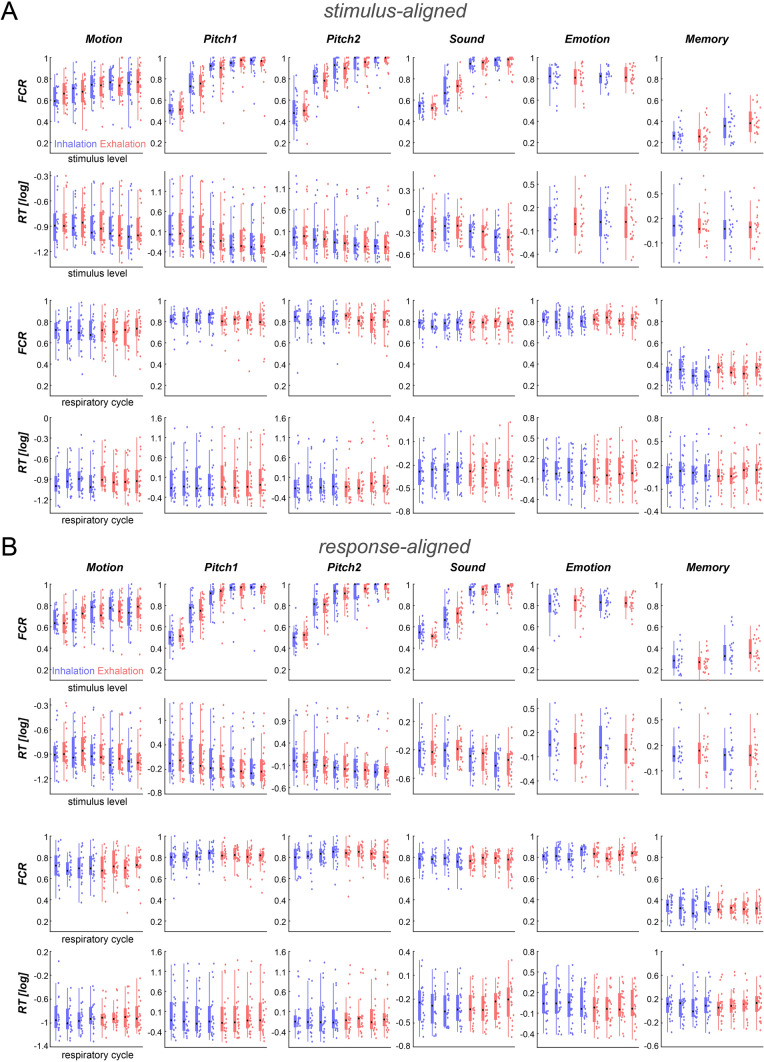
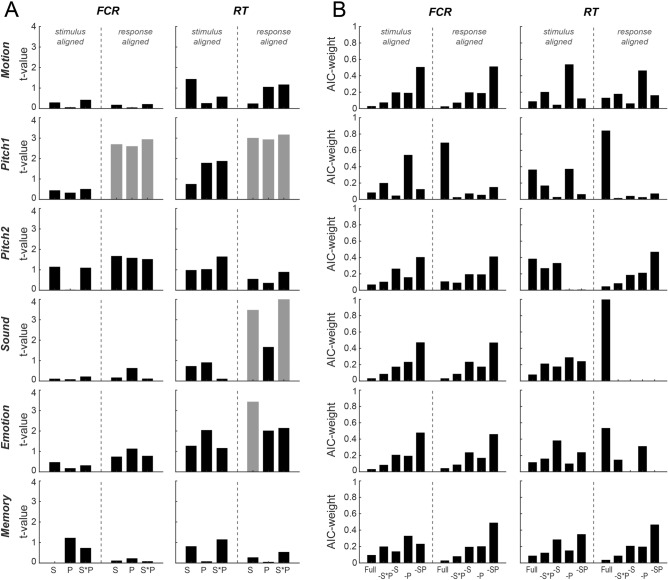
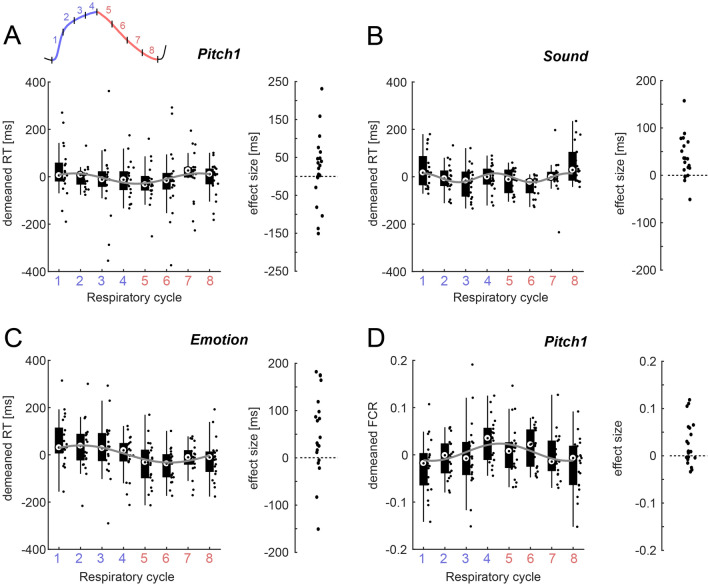
Behavioural and electrophysiological studies point to an apparent influence of the state of respiration, i.e., whether we inhale or exhale, on brain activity and cognitive performance. Still, the prevalence and relevance of such respiratory-behavioural relations in typical sensory-cognitive tasks remain unclear. We here used a battery of six tasks probing sensory detection, discrimination and short-term memory to address the questions of whether and by how much behaviour covaries with the respiratory cycle. Our results show that participants tend to align their respiratory cycle to the experimental paradigm, in that they tend to inhale around stimulus presentation and exhale when submitting their responses. Furthermore, their reaction times, but not so much their response accuracy, consistently and significantly covary with the respiratory cycle, differing between inhalation and exhalation. This effect is strongest when analysed contingent on the respiratory state around participants’ responses. The respective effect sizes of these respiration-behaviour relations are comparable to those seen in other typical experimental manipulations in sensory-cognitive tasks, highlighting the relevance of these effects. Overall, our results support a prominent relation between respiration and sensory-cognitive function and show that sensation is intricately linked to rhythmic bodily or interoceptive functions.
Overview
The claims and statistics of this paper haven’t been checked yet.
Run the check — free, no account needed. It reads the open-access text and checks the sources it cites.
Integrity signals
Registry
Cites
Statistics
Figures
Verification
Claims the paper makes
The claims and statistics of this paper haven’t been checked yet.
Run the check — free, no account needed. It reads the open-access text and checks the sources it cites.
Claims other papers make about this one
Each is checked against this paper’s own text: does it say what the citing paper says it does?
The cited source says what the claim attributes to it.
In the citing paper
“Reaction times in various auditory and visual tasks vary along the respiratory cycle 145 .”
From Interoceptive rhythms in the brain (2023) · cites this paper as [145]
Self-check
Percentages, sums and reported differences re-computed from the paper’s own numbers.
The self-check needs the paper’s full text.
Citations
Cites
Controlling the False Discovery Rate: A Practical and Powerful Approach to Multiple Testing
Benjamini, Y., & Hochberg, Y. (1995) · Journal of the Royal Statistical Society Series B: Statistical Methodology · doi:10.1111/j.2517-6161.1995.tb02031.x · Cited by 109,482
Oostenveld, R., Fries, P., Maris, E., & Schoffelen, J.-M. (2011) · Computational Intelligence and Neuroscience · doi:10.1155/2011/156869 · Cited by 10,323
Simmons, J. P., Nelson, L. D., & Simonsohn, U. (2011) · Psychological Science · doi:10.1177/0956797611417632 · Cited by 6,567
Alpha-band oscillations, attention, and controlled access to stored information
Klimesch, W. (2012) · Trends in Cognitive Sciences · doi:10.1016/j.tics.2012.10.007 · Cited by 3,310
CircStat : A MATLAB Toolbox for Circular Statistics
Berens, P. (2009) · Journal of Statistical Software · doi:10.18637/jss.v031.i10 · Cited by 3,099
AIC model selection using Akaike weights
Wagenmakers, E.-J., & Farrell, S. (2004) · Psychonomic Bulletin & Review · doi:10.3758/bf03206482 · Cited by 2,684
Introduction to Robust Estimation and Hypothesis Testing
Wilcox, R. R. (2012) · Elsevier eBooks · doi:10.1016/c2010-0-67044-1 · Cited by 2,086
Thut, G., Nietzel, A., Brandt, S., & Pascual-Leone, Á. (2006) · Journal of Neuroscience · doi:10.1523/jneurosci.0875-06.2006 · Cited by 1,662
Ebner, N. C., Riediger, M., & Lindenberger, U. (2010) · Behavior Research Methods · doi:10.3758/brm.42.1.351 · Cited by 1,262
On the computational architecture of the neocortex: II The role of cortico-cortical loops
Mumford, D. (1992) · Biological Cybernetics · doi:10.1007/bf00198477 · Cited by 1,074
Lo, S., & Andrews, S. (2015) · Frontiers in Psychology · doi:10.3389/fpsyg.2015.01171 · Cited by 1,057
Mechanisms of mindfulness: emotion regulation following a focused breathing induction
Arch, J. J., & Craske, M. G. (2006) · Behaviour Research and Therapy · doi:10.1016/j.brat.2005.12.007 · Cited by 1,005
BERNTSON, G. G., CACIOPPO, J. T., & QUIGLEY, K. S. (1993) · Psychophysiology · doi:10.1111/j.1469-8986.1993.tb01731.x · Cited by 998
On the computational architecture of the neocortex: I. The role of the thalamo-cortical loop
Mumford, D. (1991) · Biological Cybernetics · doi:10.1007/bf00202389 · Cited by 929
Szucs, D., & Ioannidis, J. P. A. (2017) · PLOS Biology · doi:10.1371/journal.pbio.2000797 · Cited by 761
Haegens, S., Nácher, V., Luna, R., Romo, R., & Jensen, O. (2011) · Proceedings of the National Academy of Sciences · doi:10.1073/pnas.1117190108 · Cited by 738
Del Negro, C. A., Funk, G. D., & Feldman, J. L. (2018) · Nature Reviews Neuroscience · doi:10.1038/s41583-018-0003-6 · Cited by 663
Spontaneous EEG oscillations reveal periodic sampling of visual attention
Busch, N. A., & VanRullen, R. (2010) · Proceedings of the National Academy of Sciences · doi:10.1073/pnas.1004801107 · Cited by 615
Nasal Respiration Entrains Human Limbic Oscillations and Modulates Cognitive Function
Zelano, C., Jiang, H., Zhou, G., Arora, N., Schuele, S., Rosenow, J., & Gottfried, J. A. (2016) · The Journal of Neuroscience · doi:10.1523/jneurosci.2586-16.2016 · Cited by 599
Emotions and respiratory patterns: review and critical analysis
Boiten, F. A., Frijda, N. H., & Wientjes, C. J. E. (1994) · International Journal of Psychophysiology · doi:10.1016/0167-8760(94)90027-2 · Cited by 462
Breathing rhythms and emotions
Homma, I., & Masaoka, Y. (2008) · Experimental Physiology · doi:10.1113/expphysiol.2008.042424 · Cited by 444
Frequency modulation entrains slow neural oscillations and optimizes human listening behavior
Henry, M. J., & Obleser, J. (2012) · Proceedings of the National Academy of Sciences · doi:10.1073/pnas.1213390109 · Cited by 436
Computation of measures of effect size for neuroscience data sets
Hentschke, H., & Stüttgen, M. C. (2011) · European Journal of Neuroscience · doi:10.1111/j.1460-9568.2011.07902.x · Cited by 421
Breathing above the brain stem: volitional control and attentional modulation in humans
Herrero, J. L., Khuvis, S., Yeagle, E., Cerf, M., & Mehta, A. D. (2018) · Journal of Neurophysiology · doi:10.1152/jn.00551.2017 · Cited by 338
Respiration-Entrained Brain Rhythms Are Global but Often Overlooked
Tort, A. B. L., Brankačk, J., & Draguhn, A. (2018) · Trends in Neurosciences · doi:10.1016/j.tins.2018.01.007 · Cited by 335
Lying takes time: A meta-analysis on reaction time measures of deception.
Suchotzki, K., Verschuère, B., Bockstaele, B. V., Ben‐Shakhar, G., & Crombez, G. (2017) · Psychological Bulletin · doi:10.1037/bul0000087 · Cited by 309
Spontaneous Neural Oscillations Bias Perception by Modulating Baseline Excitability
Iemi, L., Chaumon, M., Crouzet, S. M., & Busch, N. A. (2016) · Journal of Neuroscience · doi:10.1523/jneurosci.1432-16.2016 · Cited by 291
Wilcox, R. (2012) · Elsevier eBooks · doi:10.1016/b978-0-12-386983-8.00001-9 · Cited by 289
Heart–brain interactions shape somatosensory perception and evoked potentials
Al, E., Iliopoulos, F., Forschack, N., Nierhaus, T., Grund, M., Motyka, P., Gaebler, M., Nikulin, V. V., & Villringer, A. (2020) · Proceedings of the National Academy of Sciences · doi:10.1073/pnas.1915629117 · Cited by 276
Breathing as a fundamental rhythm of brain function.
Heck, D. H., McAfee, S. S., Liu, Y., Babajani-Feremi, A., Rezaie, R., Freeman, W. J., Wheless, J. W., Papanicolaou, A. C., Ruszinkó, M., Sokolov, Y., et al. (2017) · Frontiers in Neural Circuits · doi:10.3389/fncir.2016.00115 · Cited by 272
Foster, J. J., Sutterer, D., Serences, J. T., Vogel, E. K., & Awh, E. (2017) · Psychological Science · doi:10.1177/0956797617699167 · Cited by 266
Focus of attention modulates the heartbeat evoked potential
Petzschner, F. H., Weber, L. A., Wellstein, K. V., Paolini, G., Do, C. T., & Stephan, K. E. (2019) · NeuroImage · doi:10.1016/j.neuroimage.2018.11.037 · Cited by 248
Montoya, P., Schandry, R., & Müller, A. (1993) · Electroencephalography and Clinical Neurophysiology/Evoked Potentials Section · doi:10.1016/0168-5597(93)90001-6 · Cited by 239
Correction of respiratory artifacts in MRI head motion estimates
Fair, D. A., Miranda-Domínguez, Ó., Snyder, A. Z., Perrone, A. J., Earl, E., Van, A. N., Koller, J. M., Feczko, E., Tisdall, M. D., van der Kouwe, A. J. W., et al. (2019) · NeuroImage · doi:10.1016/j.neuroimage.2019.116400 · Cited by 226
Beyond differences in means: robust graphical methods to compare two groups in neuroscience
Rousselet, G. A., Pernet, C. R., & Wilcox, R. R. (2017) · European Journal of Neuroscience · doi:10.1111/ejn.13610 · Cited by 225
Human non-olfactory cognition phase-locked with inhalation
Perl, O., Ravia, A., Rubinson, M., Eisen, A., Soroka, T., Mor, N., Secundo, L., & Sobel, N. (2019) · Nature Human Behaviour · doi:10.1038/s41562-019-0556-z · Cited by 220
Moreno-Martínez, F. J., & Montoro, P. R. (2012) · PLoS ONE · doi:10.1371/journal.pone.0037527 · Cited by 204
ELAN: A Software Package for Analysis and Visualization of MEG, EEG, and LFP Signals
Aguera, P., Jerbi, K., Caclin, A., & Bertrand, O. (2011) · Computational Intelligence and Neuroscience · doi:10.1155/2011/158970 · Cited by 185
Parallel detection of theta and respiration-coupled oscillations throughout the mouse brain
Tort, A. B. L., Ponsel, S., Jessberger, J., Yanovsky, Y., Brankačk, J., & Draguhn, A. (2018) · Scientific Reports · doi:10.1038/s41598-018-24629-z · Cited by 169
Breathing is coupled with voluntary action and the cortical readiness potential
Park, H.-D., Barnoud, C., Trang, H., Kannape, O. A., Schaller, K., & Blanke, O. (2020) · Nature Communications · doi:10.1038/s41467-019-13967-9 · Cited by 157
The role of interoceptive inference in theory of mind
Ondobaka, S., Kilner, J. M., & Friston, K. J. (2015) · Brain and Cognition · doi:10.1016/j.bandc.2015.08.002 · Cited by 155
Rhythms of the body, rhythms of the brain: Respiration, neural oscillations, and embodied cognition
Varga, S., & Heck, D. H. (2017) · Consciousness and Cognition · doi:10.1016/j.concog.2017.09.008 · Cited by 151
Respiration modulates oscillatory neural network activity at rest
Kluger, D. S., & Gross, J. (2021) · PLOS Biology · doi:10.1371/journal.pbio.3001457 · Cited by 148
Sigh rate and respiratory variability during mental load and sustained attention.
Vlemincx, E., Taelman, J., De Peuter, S., Van Diest, I., & Van Den Bergh, O. (2011) · Psychophysiology · doi:10.1111/j.1469-8986.2010.01043.x · Cited by 142
Slow-waves in the olfactory system: an olfactory perspective on cortical rhythms
Fontanini, A., & Bower, J. M. (2006) · Trends in Neurosciences · doi:10.1016/j.tins.2006.06.013 · Cited by 130
Beynel, L., Appelbaum, L. G., Luber, B. M., Crowell, C. A., Hilbig, S. A., Lim, W., Nguyên, D. T., Chrapliwy, N. A., Davis, S. W., Cabeza, R. E. L., et al. (2019) · Neuroscience & Biobehavioral Reviews · doi:10.1016/j.neubiorev.2019.08.018 · Cited by 125
Respiration modulates olfactory memory consolidation in humans.
Arshamian, A., Iravani, B., Majid, A., & Lundström, J. N. (2018) · The Journal of Neuroscience · doi:10.1523/jneurosci.3360-17.2018 · Cited by 115
Active sampling in visual search is coupled to the cardiac cycle
Galvez-Pol, A., McConnell, R., & Kilner, J. M. (2020) · Cognition · doi:10.1016/j.cognition.2019.104149 · Cited by 95
Noto, T., Zhou, G., Schuele, S., Templer, J. W., & Zelano, C. (2018) · Chemical Senses · doi:10.1093/chemse/bjy045 · Cited by 92
Respiratory modulation of cognitive performance during the retrieval process
Nakamura, N. H., Fukunaga, M., & Oku, Y. (2018) · PLOS ONE · doi:10.1371/journal.pone.0204021 · Cited by 88
Meta-analysis of the effects of transcranial direct current stimulation on inhibitory control
Schroeder, P. A., Schwippel, T., Wolz, I., & Svaldi, J. (2020) · Brain stimulation · doi:10.1016/j.brs.2020.05.006 · Cited by 85
Prestimulus influences on auditory perception from sensory representations and decision processes
Kayser, S. J., McNair, S. W., & Kayser, C. (2016) · Proceedings of the National Academy of Sciences · doi:10.1073/pnas.1524087113 · Cited by 85
Self-citationDepth and phase of respiration modulate cortico-muscular communication
Kluger, D. S., & Groß, J. (2020) · NeuroImage · doi:10.1016/j.neuroimage.2020.117272 · Cited by 72
Kayser, C., Wilson, C. A., Safaai, H., Sakata, S., & Panzeri, S. (2015) · Journal of Neuroscience · doi:10.1523/jneurosci.0268-15.2015 · Cited by 70
Self-citationVoluntary Breathing Influences Corticospinal Excitability of Nonrespiratory Finger Muscles
Li, S., & Rymer, W. Z. (2010) · Journal of Neurophysiology · doi:10.1152/jn.00946.2010 · Cited by 60
How to monitor breathing in laboratory rodents: a review of the current methods
Grimaud, J., & Murthy, V. N. (2018) · Journal of Neurophysiology · doi:10.1152/jn.00708.2017 · Cited by 56
Huijbers, W., Pennartz, C. M. A., Beldzik, E., Domagalik, A., Vinck, M. A., Hofman, W. F., Cabeza, R. E. L., & Daselaar, S. M. (2014) · Human Brain Mapping · doi:10.1002/hbm.22523 · Cited by 54
Influences of ventilation on maximal isometric force of the finger flexors
Li, S., & Laskin, J. (2006) · Muscle & Nerve · doi:10.1002/mus.20592 · Cited by 54
Azzalini, D., Buot, A., Palminteri, S., & Tallon-Baudry, C. (2021) · The Journal of Neuroscience · doi:10.1523/jneurosci.1932-20.2021 · Cited by 47
Commentary: Respiration-Entrained Brain Rhythms Are Global but Often Overlooked
Corcoran, A. W., Pezzulo, G., & Hohwy, J. (2018) · Frontiers in Systems Neuroscience · doi:10.3389/fnsys.2018.00025 · Cited by 45
Respiratory phase and visual signal detection
Flexman, J. E., Demaree, R. G., & Simpson, D. D. (1974) · Perception & Psychophysics · doi:10.3758/bf03203952 · Cited by 44
Assessing Attentional Control of Breathing by Reaction Time
Gallego, J., Perruchet, P., & Camus, J. (1991) · Psychophysiology · doi:10.1111/j.1469-8986.1991.tb00413.x · Cited by 36
Alpha Activity Reflects the Magnitude of an Individual Bias in Human Perception
Grabot, L., & Kayser, C. (2020) · Journal of Neuroscience · doi:10.1523/jneurosci.2359-19.2020 · Cited by 35
Self-citationSlow-paced inspiration regularizes alpha phase dynamics in the human brain
Hsu, S., Tseng, C., Hsieh, C.-H., & Hsieh, C.-W. (2019) · Journal of Neurophysiology · doi:10.1152/jn.00624.2019 · Cited by 31
Correction of respiratory artifacts in MRI head motion estimatesPreprint
Fair, D. A., Miranda-Domínguez, Ó., Snyder, A. Z., Perrone, A. J., Earl, E., Van, A. N., Koller, J. M., Feczko, E., Klein, R. L., Mirro, A. E., et al. (2018) · bioRxiv (Cold Spring Harbor Laboratory) · doi:10.1101/337360 · Cited by 28
Myllylä, T., Zacharias, N., Korhonen, V. O., Zienkiewicz, A., Hinrichs, H., Kiviniemi, V. J., & Walter, M. (2017) · Scientific Reports · doi:10.1038/s41598-017-00293-7 · Cited by 21
Respiration Gates Sensory Input Responses in the Mitral Cell Layer of the Olfactory Bulb
Short, S. M., Morse, T. M., McTavish, T. S., Shepherd, G. M., & Verhagen, J. V. (2016) · PLoS ONE · doi:10.1371/journal.pone.0168356 · Cited by 12
Respiration aligns perception with neural excitabilityPreprint
Kluger, D. S., Balestrieri, E., Busch, N. A., & Groß, J. (2021) · bioRxiv (Cold Spring Harbor Laboratory) · doi:10.1101/2021.03.25.436938 · Cited by 10
Active sampling in visual search is coupled to the cardiac cycle
Galvez-Pol, A., McConnell, R., & Kilner, J. (2019) · UCL Discovery (University College London) · Cited by 9
Respiration competes with theta for modulating parietal cortex neuronsPreprint
Jung, F., Yanovsky, Y., Brankačk, J., Tort, A. B. L., & Draguhn, A. (2019) · bioRxiv (Cold Spring Harbor Laboratory) · doi:10.1101/707331 · Cited by 5
Circadian fluctuations in glucocorticoid level predict perceptual discrimination sensitivityPreprint
Obleser, J., Kreitewolf, J., Vielhauer, R., Lindner, F., David, C., Oster, H., & Tune, S. (2020) · bioRxiv (Cold Spring Harbor Laboratory) · doi:10.1101/2020.10.07.330282 · Cited by 2
Cited by
Sorted by citations
Interoceptive rhythms in the brain
Engelen, T., Solcà, M., & Tallon-Baudry, C. (2023) · Nature Neuroscience · doi:10.1038/s41593-023-01425-1 · Cited by 207
Respiratory rhythms of the predictive mind.
Allen, M., Varga, S., & Heck, D. H. (2023) · Psychological Review · doi:10.1037/rev0000391 · Cited by 114
Cognitive processing of a common stimulus synchronizes brains, hearts, and eyes
Madsen, J., & Parra, L. C. (2022) · PNAS Nexus · doi:10.1093/pnasnexus/pgac020 · Cited by 91
Grossman, P. (2023) · Biological Psychology · doi:10.1016/j.biopsycho.2023.108739 · Cited by 82
Brændholt, M., Kluger, D. S., Varga, S., Heck, D. H., Groß, J., & Allen, M. (2023) · Neuroscience & Biobehavioral Reviews · doi:10.1016/j.neubiorev.2023.105262 · Cited by 85
Metadata
- Authors
- Johannknecht, M., & Kayser, C.
- Affiliations
- Heinrich Heine University Düsseldorf (DE)
- Bielefeld University (DE)
- Corresponding author
- Kayser, Christoph
- Venue
- Scientific Reports
- Published
- 2022-02-16
- Volume
- 12
- Issue
- 1
- Pages
- 2586-2586
- ISSN
- 2045-2322 (ISSN-L)
- PMC
- PMC8850565
- OpenAlex
- W4220780205
- Cited by
- 101
- References
- 76
- Citations by year
- 2026: 26 · 2025: 33 · 2024: 15 · 2023: 15 · 2022: 10
- FWCI
- 9.63
- Type
- journal article
- Language
- en
- Open access
- gold
- doi.org
- Locations
- Scientific Reports (publishedVersion, cc-by)
- bioRxiv (Cold Spring Harbor Laboratory) (acceptedVersion)
- PubMed Central (publishedVersion, cc-by)
- PubMed (publishedVersion)
- DOAJ (DOAJ: Directory of Open Access Journals) (submittedVersion, cc-by-sa)
- Publikationen an der Universität Bielefeld (Universität Bielefeld) (submittedVersion, cc-by)
- Funders
- Universität Bielefeld
- Topics
- Life Sciences › Neuroscience › Endocrine and Autonomic Systems › Neuroscience of respiration and sleep
- Health Sciences › Medicine › Cardiology and Cardiovascular Medicine › Heart Rate Variability and Autonomic Control
- Life Sciences › Neuroscience › Cognitive Neuroscience › Neural and Behavioral Psychology Studies
- Keywords
- respiratory cycle, respiration, reaction time, inhalation and exhalation, sensory detection, sensory discrimination, short-term memory, interoception
- MeSH terms
- Adult, Inhalation, Brain, Cognition, Female, Humans, Male, Memory, Short-Term, Reaction Time, Respiratory Physiological Phenomena, Sensation, Exhalation, Young Adult, Respiratory Rate
About these checks
Registry, retraction, Cites and statistics results are computed, not judged, with one exception: a printed reference that no index lists is read once by a model before it counts as a citation error. Claims are extracted by a model and kept only when their quote appears verbatim in the text; each cited source is then checked, with a model’s help, for whether it says what the claim relies on. Those verdicts can be wrong — read the claim’s quote and the cited source before relying on one.
Statistics and arithmetic are recomputed, not judged.
Confidence bands are shown only for fields calibrated on our annotated test set. None is calibrated yet, so no band is shown.
What counts as a claim ›How we measure confidence ›How we check this ›
Are you an author, or do you see a problem with this page? Request a review
