

Respiratory modulation of cognitive performance during the retrieval process
Open accessThe DOI matches its Crossref record; 48 of the 48 references it cites were found in a registry or an index.
Abstract
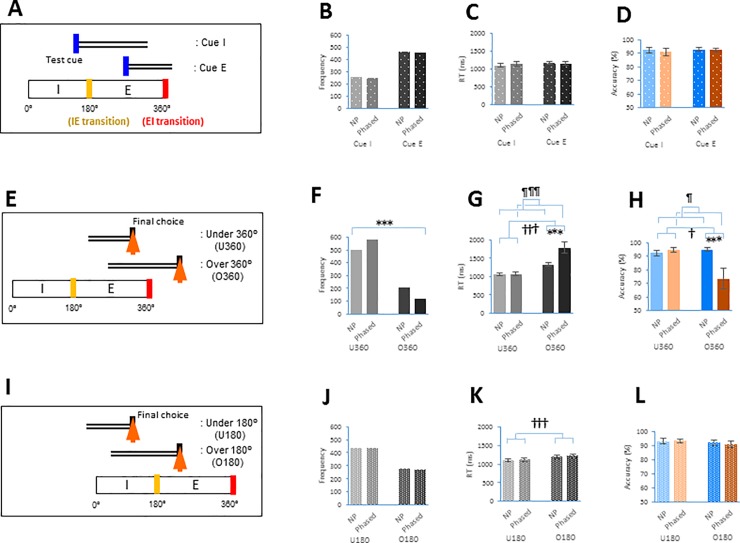
Recent research suggests that cognitive performance might be altered by the respiratory-synchronized activity generated in the brain. Previous human studies, however, have yielded inconsistent results when assessing task performance during distinct respiratory phases (inspiratory phase vs. expiratory phase). We therefore tested whether cognitive performance was regulated based on the timing of breathing components (e.g., expiratory-to-inspiratory (EI) phase transition) during the retrieval process. To determine the role of respiration in performance, the present study employed healthy subjects (n = 18) in a delayed matching-to-sample visual recognition task where a test cue was given in the respiratory phase-locked (Phased) or regularly paced (Non-phased) presentation paradigm. During the Phased session but not during the Non-phased session, the response time (RT) of the task increased by 466 ms (p = 0.003), and accuracy decreased by 21.4% (p = 0.004) when the retrieval process encompassed the EI transition. Breathing-dependent changes were particularly prominent when the EI transition occurred during the middle step of the retrieval process. Meanwhile, changes in the RT and accuracy were not observed when the retrieval process encompassed the inspiratory-to-expiratory phase transition. This is the first time that a certain phase transition in the respiratory cycle has been shown to modulate performance on a time scale of several seconds in a cognitive task. We propose that attenuation of these breathing-dependent cognitive fluctuations might be crucial for the maintenance and stability of successful performance in daily life and sports.
Overview
The claims and statistics of this paper haven’t been checked yet.
Free: it reads the open-access text and checks the first 5 claims that cite a source we can check. Create a free account to check every claim.
Integrity signals
Registry
Cites
Statistics
Figures



Verification
Claims the paper makes
The claims and statistics of this paper haven’t been checked yet.
Free: it reads the open-access text and checks the first 5 claims that cite a source we can check. Create a free account to check every claim.
Claims other papers make about this one
Each is checked against this paper’s own text: does it say what the citing paper says it does?
The source backs part of the claim, not all of it — or backs it for a different population, condition or comparison.
In the citing paper
“The coupling between nasal respiration and neural activity in limbic regions is also associated with the modulation of memory performance 120,138,139 and of emotional ratings in humans 120 , and it influences freezing behavior in mice 134,135 .”
From Interoceptive rhythms in the brain (2023) · cites this paper as [139]
Experimental — accuracy not yet measuredThe source backs part of the claim, not all of it — or backs it for a different population, condition or comparison.
In the citing paper
“The fact that at least some cycle effects need a prolonged period of synchronization between bodily rhythms and external inputs argues in favor of predictive coding 139 .”
From Interoceptive rhythms in the brain (2023) · cites this paper as [139]
Experimental — accuracy not yet measured
Self-check
Percentages, sums and reported differences re-computed from the paper’s own numbers.
The self-check needs the paper’s full text.
Citations
Cites
The Medial Temporal Lobe and Recognition Memory
Eichenbaum, H., Yonelinas, A. P., & Ranganath, C. (2007) · Annual Review of Neuroscience · doi:10.1146/annurev.neuro.30.051606.094328 · Cited by 2,580
Interplay of Hippocampus and Prefrontal Cortex in Memory
Preston, A. R., & Eichenbaum, H. (2013) · Current Biology · doi:10.1016/j.cub.2013.05.041 · Cited by 1,389
Visceral influences on brain and behavior
Critchley, H. D., & Harrison, N. A. (2013) · Neuron · doi:10.1016/j.neuron.2013.02.008 · Cited by 1,177
The speed-accuracy tradeoff: history, physiology, methodology, and behavior
Heitz, R. P. (2014) · Frontiers in Neuroscience · doi:10.3389/fnins.2014.00150 · Cited by 938
Locus coeruleus and dopaminergic consolidation of everyday memory
Takeuchi, T., Duszkiewicz, A. J., Sonneborn, A., Spooner, P. A., Yamasaki, M., Watanabe, M., Smith, C. C., Fernández, G., Deisseroth, K., Greene, R. W., et al. (2016) · Nature · doi:10.1038/nature19325 · Cited by 827
Can animals recall the past and plan for the future?
Clayton, N. S., Bussey, T. J., & Dickinson, A. (2003) · Nature Reviews Neuroscience · doi:10.1038/nrn1180 · Cited by 658
Nasal Respiration Entrains Human Limbic Oscillations and Modulates Cognitive Function
Zelano, C., Jiang, H., Zhou, G., Arora, N., Schuele, S., Rosenow, J., & Gottfried, J. A. (2016) · The Journal of Neuroscience · doi:10.1523/jneurosci.2586-16.2016 · Cited by 599
Understanding the Rhythm of Breathing: So Near, Yet So Far
Feldman, J. L., Del Negro, C. A., & Gray, P. A. (2013) · Annual Review of Physiology · doi:10.1146/annurev-physiol-040510-130049 · Cited by 459
Brainstem respiratory networks: building blocks and microcircuits
Smith, J. C., Abdala, A. P. L., Borgmann, A., Rybak, I. A., & Paton, J. F. R. (2013) · Trends in Neurosciences · doi:10.1016/j.tins.2012.11.004 · Cited by 428
Precise olfactory responses tile the sniff cycle
Shusterman, R., Smear, M. C., Koulakov, A. A., & Rinberg, D. (2011) · Nature Neuroscience · doi:10.1038/nn.2877 · Cited by 388
Research works printed but not linked: 1
- JM Gardiner, 2007, Retrieval: On its essence and related concepts. In: Roediger HL, Dudai Y, Fitzpatrick SM editors. Science of Memory: Concepts, New York: Oxford University Press, 221
Cited by
Interoceptive rhythms in the brain
Engelen, T., Solcà, M., & Tallon-Baudry, C. (2023) · Nature Neuroscience · doi:10.1038/s41593-023-01425-1 · Cited by 207
Human non-olfactory cognition phase-locked with inhalation
Perl, O., Ravia, A., Rubinson, M., Eisen, A., Soroka, T., Mor, N., Secundo, L., & Sobel, N. (2019) · Nature Human Behaviour · doi:10.1038/s41562-019-0556-z · Cited by 220
Breathing Rhythm and Pattern and Their Influence on Emotion
Ashhad, S., Kam, K., Del Negro, C. A., & Feldman, J. L. (2022) · Annual Review of Neuroscience · doi:10.1146/annurev-neuro-090121-014424 · Cited by 161
Seppala, E. M., Bradley, C. M., Moeller, J., Harouni, L., Nandamudi, D., & Brackett, M. A. (2020) · Frontiers in Psychiatry · doi:10.3389/fpsyt.2020.00590 · Cited by 190
The rhythm of memory: how breathing shapes memory function
Heck, D. H., Kozma, R., & Kay, L. M. (2019) · Journal of Neurophysiology · doi:10.1152/jn.00200.2019 · Cited by 134
Metadata
- Authors
- Nakamura, N. H., Fukunaga, M., & Oku, Y.
- Affiliations
- Hyogo Medical University (JP)
- National Institute for Physiological Sciences (JP)
- Corresponding author
- Nakamura, Nozomu H.
- Venue
- PLOS ONE
- Publisher
- Public Library of Science (PLoS)
- Published
- 2018-09-14
- Volume
- 13
- Issue
- 9
- Pages
- e0204021
- ISSN
- 1932-6203 (ISSN-L)
- PMC
- PMC6138381
- OpenAlex
- W2892026688
- Cited by
- 88
- References
- 48
- Citations by year
- 2026: 7 · 2025: 17 · 2024: 8 · 2023: 19 · 2022: 19 · 2021: 8 · 2020: 5 · 2019: 5
- FWCI
- 2.53
- Type
- journal article
- Language
- en
- Open access
- gold
- doi.org
- Licence
- Locations
- PLoS ONE (publishedVersion, cc-by)
- Europe PMC (PubMed Central) (publishedVersion, cc-by)
- PubMed Central (publishedVersion, cc-by)
- PubMed (publishedVersion)
- DOAJ (DOAJ: Directory of Open Access Journals) (submittedVersion, cc-by-sa)
- Figshare (submittedVersion, cc-by)
- Funders
- Grant-in-Aid for Scientific Research the Japan Society for the Promotion of Science (15K12055)
- Grant-in-Aid for Researchers from the Hyogo College of Medicine
- Cooperative Study Program of National Institute for Physiological Sciences
- Topics
- Life Sciences › Neuroscience › Endocrine and Autonomic Systems › Neuroscience of respiration and sleep
- Life Sciences › Neuroscience › Cognitive Neuroscience › Neural dynamics and brain function
- Health Sciences › Medicine › Cardiology and Cardiovascular Medicine › Heart Rate Variability and Autonomic Control
- Keywords
- respiration, cognitive performance, memory retrieval, delayed matching-to-sample, visual recognition, reaction time (psychology), accuracy
- MeSH terms
- Adult, Inhalation, Cognition, Female, Humans, Male, Memory, Reaction Time, Respiratory Physiological Phenomena, Task Performance and Analysis, Exhalation, Young Adult
About these checks
Registry, retraction, Cites and statistics results are computed, not judged, with one exception: a printed reference that no index lists is read once by a model before it counts as a citation error. Claims are extracted by a model and kept only when their quote appears verbatim in the text; each cited source is then checked, with a model’s help, for whether it says what the claim relies on. Those verdicts can be wrong — read the claim’s quote and the cited source before relying on one.
Statistics and arithmetic are recomputed, not judged.
Confidence bands are shown only for fields calibrated on our annotated test set. None is calibrated yet, so no band is shown.
What counts as a claim ›How we measure confidence ›How we check this ›
Are you an author, or do you see a problem with this page? Request a review
How to cite
Cite CoChat for the checks on this page, and the paper for its own findings.
- This page
- CoChat. (2026). Citation check: Respiratory modulation of cognitive performance during the retrieval process. https://app.cochat.ai/papers/10.1371/journal.pone.0204021
- The paper
- Nakamura, N. H., Fukunaga, M., & Oku, Y. (2018). Respiratory modulation of cognitive performance during the retrieval process. PLOS ONE. https://doi.org/10.1371/journal.pone.0204021
Data sources
Bibliographic data: Semantic Scholar, OpenAlex, Crossref.
Contains information from the Semantic Scholar Academic Graph Datasets, made available under the ODC Attribution License (ODC-BY 1.0).
Semantic Scholar’s data is described in: Kinney, R., et al. (2023). The Semantic Scholar Open Data Platform. arXiv:2301.10140.
