

The DOI matches its Crossref record; 87 of the 87 references it cites were found in a registry or an index.
NEBULA is a fast negative binomial mixed model for differential or co-expression analysis of large-scale multi-subject single-cell data
Open accessPublished version of a preprint
Abstract
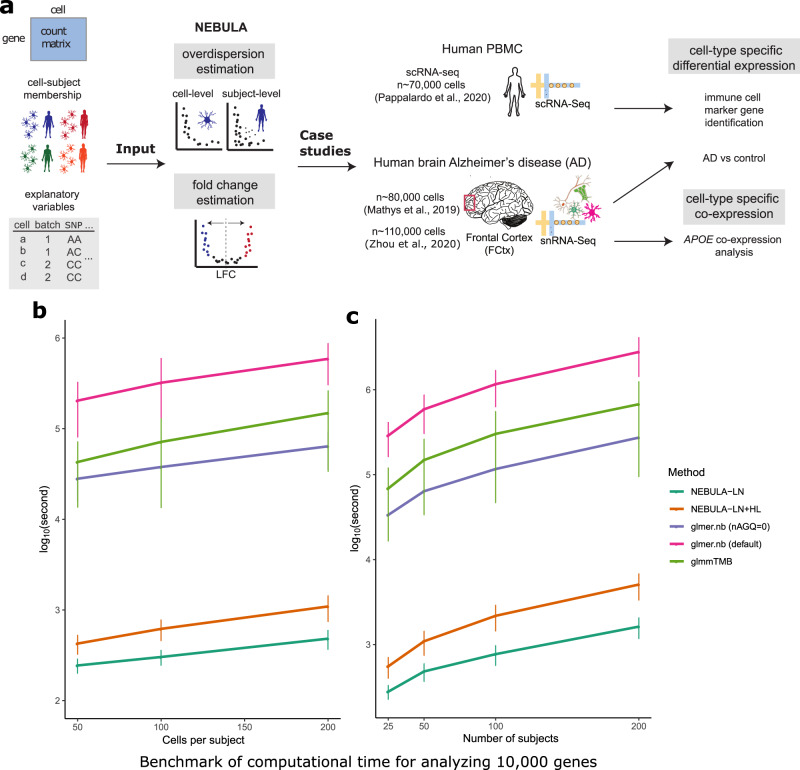
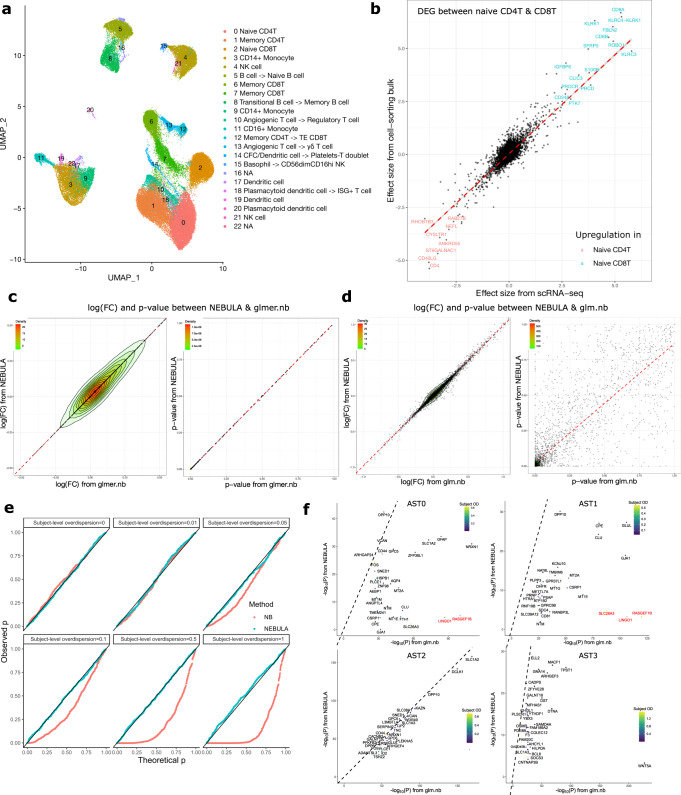
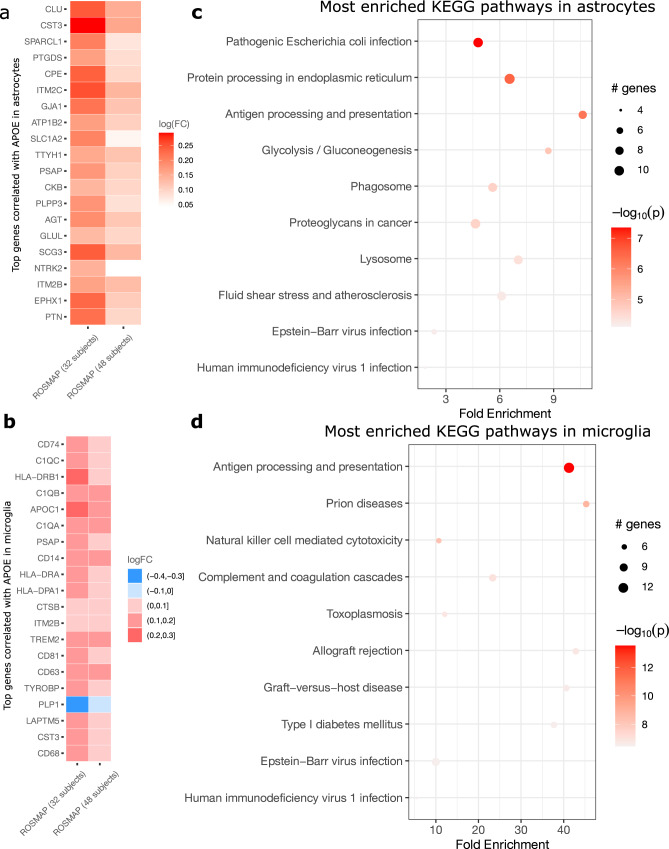
The increasing availability of single-cell data revolutionizes the understanding of biological mechanisms at cellular resolution. For differential expression analysis in multi-subject single-cell data, negative binomial mixed models account for both subject-level and cell-level overdispersions, but are computationally demanding. Here, we propose an efficient NEgative Binomial mixed model Using a Large-sample Approximation (NEBULA). The speed gain is achieved by analytically solving high-dimensional integrals instead of using the Laplace approximation. We demonstrate that NEBULA is orders of magnitude faster than existing tools and controls false-positive errors in marker gene identification and co-expression analysis. Using NEBULA in Alzheimer’s disease cohort data sets, we found that the cell-level expression of APOE correlated with that of other genetic risk factors (including CLU, CST3, TREM2 , C1q, and ITM2B ) in a cell-type-specific pattern and an isoform-dependent manner in microglia. NEBULA opens up a new avenue for the broad application of mixed models to large-scale multi-subject single-cell data.
Overview
The claims and statistics of this paper haven’t been checked yet.
Run the check — free, no account needed. It reads the open-access text and checks the sources it cites.
Integrity signals
Registry
Cites
Statistics
Figures
Verification
Claims the paper makes
The claims and statistics of this paper haven’t been checked yet.
Run the check — free, no account needed. It reads the open-access text and checks the sources it cites.
Claims other papers make about this one
Each is checked against this paper’s own text: does it say what the citing paper says it does?
The cited source says what the claim attributes to it.
In the citing paper
“Per-gene expression levels per cell type were modeled as a negative binomial model with random effects that model both within-individual and between-individual effects, as implemented in the R package NEBULA (version 1.2.1)40”
From APOE4 impairs myelination via cholesterol dysregulation in oligodendrocytes (2022) · cites this paper as [40]
Self-check
Percentages, sums and reported differences re-computed from the paper’s own numbers.
The self-check needs the paper’s full text.
Citations
Cites
Moderated estimation of fold change and dispersion for RNA-seq data with DESeq2
Love, M. I., Huber, W., & Anders, S. (2014) · Genome Biology · doi:10.1186/s13059-014-0550-8 · Cited by 95,106
Fitting Linear Mixed-Effects Models Using lme4
Bates, D., Mächler, M., Bolker, B., & Walker, S. (2015) · Journal of Statistical Software · doi:10.18637/jss.v067.i01 · Cited by 86,835
Mollie, E. B., Kristensen, K., van Benthem, K. J., Magnússon, Á., Casper, W. B., Nielsen, A., Hans, J. S., Maechler, M., & Benjamin, M. B. (2017) · The R Journal · doi:10.32614/rj-2017-066 · Cited by 13,350
Integrating single-cell transcriptomic data across different conditions, technologies, and species
Butler, A., Hoffman, P., Smibert, P., Papalexi, E., & Satija, R. (2018) · Nature Biotechnology · doi:10.1038/nbt.4096 · Cited by 13,174
A scaling normalization method for differential expression analysis of RNA-seq data
Robinson, M. D., & Oshlack, A. (2010) · Genome Biology · doi:10.1186/gb-2010-11-3-r25 · Cited by 7,876
Numerical Methods for Unconstrained Optimization and Nonlinear Equations
Dennis, J. E., & Schnabel, R. B. (1996) · Society for Industrial and Applied Mathematics eBooks · doi:10.1137/1.9781611971200 · Cited by 7,673
Robust estimation of a location parameter
Huber, P. J. (1964) · The Annals of Mathematical Statistics · doi:10.1214/aoms/1177703732 · Cited by 7,228
Highly parallel genome-wide expression profiling of individual cells using nanoliter droplets.
Macosko, E. Z., Basu, A., Satija, R., Nemesh, J., Shekhar, K., Goldman, M., Tirosh, I., Bialas, A. R., Kamitaki, N., Martersteck, E. M., et al. (2015) · Cell · doi:10.1016/j.cell.2015.05.002 · Cited by 7,110
UMAP: Uniform Manifold Approximation and Projection for Dimension Reduction
McInnes, L., Healy, J., & Melville, J. (2018) · arXiv · doi:10.48550/arxiv.1802.03426 · Cited by 7,101
A Limited Memory Algorithm for Bound Constrained Optimization
Byrd, R. H., Lu, P., Nocedal, J. M., & Zhu, C. (1995) · SIAM Journal on Scientific Computing · doi:10.1137/0916069 · Cited by 6,267
Research works printed but not linked: 1
- Huber, P. J. Robust Statistics. (John Wiley & Sons, 2004).
Cited by
Sorted by citations
ApoE in Alzheimer’s disease: pathophysiology and therapeutic strategies
Raulin, A.-C., Doss, S. V., Trottier, Z. A., Ikezu, T. C., Bu, G., & Liu, C.-C. (2022) · Molecular Neurodegeneration · doi:10.1186/s13024-022-00574-4 · Cited by 756
Comparison and evaluation of statistical error models for scRNA-seq
Choudhary, S., & Satija, R. (2022) · Genome Biology · doi:10.1186/s13059-021-02584-9 · Cited by 634
APOE4 impairs myelination via cholesterol dysregulation in oligodendrocytes
Blanchard, J. W., Akay, L. A., Davila-Velderrain, J., von Maydell, D., Mathys, H., Davidson, S. M., Effenberger, A., Chen, C.-Y., Maner-Smith, K., Hajjar, I., et al. (2022) · Nature · doi:10.1038/s41586-022-05439-w · Cited by 496
“Genetic diversity may confound the effects of APOE4 observed on human post-mortem brain tissue.”
InfluentialSelf-citationIntegrated multimodal cell atlas of Alzheimer’s disease
Gabitto, M. I., Travaglini, K. J., Rachleff, V. M., Kaplan, E. S., Long, B., Ariza, J., Ding, Y., Mahoney, J. T., Dee, N., Goldy, J., et al. (2024) · Nature Neuroscience · doi:10.1038/s41593-024-01774-5 · Cited by 397
Single-cell multiregion dissection of Alzheimer’s disease
Mathys, H., Boix, C. A., Akay, L. A., Xia, Z., Davila-Velderrain, J., Ng, A. P., Jiang, X., Abdelhady, G., Galani, K., Mantero, J., et al. (2024) · Nature · doi:10.1038/s41586-024-07606-7 · Cited by 343
Self-citationProfiling cell identity and tissue architecture with single-cell and spatial transcriptomics
Gulati, G. S., D'Silva, J. P., Liu, Y., Wang, L., & Newman, A. M. (2024) · Nature Reviews Molecular Cell Biology · doi:10.1038/s41580-024-00768-2 · Cited by 347
Broad transcriptomic dysregulation occurs across the cerebral cortex in ASD
Gandal, M. J., Haney, J. R., Wamsley, B., Yap, C. X., Parhami, S., Emani, P. S., Chang, N., Chen, G. T., Hoftman, G. D., de Alba, D., et al. (2022) · Nature · doi:10.1038/s41586-022-05377-7 · Cited by 283
Epigenomic dissection of Alzheimer’s disease pinpoints causal variants and reveals epigenome erosion
Xiong, X., James, B. T., Boix, C. A., Park, Y. P., Galani, K., Victor, M. B., Sun, N., Hou, L., Ho, L.-L., Mantero, J., et al. (2023) · Cell · doi:10.1016/j.cell.2023.08.040 · Cited by 205
Self-citationPyramidal neuron subtype diversity governs microglia states in the neocortex
Stogsdill, J. A., Kim, K., Binan, L., Farhi, S. L., Levin, J. Z., & Arlotta, P. (2022) · Nature · doi:10.1038/s41586-022-05056-7 · Cited by 121
TREM2-independent microgliosis promotes tau-mediated neurodegeneration in the presence of ApoE4.
Gratuze, M., Schlachetzki, J. C. M., D’Oliveira Albanus, R., Jain, N., Novotny, B., Brase, L., Rodriguez, L., Mansel, C., Kipnis, M., O’Brien, S., et al. (2023) · Neuron · doi:10.1016/j.neuron.2022.10.022 · Cited by 115
Junttila, S., Smolander, J., & Elo, L. L. (2022) · Briefings in Bioinformatics · doi:10.1093/bib/bbac286 · Cited by 109
Single-nucleus RNA-sequencing of autosomal dominant Alzheimer disease and risk variant carriers
Brase, L., You, S., Albanus, R. D., Del‐Aguila, J. L., Dai, Y., Novotny, B. C., Soriano‐Tárraga, C., Dykstra, T., Fernández, M. V., Budde, J., et al. (2023) · Nature Communications · doi:10.1038/s41467-023-37437-5 · Cited by 104
Selective remodelling of the adipose niche in obesity and weight loss
Miranda, A. M. A., McAllan, L., Mazzei, G., Andrew, I., Davies, I., Ertuğrul, M. S., Kenkre, J. S., Kudo, H., Carrelha, J., Patel, B., et al. (2025) · Nature · doi:10.1038/s41586-025-09233-2 · Cited by 112
Reciprocal activity of AgRP and POMC neurons governs coordinated control of feeding and metabolism
Solís, A. J. D., Río-Martín, A. D., Radermacher, J., Chen, W., Steuernagel, L., Bauder, C. A., Eggersmann, F. R., Morgan, D. A., Lena, C. A., Sue, M. W., et al. (2024) · Nature Metabolism · doi:10.1038/s42255-024-00987-z · Cited by 94
Cell-type-specific co-expression inference from single cell RNA-sequencing data
Su, C., Xu, Z., Shan, X., Cai, B., Zhao, H., & Zhang, J. (2023) · Nature Communications · doi:10.1038/s41467-023-40503-7 · Cited by 93
Dissecting the human leptomeninges at single-cell resolution
Kearns, N. A., Iatrou, A., Flood, D. J., De Tissera, S., Mullaney, Z. M., Xu, J., Gaiteri, C., Bennett, D. A., & Wang, Y. (2023) · Nature Communications · doi:10.1038/s41467-023-42825-y · Cited by 75
Liu, Z., Zhang, S., James, B. T., Galani, K., Mangan, R. J., Fass, S. B., Liang, C., Wagle, M. M., Boix, C. A., Tanigawa, Y., et al. (2025) · Cell · doi:10.1016/j.cell.2025.06.031 · Cited by 75
Self-citationIn vivo screening characterizes chromatin factor functions during normal and malignant hematopoiesis
Lara‐Astiaso, D., Goñi‐Salaverri, A., Mendieta-Esteban, J., Narayan, N., del Valle, C., Groß, T., Giotopoulos, G., Beinortas, T., Navarro-Alonso, M., Aguado‐Alvaro, L. P., et al. (2023) · Nature Genetics · doi:10.1038/s41588-023-01471-2 · Cited by 57
CRISPR screens in iPSC-derived neurons reveal principles of tau proteostasis
Samelson, A. J., Ariqat, N., McKetney, J., Rohanitazangi, G., Bravo, C., Bose, R., Travaglini, K. J., Lam, V. L., Goodness, D., Ta, T., et al. (2026) · Cell · doi:10.1016/j.cell.2025.12.038 · Cited by 65
Fetahu, I. S., Esser‐Skala, W., Dnyansagar, R., Sindelar, S., Rifatbegovic, F., Bileck, A., Skos, L., Bozsaky, E., Lazic, D., Shaw, L. E., et al. (2023) · Nature Communications · doi:10.1038/s41467-023-39210-0 · Cited by 60
Single-cell transcriptomic and chromatin dynamics of the human brain in PTSD
Hwang, A., Škarica, M., Xu, S., Coudriet, J. M., Lee, C.-Y., Lin, L., Terwilliger, R. Z., Sliby, A., Wang, J., Nguyen, T. P., et al. (2025) · Nature · doi:10.1038/s41586-025-09083-y · Cited by 58
Mostly natural sequencing-by-synthesis for scRNA-seq using Ultima sequencing
Simmons, S., Lithwick‐Yanai, G., Adiconis, X., Oberstrass, F. C., Iremadze, N., Geiger-Schuller, K., Thakore, P. I., Frangieh, C. J., Barad, O., Almogy, G., et al. (2022) · Nature Biotechnology · doi:10.1038/s41587-022-01452-6 · Cited by 56
Advances in the Application of Single-Cell Transcriptomics in Plant Systems and Synthetic Biology
Islam, M. T., Liu, Y., Hassan, M. M., Abraham, P. E., Merlet, J., Townsend, A., Jacobson, D., Buell, C. R., Tuskan, G. A., & Yang, X. (2024) · BioDesign Research · doi:10.34133/bdr.0029 · Cited by 51
Fetal brain response to maternal inflammation requires microglia
Ostrem, B. E. L., Domıńguez-Iturza, N., Stogsdill, J., Faits, T., Kim, K., Levin, J. Z., & Arlotta, P. (2024) · Development · doi:10.1242/dev.202252 · Cited by 46
Discovery of Targets for Immune–Metabolic Antitumor Drugs Identifies Estrogen-Related Receptor Alpha
Sahu, A. D., Wang, X., Munson, P. B., Klomp, J. P. G., Wang, X., Gu, S. S., Qian, G., Nicol, P., Zeng, Z., Wang, C., et al. (2023) · Cancer Discovery · doi:10.1158/2159-8290.cd-22-0244 · Cited by 35
Straeten, F. A., Zhu, J. K., Börsch, A., Zhang, B., Li, K., Lu, I., Groß, C. C., Heming, M., Li, X., Rubin, R., et al. (2022) · Journal of Neuroinflammation · doi:10.1186/s12974-022-02667-9 · Cited by 38
Simon, M., Stüve, P., Schmidleithner, L., Bittner, S., Beumer, N., Strieder, N., Schmidl, C., Pant, A., Gebhard, C., Eigenberger, A., et al. (2024) · Immunity · doi:10.1016/j.immuni.2024.06.015 · Cited by 37
Microbial signals in primary and metastatic brain tumors
Morad, G., Damania, A. V., Melendez, B., Singh, B. B., Veguilla, F. J., Soto, R. A., Hoballah, Y. M., Sahasrabhojane, P. V., Wong, M. C., Ahmed, M. M., et al. (2025) · Nature Medicine · doi:10.1038/s41591-025-03957-4 · Cited by 40
Li, K., Ouyang, Z., Chen, Y., Gagnon, J., Lin, D., Mingueneau, M., Chen, W., Sexton, D., & Zhang, B. (2020) · Research Square · doi:10.1101/2020.08.28.270652 · Cited by 31
Jiang, C., Centonze, A., Song, Y., Chrisnandy, A., Tika, E., Rezakhani, S., Zahedi, Z., Bouvencourt, G., Dubois, C., Keymeulen, A. V., et al. (2024) · Nature Communications · doi:10.1038/s41467-024-54843-5 · Cited by 31
Gagnon, J., Pi, L., Ryals, M. M., Wan, Q., Hu, W., Ouyang, Z., Zhang, B., & Li, K. (2022) · Life · doi:10.3390/life12060850 · Cited by 31
Almeida, M. C., Eger, S. J., He, C., Audouard, M., Nikitina, A. A., Glasauer, S. M. K., Han, D., Mejía‐Cupajita, B., Acosta‐Uribe, J., Villalba‐Moreno, N. D., et al. (2024) · Neuron · doi:10.1016/j.neuron.2024.02.009 · Cited by 34
Patil, A. R., Schug, J., Liu, C., Lahori, D., Descamps, H. C., Naji, A., Kaestner, K. H., Faryabi, R. B., & Vahedi, G. (2024) · Cell Reports Medicine · doi:10.1016/j.xcrm.2024.101535 · Cited by 30
Linna-Kuosmanen, S., Schmauch, E., Galani, K., Ojanen, J., Boix, C. A., Örd, T., Toropainen, A., Singha, P., Moreau, P. R., Harju, K., et al. (2024) · Cell Reports Medicine · doi:10.1016/j.xcrm.2024.101556 · Cited by 29
Self-citationShwab, E. K., Gingerich, D. C., Man, Z., Gamache, J., Garrett, M. E., Crawford, G. E., Ashley‐Koch, A. E., Serrano, G. E., Beach, T. G., Lutz, M. W., et al. (2024) · Acta Neuropathologica Communications · doi:10.1186/s40478-024-01803-1 · Cited by 25
Targeting Piezo1 channel to alleviate intervertebral disc degeneration
Li, F., Chen, M., Zhang, M., Chen, S., Qu, M., He, S., Wang, L., Wu, X., & Xiao, G. (2025) · Journal of Orthopaedic Translation · doi:10.1016/j.jot.2025.01.006 · Cited by 28
Yang, J., Wang, C., Fu, D., Ho, L., Galani, K., Chen, L., Gonzalez, J., Fu, J. Y. L., Huang, A. Y., Frederick, D. T., et al. (2025) · Nature Communications · doi:10.1038/s41467-025-62878-5 · Cited by 28
Self-citationAmygdala–liver signalling orchestrates glycaemic responses to stress
Carty, J. R. E., Devarakonda, K., O’CONNOR, R., Krek, A., Espinoza, D., Jiménez-González, M., Alvarsson, A., Hampton, R. F., Li, R., Qiu, Y., et al. (2025) · Nature · doi:10.1038/s41586-025-09420-1 · Cited by 32
An autoimmune transcriptional circuit drives FOXP3 + regulatory T cell dysfunction
Sumida, T. S., Lincoln, M. R., He, L., Park, Y., Ota, M., Oguchi, A., Son, R., Yi, A., Stillwell, H. A., Leissa, G. A., et al. (2024) · Science Translational Medicine · doi:10.1126/scitranslmed.adp1720 · Cited by 25
Self-citationGerayeli, F. V., Park, H. Y., Milne, S. B., Li, X., Yang, C. X., Tuong, J., Eddy, R. L., Vahedi, S. M., Guinto, E., Cheung, C. Y., et al. (2024) · European Respiratory Journal · doi:10.1183/13993003.01947-2023 · Cited by 23
He, L., Loika, Y., & Kulminski, A. M. (2022) · Translational Psychiatry · doi:10.1038/s41398-022-01913-1 · Cited by 24
Self-citationRead, D. F., Booth, G. T., Daza, R. M., Jackson, D. L., Gladden, R. G., Srivatsan, S. R., Ewing, B., Franks, J. M., Spurrell, C. H., Gomes, A. R., et al. (2024) · Communications Biology · doi:10.1038/s42003-024-06582-y · Cited by 22
Dávila-Velderrain, J., Mathys, H., Mohammadi, S., Ruzicka, B., Jiang, X., Ng, A. P., Bennett, D. A., Tsai, L., & Kellis, M. (2021) · bioRxiv (Cold Spring Harbor Laboratory) · doi:10.1101/2021.07.01.450715 · Cited by 21
Self-citationD’Oliveira Albanus, R., Finan, G. M., Brase, L., Sweeney, N., Kim, T. Y., Chen, S., Ryoo, Y., Park, J., Guo, Q., Iyer, A. K., et al. (2025) · Science Translational Medicine · doi:10.1126/scitranslmed.adx0027 · Cited by 19
Wei, J., Moon, J., Yasumizu, Y., Zhang, L., Radassi, K., Buitrago-Pocasangre, N., Deerhake, M. E., Strauli, N. B., Chen, C.-W., Herman, A. E., et al. (2025) · Journal of Clinical Investigation · doi:10.1172/jci182790 · Cited by 27
Self-citationGöttert, S., Orberg, E. T., Fan, K., Heinrich, P., Matthe, D. M., Khalid, O., Klostermeier, L., Suriano, C., Strieder, N., Gebhard, C., et al. (2025) · Nature Communications · doi:10.1038/s41467-025-65180-6 · Cited by 22
A systematic comparison of novel and existing differential analysis methods for CyTOF data
Arend, L., Bernett, J., Manz, Q., Klug, M., Lazareva, O., Baumbach, J., Bongiovanni, D., & List, M. (2021) · Briefings in Bioinformatics · doi:10.1093/bib/bbab471 · Cited by 17
Guo, X., Ning, J., Chen, Y., Liu, G., Zhao, L., Fan, Y., & Sun, S. (2023) · Briefings in Functional Genomics · doi:10.1093/bfgp/elad011 · Cited by 19
Best practices for differential accessibility analysis in single-cell epigenomics
Teo, A. Y. Y., Squair, J. W., Courtine, G., & Skinnider, M. A. (2024) · Nature Communications · doi:10.1038/s41467-024-53089-5 · Cited by 19
Guo, X., Keenan, B. T., Reiner, B. C., Lian, J., & Pack, A. I. (2024) · Cell Reports · doi:10.1016/j.celrep.2024.114192 · Cited by 19
Wu, Y., Libby, J. B., Dumitrescu, L. C., Jager, P. L. D., Menon, V., Schneider, J. A., Bennett, D. A., & Hohman, T. J. (2024) · Alzheimer s & Dementia · doi:10.1002/alz.14419 · Cited by 15
Vuong, C. K., Weber, A., Seong, P., Matoba, N., Chen, Y.-J., Peyer, J., Younesi, S., Salinda, A., Gomez, D., Rivas, G., et al. (2026) · Science · doi:10.1126/science.aea1259 · Cited by 18
4R-tau seeding activity reveals molecular subtypes in progressive supranuclear palsy
Martínez-Valbuena, I., Lee, S., Santamaría, E., Fernández‐Irigoyen, J., Forrest, S. L., Zampar, S., Li, J. Y., Tanaka, H., Couto, B., Reyes, N. G. D., et al. (2025) · Nature Communications · doi:10.1038/s41467-025-67744-y · Cited by 26
Muir, A., Paudyal, B., Schmidt, S., Sedaghat-Rostami, E., Chakravarti, S., Villanueva-Hernández, S., Moffat, K., Polo, N., Angelopoulos, N., Schmidt, A. P., et al. (2024) · PLoS Pathogens · doi:10.1371/journal.ppat.1011910 · Cited by 14
Molecular and cellular processes disrupted in the early postnatal Down syndrome prefrontal cortex
Risgaard, R. D., Hanthanan Arachchilage, K., Knaack, S. A., Hosseini, M., Chen, R. J., Kumarage, P., Schmidt, D. K., Huang, X., Sheng, J., Wang, C. J., et al. (2026) · Science · doi:10.1126/science.aea1549 · Cited by 12
A phenotypic brain organoid atlas and biobank for neurodevelopmental disorders
Wang, L., Nakamura, Y., Li, J., Sievert, D., Liu, Y., Nguyen, T. D., Jetti, P. S., Thai, E., Zhou, R. Y., Weng, J., et al. (2025) · Cell stem cell · doi:10.1016/j.stem.2025.10.006 · Cited by 15
Zhou, Z., Luquette, L. J., Dong, G., Kim, J., Ku, J., Kim, K. M., Ramesh, N., Bae, M., Caplin, A. H., Shao, D. D., et al. (2026) · Cell · doi:10.1016/j.cell.2026.06.013 · Cited by 17
Lee, H., & Han, B. (2024) · Bioinformatics · doi:10.1093/bioinformatics/btae498 · Cited by 13
Chin, W. L., Cook, A., Chee, J., Principe, N., Hoang, T. S., Kidman, J., Hmon, K. P. W., Yeow, Y. L., Jones, M. E., Hou, R., et al. (2024) · Cell Reports Medicine · doi:10.1016/j.xcrm.2024.101882 · Cited by 14
A rat liver cell atlas reveals intrahepatic myeloid heterogeneity
Pouyabahar, D., Chung, S., Pezzutti, O. I., Perciani, C. T., Wang, X., Ma, X., Jiang, C., Camat, D., Chung, T., Sekhon, M., et al. (2023) · iScience · doi:10.1016/j.isci.2023.108213 · Cited by 12
4R-Tau seeding activity unravels molecular subtypes in patients with Progressive Supranuclear PalsyPreprint
Martínez-Valbuena, I., Lee, S., Santamaría, E., Fernández‐Irigoyen, J., Forrest, S. L., Li, J., Tanaka, H., Couto, B., Reyes, N. G. D., Qamar, S. H., et al. (2023) · bioRxiv (Cold Spring Harbor Laboratory) · doi:10.1101/2023.09.28.559953 · Cited by 11
Gan, S., Li, C., Hou, R., Tian, G., Zhao, Y., Ren, D., Zhou, W., Zhao, F. L., Lv, K., & Yang, J. (2024) · Molecular Therapy Oncology · doi:10.1016/j.omton.2024.200849 · Cited by 10
A landscape of the genetic and cellular heterogeneity in Alzheimer diseasePreprint
Brase, L., You, S., Albanus, R. D., Del‐Aguila, J. L., Dai, Y., Novotny, B. C., Soriano‐Tárraga, C., Dykstra, T., Fernández, M. V., Budde, J., et al. (2021) · medRxiv · doi:10.1101/2021.11.30.21267072 · Cited by 11
Differential Expression Analysis for Spatially Correlated DataPreprint
Vasconcelos, A. G., McGuire, D., Simon, N., Danaher, P. J., & Shojaie, A. (2024) · bioRxiv (Cold Spring Harbor Laboratory) · doi:10.1101/2024.08.02.606405 · Cited by 10
Chromatin accessibility provides a window into the genetic etiology of human brain disease
Bendl, J. M., Fullard, J. F., Girdhar, K., Dong, P., Kosoy, R., Zeng, B., Hoffman, G. E., & Roussos, P. (2025) · Trends in Genetics · doi:10.1016/j.tig.2025.01.001 · Cited by 9
Xiong, T., Chen, Y., Liu, C., Li, Y., Zhang, Y., & Chang, Q. (2025) · Molecular and Cellular Biochemistry · doi:10.1007/s11010-025-05317-9 · Cited by 10
Microglial States Are Susceptible to Senescence and Cholesterol Dysregulation in Alzheimer's Disease
Li, B., Wang, S., Kerman, B. E., Hugo, C., Shwab, E. K., Shu, C., Chiba‐Falek, O., Arvanitakis, Z., & Yassine, H. N. (2025) · Aging Cell · doi:10.1111/acel.70189 · Cited by 12
Cha, J., Kim, C. G., Sim, N. S., Kim, G., Son, W., Kim, D., Jung, Y., Hong, H. J., Lee, H. B., Kim, J., et al. (2025) · Cell Reports Medicine · doi:10.1016/j.xcrm.2025.102408 · Cited by 14
Garg, A., Vo, S., de Souza, I. D., Brant, A. C., Brase, L., Aladyeva, E., Albanus, R. D., Nallapu, A., Fu, H., & Harari, O. (2025) · Alzheimer s Research & Therapy · doi:10.1186/s13195-025-01944-y · Cited by 11
scViewer: An Interactive Single-Cell Gene Expression Visualization Tool
Patil, A. R., Kumar, G., Zhou, H., & Warren, L. L. (2023) · Cells · doi:10.3390/cells12111489 · Cited by 10
Zhang, S., Xie, L., Cui, Y., Carone, B. R., & Chen, Y. (2022) · Biomolecules · doi:10.3390/biom12081130 · Cited by 9
Using individual barcodes to increase quantification power of massively parallel reporter assays
Keukeleire, P., Rosen, J. D., Göbel-Knapp, A., Salomon, K., Schubach, M., & Kircher, M. (2025) · BMC Bioinformatics · doi:10.1186/s12859-025-06065-9 · Cited by 8
scRNASequest: an ecosystem of scRNA-seq analysis, visualization, and publishing
Li, K., Sun, Y. H., Ouyang, Z., Negi, S., Gao, Z., Zhu, J., Wang, W., Chen, Y., Piya, S., Hu, W., et al. (2023) · BMC Genomics · doi:10.1186/s12864-023-09332-2 · Cited by 8
Single-cell eQTL mapping in yeast reveals a tradeoff between growth and reproduction
Boocock, J., Alexander, N., Tapia, L. A., Walter-McNeill, L., Patel, S. P., Munugala, C., Bloom, J. S., & Kruglyak, L. (2025) · eLife · doi:10.7554/elife.95566.3 · Cited by 7
Liu, P.-W., Lin, J., Hou, R., Cai, Z., Gong, Y., He, P., & Yang, J. (2024) · Computers in Biology and Medicine · doi:10.1016/j.compbiomed.2024.107926 · Cited by 7
Zillich, E., Artioli, A., Rossetti, A. C., Avetyan, D., Belschner, H., Frank, J., Stein, F., Schwarz, J., Mechawar, N., Turecki, G., et al. (2025) · Cell Reports · doi:10.1016/j.celrep.2025.115332 · Cited by 6
Baran, A. M., Patil, A. H., Aparicio‐Puerta, E., Jun, S.-H., Halushka, M. K., & McCall, M. N. (2025) · Genome biology · doi:10.1186/s13059-025-03549-y · Cited by 6
Ji, J. X., Giles, B. L., Bhattacharjee, S., Kautzmann, M.-A. I., Masson, A. P., Carmo, S. D., Cuello, A. C., & Bazan, N. G. (2025) · Communications Biology · doi:10.1038/s42003-025-08959-z · Cited by 6
Asami, S., Yin, C., Fan, J., Garza, L. A., & Kalhor, R. (2026) · Cell · doi:10.1016/j.cell.2026.06.014 · Cited by 7
Root Causal Inference from Single Cell RNA Sequencing with the Negative Binomial
Strobl, E. V. (2023) · ACM International Conference on Bioinformatics, Computational Biology, and Health Informatics (ACM-BCB) · doi:10.1145/3584371.3612972 · Cited by 6
Computational single cell oncology: state of the art
Paas-Oliveros, E., Lemus, E. H., & de Anda‐Jáuregui, G. (2023) · Frontiers in Genetics · doi:10.3389/fgene.2023.1256991 · Cited by 6
Single‐cell landscape of sex‐specific drivers of Alzheimer's disease
Wu, Y., Travaglini, K. J., Gabitto, M. I., Keene, C. D., Dunn, A. R., Kaczorowski, C. C., Jager, P. L. D., Menon, V., Schneider, J. A., Bennett, D. A. A., et al. (2025) · Alzheimer s & Dementia · doi:10.1002/alz.71041 · Cited by 9
Single-cell atlas of the developing Down syndrome brain cortex
Lattke, M., Tan, W. L., Sukumaran, S. K., Utami, K. H., Sintes, M., Sakthivel, S., Tan, J., Lim, A. T. J., Bansal, V. A., Rekopoulou, K., et al. (2026) · Nature Medicine · doi:10.1038/s41591-026-04211-1 · Cited by 8
Comparative mapping of single‐cell transcriptomic landscapes in neurodegenerative diseases
Shwab, E. K., Man, Z., Gingerich, D. C., Gamache, J., Garrett, M. E., Serrano, G. E., Beach, T. G., Crawford, G. E., Ashley‐Koch, A. E., & Chiba‐Falek, O. (2025) · Alzheimer s & Dementia · doi:10.1002/alz.70012 · Cited by 5
Lee, H., & Han, B. (2023) · bioRxiv (Cold Spring Harbor Laboratory) · doi:10.1101/2023.01.09.523212 · Cited by 5
Systems Analysis of Immune Changes after B-cell Depletion in Autoimmune Multiple SclerosisPreprint
Wei, J., Moon, J., Yasumizu, Y., Zhang, L., Radassi, K., Buitrago-Pocasangre, N., Deerhake, M. E., Strauli, N., Chan, A., Herman, A. E., et al. (2024) · bioRxiv (Cold Spring Harbor Laboratory) · doi:10.1101/2024.02.07.576204 · Cited by 5
Self-citationBayesian-frequentist hybrid inference framework for single cell RNA-seq analyses
Han, G., Yan, D., Sun, Z., Fang, J., Chang, X., Wilson, L., & Liu, Y. (2024) · Human Genomics · doi:10.1186/s40246-024-00638-0 · Cited by 4
Gallo, N. B., Annand, J. W., Clarner, P., Harvey, B., Morozova, E., Ehrenfels, C., Jiang, T., Yuan, L., Kashyap, S., Lü, X., et al. (2026) · Molecular Therapy · doi:10.1016/j.ymthe.2026.03.027 · Cited by 4
Lactate metabolism links reactive microglia, amyloid pathology, and Aβ dynamics
Ashley, C. C., Constantino, N. J., Pettit‐Mee, R. J., Snipes, J. A., Saito, K., Irmen, R. E., Zhang, R., Neary, E. M., Lanning, M. J., Karch, C. M. M., et al. (2026) · Journal of Neuroinflammation · doi:10.1186/s12974-026-03825-z · Cited by 5
Sex differences in progressive multiple sclerosis brain gene expression in oligodendrocytes and OPCs
LaBarre, B. A., King, D., Ploumakis, A., Pinzon, A. M., Guttmann, C. R. G., Patsopoulos, N., & Chitnis, T. (2025) · BMC Medical Genomics · doi:10.1186/s12920-025-02294-2 · Cited by 4
Xu, C., Pouyabahar, D., Voisin, V., Heydari, H., & Bader, G. D. (2026) · Nature Communications · doi:10.1038/s41467-026-69063-2 · Cited by 5
Lin, K., Qiu, Y., & Roeder, K. (2024) · BMC Bioinformatics · doi:10.1186/s12859-024-05724-7 · Cited by 3
Wasdin, P. T., Abu-Shmais, A. A., Irvin, M., Vukovich, M. J., & Georgiev, I. S. (2024) · Bioinformatics Advances · doi:10.1093/bioadv/vbae170 · Cited by 4
He, L., Philipp, I., Webster, S., Hjelmborg, J., & Kulminski, A. M. (2023) · Statistics in Medicine · doi:10.1002/sim.9747 · Cited by 3
Self-citationSaul, M. C., LITKOWSKI, E. M., Hadad, N., Dunn, A. R., Boas, S. M., Willcox, J. A. L., Robbins, J. E., Wu, Y., Philip, V. M., Merrihew, G. E., et al. (2024) · bioRxiv (Cold Spring Harbor Laboratory) · doi:10.1101/2024.01.09.574219 · Cited by 4
Elucidating early intestinal stem cell response to bacterial infectionPreprint
Lebon, S., Davidzohn, N., Menachem, A. H., Katz, A., Wigoda, N., Rotkopf, R., Dadosh, T., Levin‐Zaidman, S., Dezorella, N., Blumberger, N., et al. (2024) · bioRxiv (Cold Spring Harbor Laboratory) · doi:10.1101/2024.09.15.613128 · Cited by 4
Single-cell RNA-sequencing reveals adventitial fibroblast alterations during mouse atherosclerosis
Fries, L. E., Chung, A. Y., Chang, H.-K., Yuan, T. L., & Bauer, R. C. (2025) · Atherosclerosis · doi:10.1016/j.atherosclerosis.2025.120526 · Cited by 3
Labuza, A., Pidikiti, H., Alldred, M. J., Ibrahim, K. W., Peng, K. Y., Pasato, J., Heguy, A., Mathews, P. M., & Ginsberg, S. D. (2025) · Brain Sciences · doi:10.3390/brainsci15101117 · Cited by 4
Differential expression analysis for spatially correlated data using smiDE
Vasconcelos, A. G., McGuire, D., Simon, N., Danaher, P. J., & Shojaie, A. (2026) · Genome biology · doi:10.1186/s13059-025-03867-1 · Cited by 3
Lebon, S., Menachem, A. H., Davidzohn, N., Katz, A., Wigoda, N., Braun, T., Yahalomi, D., Rotkopf, R., Holiar, V. V., Dadosh, T., et al. (2026) · Nature Immunology · doi:10.1038/s41590-026-02514-6 · Cited by 4
Metadata
- Authors
- He, L., Davila-Velderrain, J., Sumida, T. S., Hafler, D. A., Kellis, M., & Kulminski, A. M.
- Affiliations
- Duke University (US)
- Yale University (US)
- Broad Institute (US)
- Corresponding author
- He, Liang
- Kellis, Manolis
- Kulminski, Alexander M.
- Venue
- Communications Biology
- Published
- 2021-05-26
- Volume
- 4
- Issue
- 1
- Pages
- 629-629
- ISSN
- 2399-3642 (ISSN-L)
- PMC
- PMC8155058
- OpenAlex
- W3164861786
- Cited by
- 181
- References
- 85
- Citations by year
- 2026: 42 · 2025: 40 · 2024: 48 · 2023: 27 · 2022: 19 · 2021: 4
- FWCI
- 8.67
- Type
- journal article
- Language
- en
- Open access
- gold
- doi.org
- Locations
- Communications Biology (publishedVersion, cc-by)
- bioRxiv (Cold Spring Harbor Laboratory) (acceptedVersion, cc-by-nc-nd)
- PubMed Central (publishedVersion, cc-by)
- PubMed (publishedVersion)
- DOAJ (DOAJ: Directory of Open Access Journals) (submittedVersion, cc-by-sa)
- DSpace@MIT (Massachusetts Institute of Technology) (submittedVersion, cc-by-nc)
- Funders
- National Institutes of Health (5r01ag070488-05, UL1TR001863)
- National Institute on Aging (R01-AG070488, R01AG017917, AG058002, R01AG030146, R01AG058002, R01AG062335, R01AG036836, RF1AG054012, R01AG065477, R01AG048015, U01AG046152, R01AG036042, R01AG015819, P30AG010161, RF1AG062377, U01AG032984, U01AG061356, RC2AG036547, U01AG046161, R01AG061853, RF1AG057473, R01AG067151)
- National Institute of Mental Health (U01MH119509, R01MH109978)
- National Cancer Institute (R01CA227473, P50CA121974)
- National Institute of Allergy and Infectious Diseases (R01AI072222, P01AI073748, U24AI118672, P01AI039671, U19AI089992)
- National Institute of Neurological Disorders and Stroke (R25NS079193, U01NS110453, UG3NS115064)
- National Center for Advancing Translational Sciences
- Topics
- Life Sciences › Biochemistry, Genetics and Molecular Biology › Molecular Biology › Single-cell and spatial transcriptomics
- Life Sciences › Biochemistry, Genetics and Molecular Biology › Molecular Biology › Gene expression and cancer classification
- Life Sciences › Biochemistry, Genetics and Molecular Biology › Molecular Biology › Gene Regulatory Network Analysis
- Keywords
- nebulae, differential expression analysis, co-expression analysis, large sample approximation, computational efficiency, marker gene identification, Alzheimer's disease, apolipoprotein E, microglia, cell type-specific gene expression, isoform expression, genetic risk factors
- MeSH terms
- Alzheimer Disease, Apolipoproteins E, Humans, Models, Statistical, Gene Expression, Binomial Distribution, Microglia, Computational Biology, Gene Expression Profiling, Single-Cell Analysis
About these checks
Registry, retraction, Cites and statistics results are computed, not judged, with one exception: a printed reference that no index lists is read once by a model before it counts as a citation error. Claims are extracted by a model and kept only when their quote appears verbatim in the text; each cited source is then checked, with a model’s help, for whether it says what the claim relies on. Those verdicts can be wrong — read the claim’s quote and the cited source before relying on one.
Statistics and arithmetic are recomputed, not judged.
Confidence bands are shown only for fields calibrated on our annotated test set. None is calibrated yet, so no band is shown.
What counts as a claim ›How we measure confidence ›How we check this ›
Are you an author, or do you see a problem with this page? Request a review
