

The DOI matches its Crossref record; 19 of the 19 references it cites were found in a registry or an index.
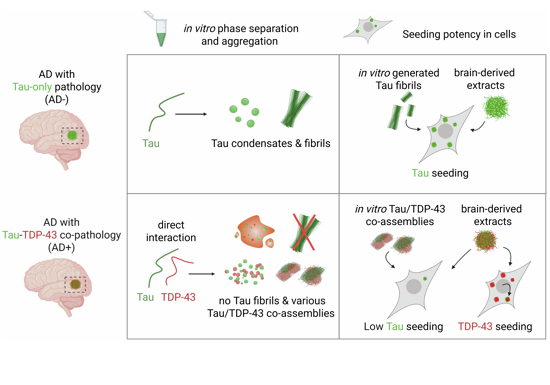
Direct interaction between TDP-43 and Tau promotes their co-condensation, while suppressing Tau fibril formation and seeding
Abstract
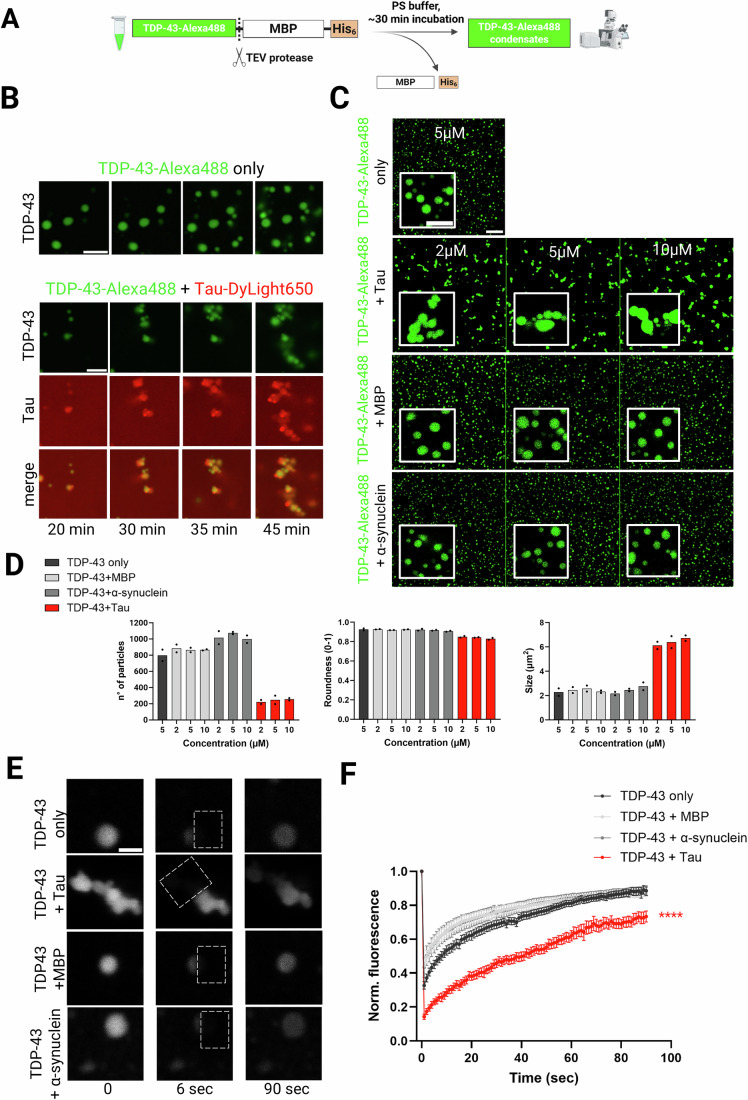
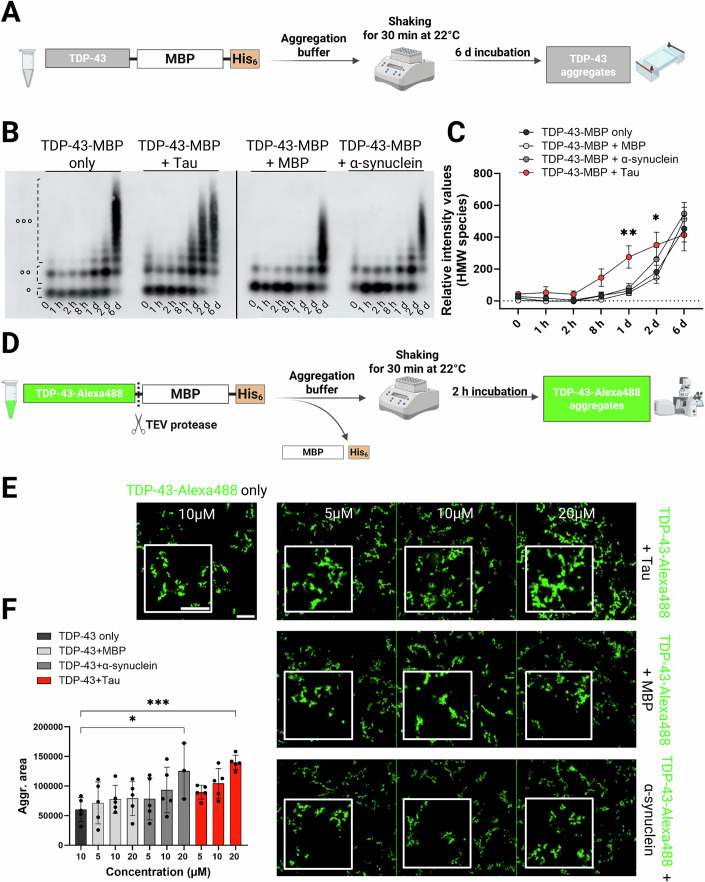
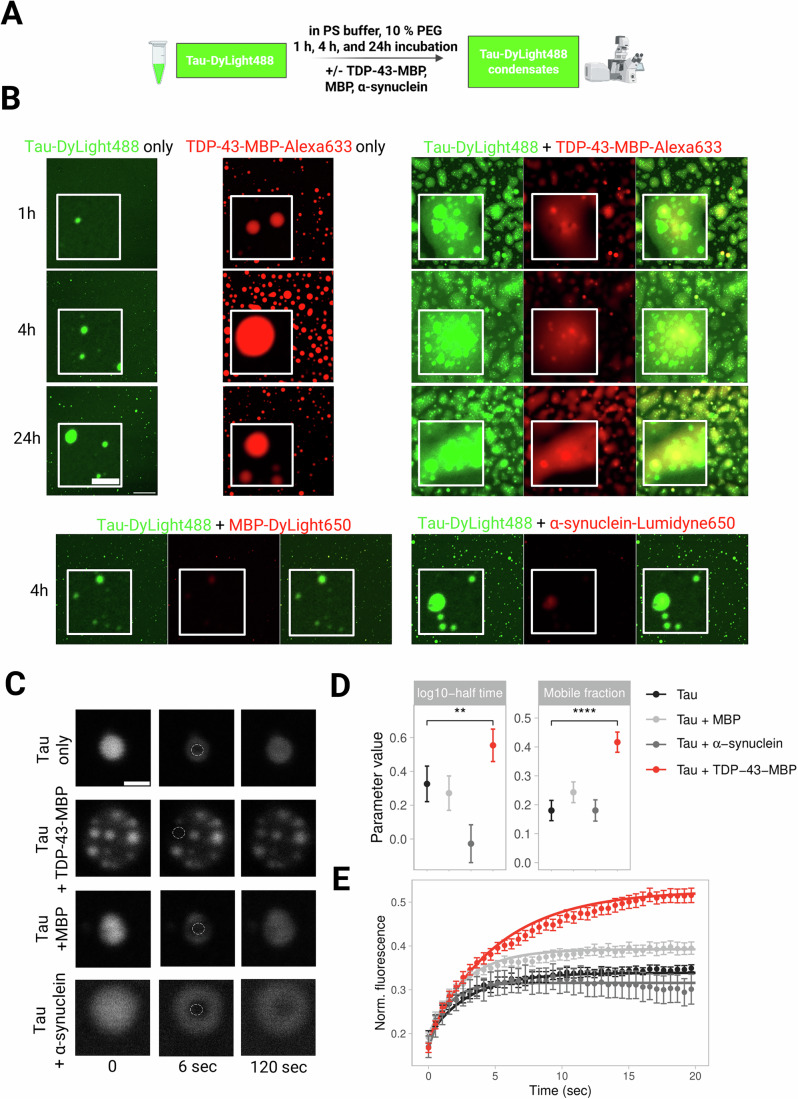
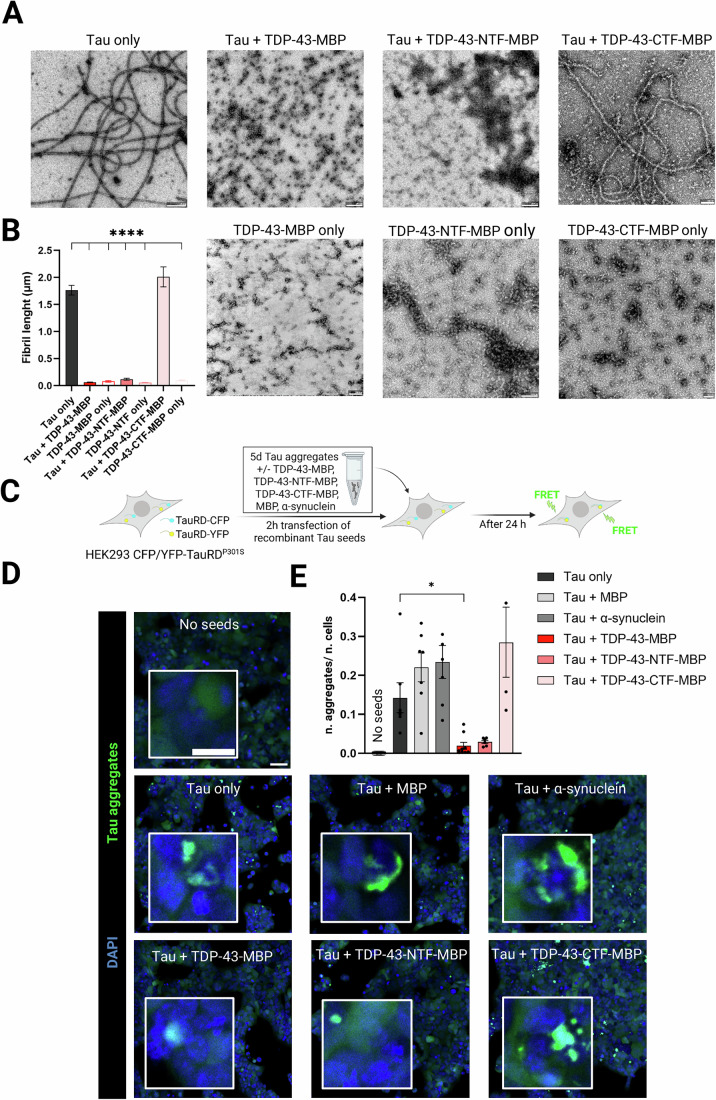
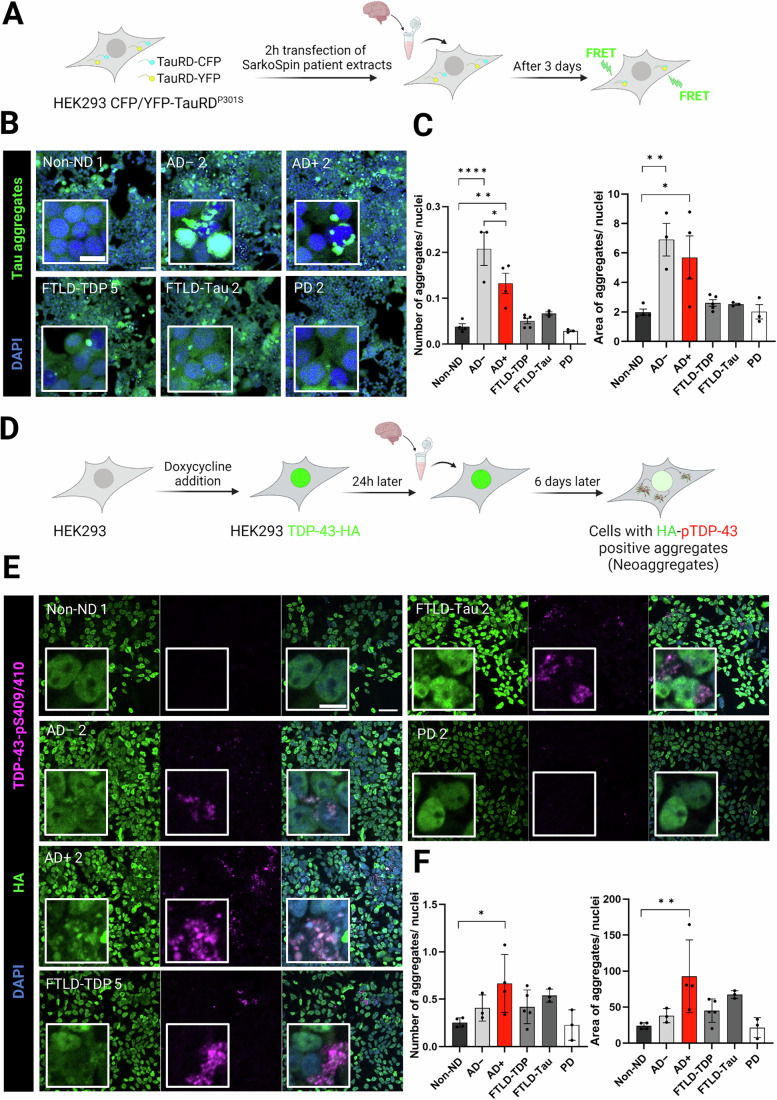
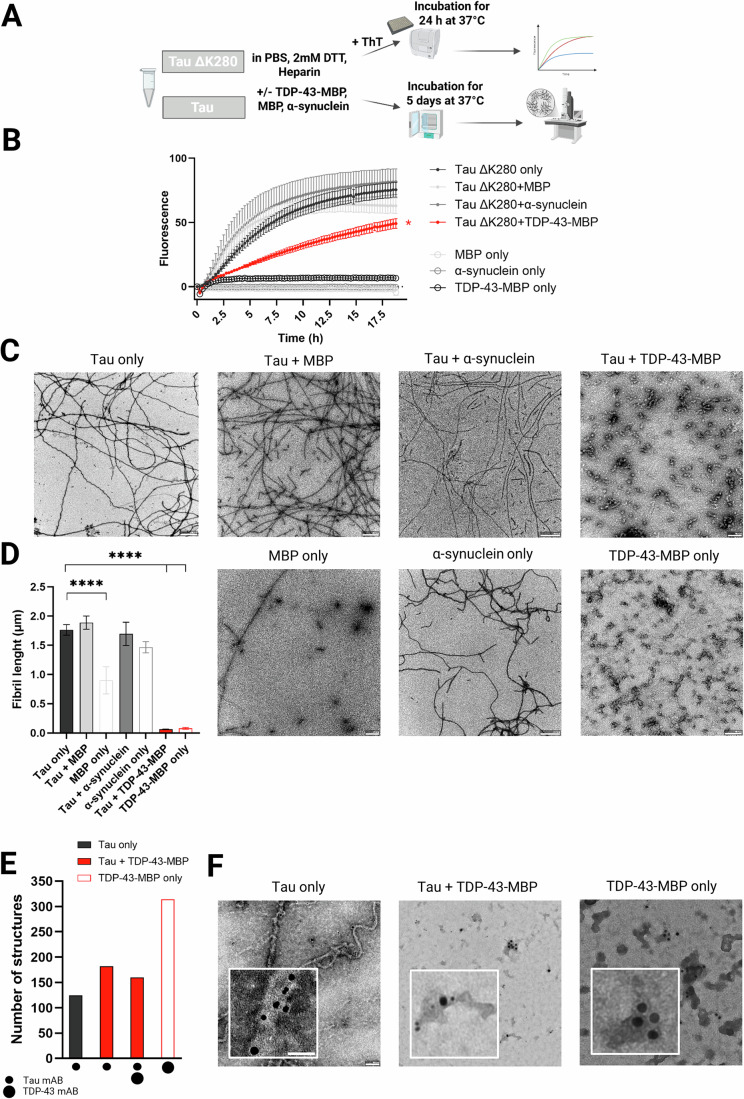
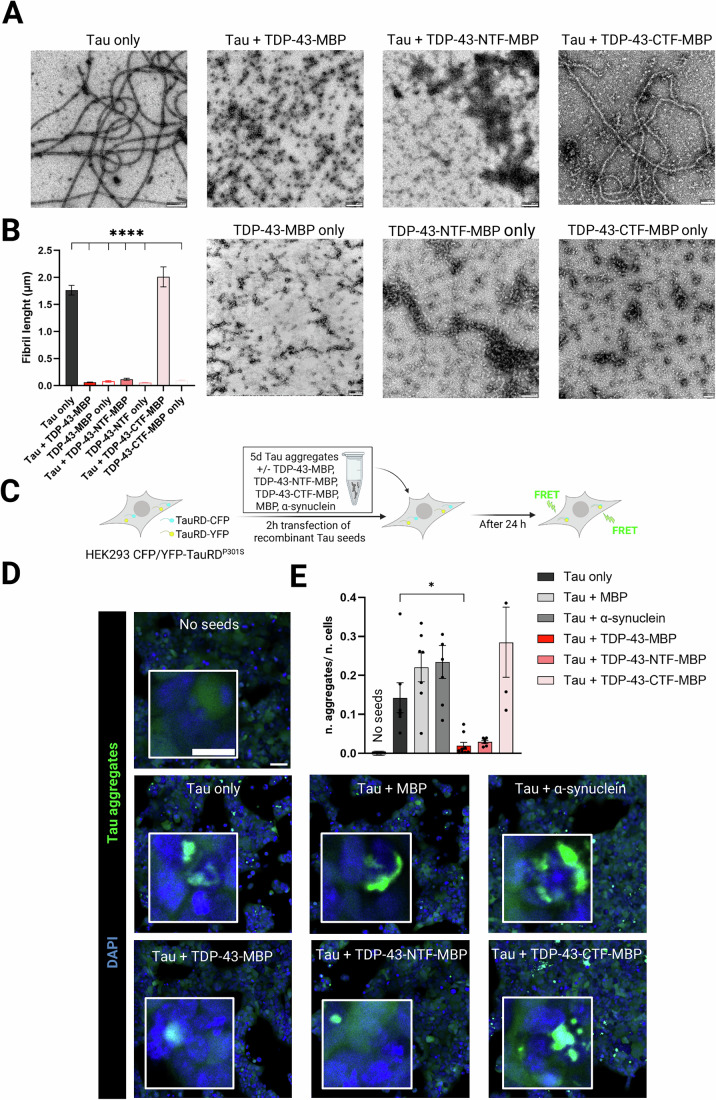
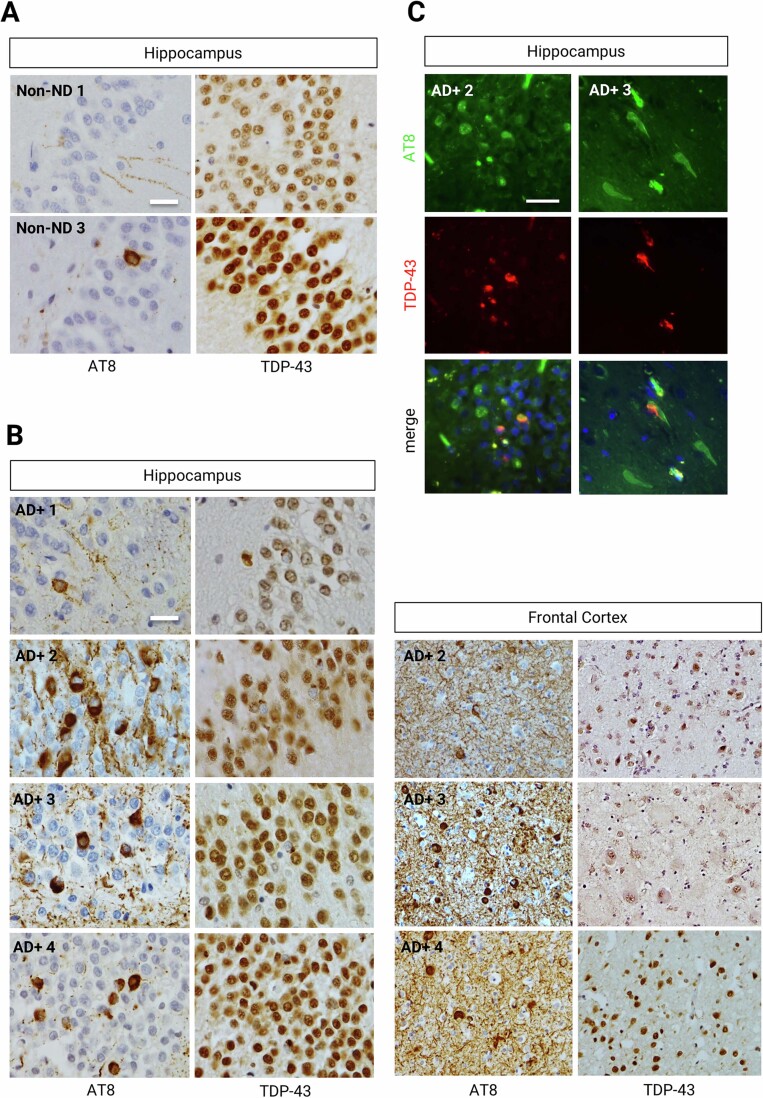
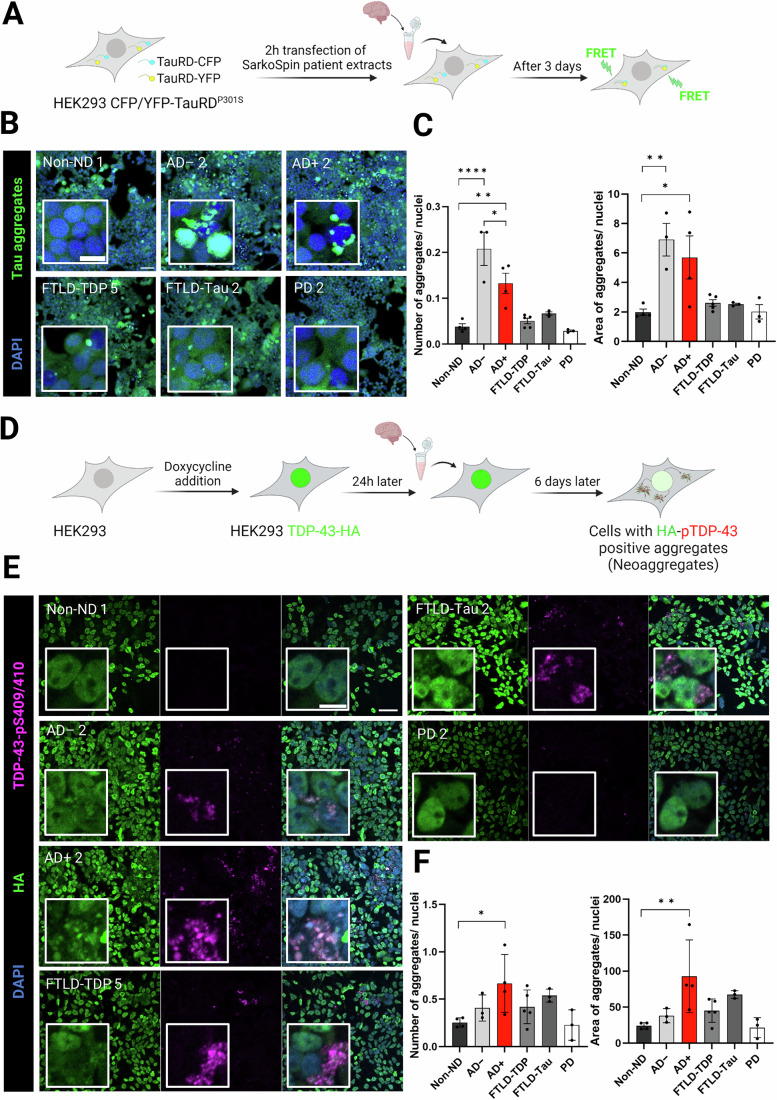
Neuronal aggregates of Tau are a hallmark of Alzheimer’s disease (AD), but more than half of the patients exhibit additional TDP-43 inclusions, while some have co-aggregates of the two proteins. The presence of such co-aggregates is associated with increased disease severity, although whether there is a causal relationship remains unclear. Here, we demonstrate that Tau and TDP-43 mutually promote each other’s condensation through direct interaction in vitro, forming irregularly-shaped or multiphasic co-condensates with lower TDP-43 mobility, but higher Tau mobility. While Tau promotes TDP-43 aggregation in vitro, TDP-43 suppresses formation of Tau fibrils and instead causes formation of oligomeric Tau and Tau/TDP-43 species. These co-assemblies hinder Tau seeding in a biosensor assay specific for proteopathic Tau seeds. Consistent with these data, insoluble material extracted from AD patient brains with Tau/TDP-43 co-aggregates exhibits reduced Tau seeding compared to AD patient brains with Tau aggregates only. In contrast, patient-derived extracts from AD patient brains with Tau/TDP-43 co-aggregates are highly potent in seeding new TDP-43 aggregates in a TDP-43 reporter cell line. Our results suggest that direct interaction between TDP-43 and Tau may suppress Tau pathology, while promoting TDP-43 pathology in Alzheimer’s disease patients.
Overview
The claims and statistics of this paper haven’t been checked yet.
Run the check — free, no account needed. It reads the open-access text and checks the sources it cites.
Integrity signals
Registry
Cites
Statistics
Figures
Verification
Claims the paper makes
The claims and statistics of this paper haven’t been checked yet.
Run the check — free, no account needed. It reads the open-access text and checks the sources it cites.
Claims other papers make about this one
Each is checked against this paper’s own text: does it say what the citing paper says it does?
In the citing paper
“TDP-43 and tau interaction promotes their co-condensation but also suppress tau fibril formation and seeding.10,13”
From A Proline-Rich-Domain-Binding Single Domain Antibody Selectively Inhibits RNA-Induced Phase Separation of Tau (2026) · cites this paper as [10]
In the citing paper
“On the other hand, studies have suggested that phase separation prevents the formation of oligomeric toxic tau species.”
From A Proline-Rich-Domain-Binding Single Domain Antibody Selectively Inhibits RNA-Induced Phase Separation of Tau (2026) · cites this paper as [10]
Self-check
Percentages, sums and reported differences re-computed from the paper’s own numbers.
The self-check needs the paper’s full text.
Citations
Cites
Highly accurate protein structure prediction with AlphaFold
Jumper, J., Evans, R., Pritzel, A., Green, T., Figurnov, M., Ronneberger, O., Tunyasuvunakool, K., Bates, R., Žídek, A., Potapenko, A., et al. (2021) · Nature · doi:10.1038/s41586-021-03819-2 · Cited by 43,764
Protein complex prediction with AlphaFold-Multimer
Evans, R., O’Neill, M., Pritzel, A., Antropova, N., Senior, A., Green, T., Žídek, A., Bates, R., Blackwell, S., Yim, J., et al. (2021) · doi:10.1101/2021.10.04.463034 · Cited by 3,808
Cryo-EM structures of tau filaments from Alzheimer’s disease
Fitzpatrick, A. W. P., Falcon, B., He, S., Murzin, A. G., Murshudov, G., Garringer, H. J., Crowther, R. A., Ghetti, B., Goedert, M., & Scheres, S. H. W. (2017) · Nature · doi:10.1038/nature23002 · Cited by 2,061 · cited 1×
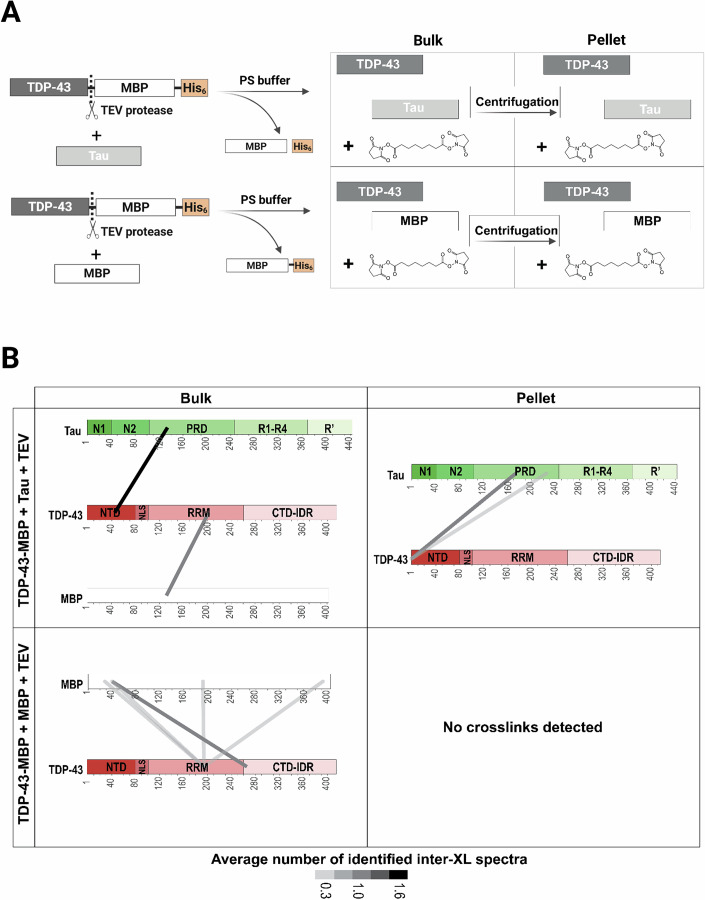
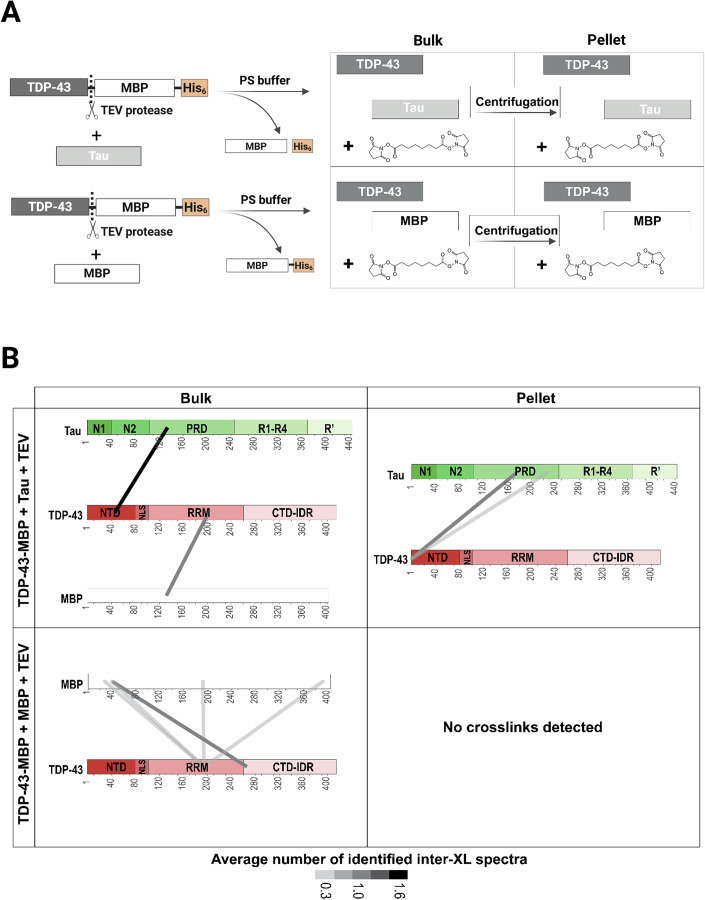
“5), we speculate that TDP-43 under these experimental conditions may bind to the proto fi lament core region of Tau (~306 – 378 aa) (Fitzpatrick et al, 2017; Oakley et al, 2020).”
Long pre-mRNA depletion and RNA missplicing contribute to neuronal vulnerability from loss of TDP-43
Polymenidou, M., Lagier-Tourenne, C., Hutt, K. R., Huelga, S. C., Moran, J., Liang, T. Y., Ling, S.-C., Sun, E., Wancewicz, E., Mazur, C., et al. (2011) · Nature Neuroscience · doi:10.1038/nn.2779 · Cited by 1,335
Self-citationToxic Proteins in Neurodegenerative Disease
Taylor, J. P., Hardy, J., & Fischbeck, K. H. (2002) · Science · doi:10.1126/science.1067122 · Cited by 1,251
Spreading of pathology in neurodegenerative diseases: a focus on human studies
Brettschneider, J., Tredici, K. D., Lee, V. M.-Y., & Trojanowski, J. Q. (2015) · Nature Reviews Neuroscience · doi:10.1038/nrn3887 · Cited by 790
Ambadipudi, S., Biernat, J., Riedel, D., Mandelkow, E., & Zweckstetter, M. (2017) · Nature Communications · doi:10.1038/s41467-017-00480-0 · Cited by 782
Self-citationMelamed, Z., López-Erauskin, J., Baughn, M. W., Zhang, O., Drenner, K., Sun, Y., Freyermuth, F., McMahon, M. A., Beccari, M. S., Artates, J. W., et al. (2019) · Nature Neuroscience · doi:10.1038/s41593-018-0293-z · Cited by 635
Tau oligomers impair memory and induce synaptic and mitochondrial dysfunction in wild-type mice
Lasagna-Reeves, C. A., Castillo-Carranza, D. L., Sengupta, U., Clos, A. L., Jackson, G. R., & Kayed, R. (2011) · Molecular Neurodegeneration · doi:10.1186/1750-1326-6-39 · Cited by 633
Pathogenic protein seeding in Alzheimer disease and other neurodegenerative disorders
Jucker, M., & Walker, L. C. (2011) · Annals of Neurology · doi:10.1002/ana.22615 · Cited by 622 · cited 1×
“These mechanisms give rise to the stereotypical spreading of protein aggregates throughout the brain, which has been observed for the prion protein (PrP), Tau, α - synuclein and TDP-43 (Dujardin and Hyman, 2019; Jucker and Walker, 2011; Polymenidou and Cleveland, 2011; Uemura et al, 2020).”
Phase separation and neurodegenerative diseases: a disturbance in the force
Zbinden, A., Pérez-Berlanga, M., De Rossi, P., & Polymenidou, M. (2020) · Developmental Cell · doi:10.1016/j.devcel.2020.09.014 · Cited by 500
Self-citationPhosphorylated TDP-43 in Alzheimer’s disease and dementia with Lewy bodies
Arai, T., Mackenzie, I. R. A., Hasegawa, M., Nonoka, T., Niizato, K., Tsuchiya, K., Iritani, S., Onaya, M., & Akiyama, H. (2009) · Acta Neuropathologica · doi:10.1007/s00401-008-0480-1 · Cited by 345
TDP-43 is intercellularly transmitted across axon terminals
Feiler, M. S., Strobel, B., Freischmidt, A., Helferich, A. M., Kappel, J., Brewer, B. M., Li, D., Thal, D. R., Walther, P., Ludolph, A. C., et al. (2015) · Journal of Cell Biology · doi:10.1083/jcb.201504057 · Cited by 329
Usenovic, M., Niroomand, S., Drolet, R. E., Yao, L., Gaspar, R. C., Hatcher, N. G., Schachter, J., Renger, J. J., & Parmentier-Batteur, S. (2015) · The Journal of Neuroscience · doi:10.1523/jneurosci.1523-15.2015 · Cited by 245
TAR DNA‐binding protein 43 and pathological subtype of Alzheimer's disease impact clinical features
Josephs, K. A., Whitwell, J. L., Tosakulwong, N., Weigand, S. D., Murray, M. E., Liesinger, A. M., Petrucelli, L., Senjem, M. L., Ivnik, R. J., Parisi, J. E., et al. (2015) · Annals of Neurology · doi:10.1002/ana.24493 · Cited by 147
Hochmair, J., Exner, C., Franck, M., Dominguez‐Baquero, A., Diez, L., Brognaro, H., Kraushar, M. L., Mielke, T., Radbruch, H., Kaniyappan, S., et al. (2022) · The EMBO Journal · doi:10.15252/embj.2021108882 · Cited by 106
Self-citationSystematic discovery of protein interaction interfaces using AlphaFold and experimental validation
Lee, C. Y., Hubrich, D., Varga, J. K., Schäfer, C., Welzel, M., Schumbera, E., Djokic, M., Strom, J. M., Schönfeld, J., Geist, J. L., et al. (2024) · Molecular Systems Biology · doi:10.1038/s44320-023-00005-6 · Cited by 105 · cited 2×
“AlphaFold prediction of crosslinking: AlphaFold2 multimer (version 2.3) (Evans et al, 2021; Jumper et al, 2021) to model the interaction between TDP-43 and TAU using a fragmented approach (Lee et al, 2024).”
InfluentialSystematic discovery of protein interaction interfaces using AlphaFold and experimental validation
Lee, C. Y., Hubrich, D., Varga, J. K., Schäfer, C., Welzel, M., Schumbera, E., Đokić, M., Strom, J. M., Schönfeld, J., Geist, J. L., et al. (2023) · doi:10.1101/2023.08.07.552219 · Cited by 105
Tau and TDP-43 proteinopathies: kindred pathologic cascades and genetic pleiotropy
Chornenkyy, Y., Fardo, D. W., & Nelson, P. T. (2019) · Laboratory Investigation · doi:10.1038/s41374-019-0196-y · Cited by 93
Research works printed but not linked: 101
- Afroz T, Hock E-M, Ernst P, Foglieni C, Jambeau M, Gilhespy LAB, Laferriere F, Maniecka Z, Plückthun A, Mittl P, Paganetti P, Allain FHT, Polymenidou M (2017) Functional and dynamic polymerization of the ALS-linked protein TDP-43 antagonizes its pathologic aggregation. Nat Commun 8:45. https://doi.org/10.1038/s41467-017-00062-0 · DOI
- Alberti S, Dormann D (2019) Liquid-liquid phase separation in disease. Annu Rev Genet 53:171–194. https://doi.org/10.1146/annurev-genet-112618-043527 · DOI
- Alberti S, Gladfelter A, Mittag T (2019) Considerations and challenges in studying liquid-liquid phase separation and biomolecular condensates. Cell 176:419–434. https://doi.org/10.1016/j.cell.2018.12.035 · DOI · Paper page
- Alberti S, Hyman AA (2016) Are aberrant phase transitions a driver of cellular aging?. BioEssays N Rev Mol Cell Dev Biol 38:959–968. https://doi.org/10.1002/bies.201600042 · DOI
- Amador-Ortiz C, Lin W-L, Ahmed Z, Personett D, Davies P, Duara R, Graff-Radford NR, Hutton ML, Dickson DW (2007) TDP-43 immunoreactivity in hippocampal sclerosis and Alzheimer’s disease. Ann Neurol 61:435–445. https://doi.org/10.1002/ana.21154 · DOI · Paper page
- Ash PEA, Lei S, Shattuck J, Boudeau S, Carlomagno Y, Medalla M, Mashimo BL, Socorro G, Al-Mohanna LFA, Jiang L, Öztürk MM, Knobel M, Ivanov P, Petrucelli L, Wegmann S, Kanaan NM, Wolozin B (2021) TIA1 potentiates tau phase separation and promotes generation of toxic oligomeric tau. Proc Natl Acad Sci USA 118:e2014188118. https://doi.org/10.1073/pnas.2014188118 · DOI · Paper page
- Barghorn S, Biernat J, Mandelkow E (2005) Purification of recombinant tau protein and preparation of Alzheimer-paired helical filaments in vitro. Methods Mol Biol 299:35–51. https://doi.org/10.1385/1-59259-874-9:035 · DOI
- Barghorn S, Zheng-Fischhöfer Q, Ackmann M, Biernat J, von Bergen M, Mandelkow EM, Mandelkow E (2000) Structure, microtubule interactions, and paired helical filament aggregation by tau mutants of frontotemporal dementias. Biochemistry 39:11714–11721. https://doi.org/10.1021/bi000850r · DOI
- Bentmann E, Neumann M, Tahirovic S, Rodde R, Dormann D, Haass C (2012) Requirements for stress granule recruitment of fused in sarcoma (FUS) and TAR DNA-binding protein of 43 kDa (TDP-43). J Biol Chem 287:23079–23094. https://doi.org/10.1074/jbc.M111.328757 · DOI
- Berger Z, Roder H, Hanna A, Carlson A, Rangachari V, Yue M, Wszolek Z, Ashe K, Knight J, Dickson D, Andorfer C, Rosenberry TL, Lewis J, Hutton M, Janus C (2007) Accumulation of pathological tau species and memory loss in a conditional model of tauopathy. J Neurosci 27:3650–3662. https://doi.org/10.1523/JNEUROSCI.0587-07.2007 · DOI
- Boczek EE, Fürsch J, Niedermeier ML, Jawerth L, Jahnel M, Ruer-Gruß M, Kammer K-M, Heid P, Mediani L, Wang J, Yan X, Pozniakovski A, Poser I, Mateju D, Hubatsch L, Carra S, Alberti S, Hyman AA, Stengel F (2021) HspB8 prevents aberrant phase transitions of FUS by chaperoning its folded RNA-binding domain. eLife 10:e69377. https://doi.org/10.7554/eLife.69377 · DOI
- Braak H, Braak E (1995) Staging of Alzheimer’s disease-related neurofibrillary changes. Neurobiol Aging 16:271–278. https://doi.org/10.1016/0197-4580(95)00021-6 discussion 278-284 · DOI · Paper page
- Chakraborty P, Ibáñez De Opakua A, Purslow JA, Fromm SA, Chatterjee D, Zachrdla M, Zhuang S, Puri S, Wolozin B, Zweckstetter M (2024) GSK3β phosphorylation catalyzes the aggregation of tau into Alzheimer’s disease-like filaments. Proc Natl Acad Sci 121:e2414176121. https://doi.org/10.1073/pnas.2414176121 · DOI · Paper page
- Chang C, Wu T-H, Wu C-Y, Chiang M, Toh EK-W, Hsu Y-C, Lin K-F, Liao Y, Huang T, Huang JJ-T (2012) The N-terminus of TDP-43 promotes its oligomerization and enhances DNA binding affinity. Biochem Biophys Res Commun 425:219–224. https://doi.org/10.1016/j.bbrc.2012.07.071 · DOI
- Chou C-C, Zhang Y, Umoh ME, Vaughan SW, Lorenzini I, Liu F, Sayegh M, Donlin-Asp PG, Chen YH, Duong DM, Seyfried NT, Powers MA, Kukar T, Hales CM, Gearing M, Cairns NJ, Boylan KB, Dickson DW, Rademakers R, Zhang Y-J, Petrucelli L, Sattler R, Zarnescu DC, Glass JD, Rossoll W (2018) TDP-43 pathology disrupts nuclear pore complexes and nucleocytoplasmic transport in ALS/FTD. Nat Neurosci 21:228–239. https://doi.org/10.1038/s41593-017-0047-3 · DOI
- Clippinger AK, D’Alton S, Lin W-L, Gendron TF, Howard J, Borchelt DR, Cannon A, Carlomagno Y, Chakrabarty P, Cook C, Golde TE, Levites Y, Ranum L, Schultheis PJ, Xu G, Petrucelli L, Sahara N, Dickson DW, Giasson B, Lewis J (2013) Robust cytoplasmic accumulation of phosphorylated TDP-43 in transgenic models of tauopathy. Acta Neuropathol 126:39–50. https://doi.org/10.1007/s00401-013-1123-8 · DOI
- Combe CW, Graham M, Kolbowski L, Fischer L, Rappsilber J (2024) xiVIEW: visualisation of crosslinking mass spectrometry data. J Mol Biol 436:168656. https://doi.org/10.1016/j.jmb.2024.168656 · DOI
- Conicella AE, Dignon GL, Zerze GH, Schmidt HB, D’Ordine AM, Kim YC, Rohatgi R, Ayala YM, Mittal J, Fawzi NL (2020) TDP-43 α-helical structure tunes liquid-liquid phase separation and function. Proc Natl Acad Sci USA 117:5883–5894. https://doi.org/10.1073/pnas.1912055117 · DOI
- Conicella AE, Zerze GH, Mittal J, Fawzi NL (2016) ALS mutations disrupt phase separation mediated by α-helical structure in the TDP-43 low-complexity C-terminal domain. Struct Lond Engl 24:1537–1549. https://doi.org/10.1016/j.str.2016.07.007 1993 · DOI
- Cox J, Mann M (2008) MaxQuant enables high peptide identification rates, individualized p.p.b.-range mass accuracies and proteome-wide protein quantification. Nat Biotechnol 26:1367–1372. https://doi.org/10.1038/nbt.1511 · DOI · Paper page
- Czub MP, Uliana F, Grubić T, Padeste C, Rosowski KA, Lorenz C, Dufresne ER, Menzel A, Vakonakis I, Gasser U, Steinmetz MO (2025) Phase separation of a microtubule plus-end tracking protein into a fluid fractal network. Nat Commun 16:1165. https://doi.org/10.1038/s41467-025-56468-8 · DOI · Paper page
- D’Angelo MA, Raices M, Panowski SH, Hetzer MW (2009) Age-dependent deterioration of nuclear pore complexes causes a loss of nuclear integrity in postmitotic cells. Cell 136:284–295. https://doi.org/10.1016/j.cell.2008.11.037 · DOI · Paper page
- Das T, Zaidi FK, Farag M, Ruff KM, Mahendran TS, Singh A, Gui X, Messing J, Taylor JP, Banerjee PR, Pappu RV, Mittag T (2025) Tunable metastability of condensates reconciles their dual roles in amyloid fibril formation. Mol Cell 85:2230–2245.e7. https://doi.org/10.1016/j.molcel.2025.05.011 · DOI
- Davis SA, Gan KA, Dowell JA, Cairns NJ, Gitcho MA (2017) TDP-43 expression influences amyloid β plaque deposition and tau aggregation. Neurobiol Dis 103:154–162. https://doi.org/10.1016/j.nbd.2017.04.012 · DOI
- De Rossi P, Lewis AJ, Furrer J, De Vos L, Demeter T, Zbinden A, Zhong W, Wiersma VI, Scialo C, Weber J, Guo Z, Scaramuzza S, Di Fabrizio M, Böing C, Castaño-Díez D, Al-Amoudi A, Pérez-Berlanga M, Lashley T, Stahlberg H, Polymenidou M (2021) FTLD-TDP assemblies seed neoaggregates with subtype-specific features via a prion-like cascade. EMBO Rep 22:e53877. https://doi.org/10.15252/embr.202153877 · DOI
- Deutsch EW, Bandeira N, Perez-Riverol Y, Sharma V, Carver JJ, Mendoza L, Kundu DJ, Wang S, Bandla C, Kamatchinathan S, Hewapathirana S, Pullman BS, Wertz J, Sun Z, Kawano S, Okuda S, Watanabe Y, MacLean B, MacCoss MJ, Zhu Y, Ishihama Y, Vizcaíno JA (2023) The ProteomeXchange consortium at 10 years: 2023 update. Nucleic Acids Res 51:D1539–D1548. https://doi.org/10.1093/nar/gkac1040 · DOI
- Dewey CM, Cenik B, Sephton CF, Dries DR, Mayer P, Good SK, Johnson BA, Herz J, Yu G (2011) TDP-43 is directed to stress granules by sorbitol, a novel physiological osmotic and oxidative stressor. Mol Cell Biol 31:1098–1108. https://doi.org/10.1128/MCB.01279-10 · DOI
- Dhakal S, Mondal M, Mirzazadeh A, Banerjee S, Ghosh A, Rangachari V (2023) α-Synuclein emulsifies TDP-43 prion-like domain—RNA liquid droplets to promote heterotypic amyloid fibrils. Commun Biol 6:1227. https://doi.org/10.1038/s42003-023-05608-1 · DOI
- Dujardin S, Hyman BT (2019) Tau prion-like propagation: state of the art and current challenges. Adv Exp Med Biol 1184:305–325. https://doi.org/10.1007/978-981-32-9358-8_23 · DOI · Paper page
- Eidenmüller J, Fath T, Maas T, Pool M, Sontag E, Brandt R (2001) Phosphorylation-mimicking glutamate clusters in the proline-rich region are sufficient to simulate the functional deficiencies of hyperphosphorylated tau protein. Biochem J 357:759–767. https://doi.org/10.1042/0264-6021:3570759 · DOI
- Emmanouilidis L, Bartalucci E, Kan Y, Ijavi M, Pérez ME, Afanasyev P, Boehringer D, Zehnder J, Parekh SH, Bonn M, Michaels TCT, Wiegand T, Allain FH-T (2024) A solid beta-sheet structure is formed at the surface of FUS droplets during aging. Nat Chem Biol. https://doi.org/10.1038/s41589-024-01573-w · DOI
- French RL, Grese ZR, Aligireddy H, Dhavale DD, Reeb AN, Kedia N, Kotzbauer PT, Bieschke J, Ayala YM (2019) Detection of TAR DNA-binding protein 43 (TDP-43) oligomers as initial intermediate species during aggregate formation. J Biol Chem 294:6696–6709. https://doi.org/10.1074/jbc.RA118.005889 · DOI
- Gracia P, Polanco D, Tarancón-Díez J, Serra I, Bracci M, Oroz J, Laurents DV, García I, Cremades N (2022) Molecular mechanism for the synchronized electrostatic coacervation and co-aggregation of alpha-synuclein and tau. Nat Commun 13:4586. https://doi.org/10.1038/s41467-022-32350-9 · DOI
- Gruijs da Silva LA, Simonetti F, Hutten S, Riemenschneider H, Sternburg EL, Pietrek LM, Gebel J, Dötsch V, Edbauer D, Hummer G, Stelzl LS, Dormann D (2022) Disease-linked TDP-43 hyperphosphorylation suppresses TDP-43 condensation and aggregation. EMBO J 41:e108443. https://doi.org/10.15252/embj.2021108443 · DOI · Paper page
- Guo T, Noble W, Hanger DP (2017) Roles of tau protein in health and disease. Acta Neuropathol 133:665–704. https://doi.org/10.1007/s00401-017-1707-9 · DOI · Paper page
- Halfmann R, Lindquist S (2008) Screening for amyloid aggregation by semi-denaturing detergent-agarose gel electrophoresis. J Vis Exp. https://doi.org/10.3791/838 · DOI
- Hernández-Vega A, Braun M, Scharrel L, Jahnel M, Wegmann S, Hyman BT, Alberti S, Diez S, Hyman AA (2017) Local nucleation of microtubule bundles through tubulin concentration into a condensed tau phase. Cell Rep 20:2304–2312. https://doi.org/10.1016/j.celrep.2017.08.042 · DOI · Paper page
- Hofweber M, Hutten S, Bourgeois B, Spreitzer E, Niedner-Boblenz A, Schifferer M, Ruepp M-D, Simons M, Niessing D, Madl T, Dormann D (2018) Phase separation of FUS is suppressed by its nuclear import receptor and arginine methylation. Cell 173:706–719.e13. https://doi.org/10.1016/j.cell.2018.03.004 · DOI
- Holmes BB, Furman JL, Mahan TE, Yamasaki TR, Mirbaha H, Eades WC, Belaygorod L, Cairns NJ, Holtzman DM, Diamond MI (2014) Proteopathic tau seeding predicts tauopathy in vivo. Proc Natl Acad Sci USA. https://doi.org/10.1073/pnas.1411649111 · DOI · Paper page
- Hoyer W, Antony T, Cherny D, Heim G, Jovin TM, Subramaniam V (2002) Dependence of alpha-synuclein aggregate morphology on solution conditions. J Mol Biol 322:383–393. https://doi.org/10.1016/s0022-2836(02)00775-1 · DOI
- Hutten S, Usluer S, Bourgeois B, Simonetti F, Odeh HM, Fare CM, Czuppa M, Hruska-Plochan M, Hofweber M, Polymenidou M, Shorter J, Edbauer D, Madl T, Dormann D (2020) Nuclear import receptors directly bind to arginine-rich dipeptide repeat proteins and suppress their pathological interactions. Cell Rep 33:108538. https://doi.org/10.1016/j.celrep.2020.108538 · DOI
- Jaqaman K, Loerke D, Mettlen M, Kuwata H, Grinstein S, Schmid SL, Danuser G (2008) Robust single-particle tracking in live-cell time-lapse sequences. Nat Methods 5:695–702. https://doi.org/10.1038/nmeth.1237 · DOI
- Josephs KA, Dickson DW, Tosakulwong N, Weigand SD, Murray ME, Petrucelli L, Liesinger AM, Senjem ML, Spychalla AJ, Knopman DS, Parisi JE, Petersen RC, Jack CR, Whitwell JL (2017) Rates of hippocampal atrophy and presence of post-mortem TDP-43 in patients with Alzheimer’s disease: a longitudinal retrospective study. Lancet Neurol 16:917–924. https://doi.org/10.1016/S1474-4422(17)30284-3 · DOI · Paper page
- Josephs KA, Murray ME, Whitwell JL, Parisi JE, Petrucelli L, Jack CR, Petersen RC, Dickson DW (2014a) Staging TDP-43 pathology in Alzheimer’s disease. Acta Neuropathol 127:441–450. https://doi.org/10.1007/s00401-013-1211-9 · DOI · Paper page
- Josephs KA, Whitwell JL, Weigand SD, Murray ME, Tosakulwong N, Liesinger AM, Petrucelli L, Senjem ML, Knopman DS, Boeve BF, Ivnik RJ, Smith GE, Jack CR, Parisi JE, Petersen RC, Dickson DW (2014b) TDP-43 is a key player in the clinical features associated with Alzheimer’s disease. Acta Neuropathol 127:811–824. https://doi.org/10.1007/s00401-014-1269-z · DOI · Paper page
- Kadokura A, Yamazaki T, Lemere CA, Takatama M, Okamoto K (2009) Regional distribution of TDP-43 inclusions in Alzheimer disease (AD) brains: their relation to AD common pathology. Neuropathol J Jpn Soc Neuropathol 29:566–573. https://doi.org/10.1111/j.1440-1789.2009.01017.x · DOI
- Kanaan NM, Hamel C, Grabinski T, Combs B (2020) Liquid-liquid phase separation induces pathogenic tau conformations in vitro. Nat Commun 11:2809. https://doi.org/10.1038/s41467-020-16580-3 · DOI · Paper page
- Koulouras G, Panagopoulos A, Rapsomaniki MA, Giakoumakis NN, Taraviras S, Lygerou Z (2018) EasyFRAP-web: a web-based tool for the analysis of fluorescence recovery after photobleaching data. Nucleic Acids Res 46:W467–W472. https://doi.org/10.1093/nar/gky508 · DOI
- Laferrière F, Maniecka Z, Pérez-Berlanga M, Hruska-Plochan M, Gilhespy L, Hock E-M, Wagner U, Afroz T, Boersema PJ, Barmettler G, Foti SC, Asi YT, Isaacs AM, Al-Amoudi A, Lewis A, Stahlberg H, Ravits J, De Giorgi F, Ichas F, Bezard E, Picotti P, Lashley T, Polymenidou M (2019) TDP-43 extracted from frontotemporal lobar degeneration subject brains displays distinct aggregate assemblies and neurotoxic effects reflecting disease progression rates. Nat Neurosci 22:65–77. https://doi.org/10.1038/s41593-018-0294-y · DOI
- Lashley T, Rohrer JD, Bandopadhyay R, Fry C, Ahmed Z, Isaacs AM, Brelstaff JH, Borroni B, Warren JD, Troakes C, King A, Al-Saraj S, Newcombe J, Quinn N, Ostergaard K, Schrøder HD, Bojsen-Møller M, Braendgaard H, Fox NC, Rossor MN, Lees AJ, Holton JL, Revesz T (2011) A comparative clinical, pathological, biochemical and genetic study of fused in sarcoma proteinopathies. Brain J Neurol 134:2548–2564. https://doi.org/10.1093/brain/awr160 · DOI
- Latimer CS, Liachko NF (2021) Tau and TDP-43 synergy: a novel therapeutic target for sporadic late-onset Alzheimer’s disease. GeroScience 43:1627–1634. https://doi.org/10.1007/s11357-021-00407-0 · DOI
- Latimer CS, Stair JG, Hincks JC, Currey HN, Bird TD, Keene CD, Kraemer BC, Liachko NF (2022) TDP-43 promotes tau accumulation and selective neurotoxicity in bigenic Caenorhabditis elegans. Dis Model Mech 15:dmm049323. https://doi.org/10.1242/dmm.049323 · DOI
- Leitner A, Walzthoeni T, Aebersold R (2014) Lysine-specific chemical cross-linking of protein complexes and identification of cross-linking sites using LC-MS/MS and the xQuest/xProphet software pipeline. Nat Protoc 9:120–137. https://doi.org/10.1038/nprot.2013.168 · DOI
- Ling S-C, Polymenidou M, Cleveland DW (2013) Converging mechanisms in ALS and FTD: disrupted RNA and protein homeostasis. Neuron 79:416–438. https://doi.org/10.1016/j.neuron.2013.07.033 · DOI · Paper page
- Linsenmeier M, Faltova L, Morelli C, Capasso Palmiero U, Seiffert C, Küffner AM, Pinotsi D, Zhou J, Mezzenga R, Arosio P (2023) The interface of condensates of the hnRNPA1 low-complexity domain promotes formation of amyloid fibrils. Nat Chem 15:1340–1349. https://doi.org/10.1038/s41557-023-01289-9 · DOI
- Lipiński WP, Visser BS, Robu I, Fakhree MAA, Lindhoud S, Claessens MMAE, Spruijt E (2022) Biomolecular condensates can both accelerate and suppress aggregation of α-synuclein. Sci Adv 8:eabq6495. https://doi.org/10.1126/sciadv.abq6495 · DOI
- Meneses A, Koga S, O’Leary J, Dickson DW, Bu G, Zhao N (2021) TDP-43 pathology in Alzheimer’s disease. Mol Neurodegener 16:84. https://doi.org/10.1186/s13024-021-00503-x · DOI
- Mixed-Effects Models in S and S-PLUS (2000) Statistics and computing. Springer-Verlag, New York
- Molliex A, Temirov J, Lee J, Coughlin M, Kanagaraj AP, Kim HJ, Mittag T, Taylor JP (2015) Phase separation by low complexity domains promotes stress granule assembly and drives pathological fibrillization. Cell 163:123–133. https://doi.org/10.1016/j.cell.2015.09.015 · DOI · Paper page
- Montalbano M, McAllen S, Cascio FL, Sengupta U, Garcia S, Bhatt N, Ellsworth A, Heidelman EA, Johnson OD, Doskocil S, Kayed R (2020) TDP-43 and tau oligomers in Alzheimer’s disease, amyotrophic lateral sclerosis, and frontotemporal dementia. Neurobiol Dis 146:105130. https://doi.org/10.1016/j.nbd.2020.105130 · DOI
- Nedelsky NB, Taylor JP (2019) Bridging biophysics and neurology: aberrant phase transitions in neurodegenerative disease. Nat Rev Neurol 15:272–286. https://doi.org/10.1038/s41582-019-0157-5 · DOI
- Nelson PT, Dickson DW, Trojanowski JQ, Jack CR, Boyle PA, Arfanakis K, Rademakers R, Alafuzoff I, Attems J, Brayne C, Coyle-Gilchrist ITS, Chui HC, Fardo DW, Flanagan ME, Halliday G, Hokkanen SRK, Hunter S, Jicha GA, Katsumata Y, Kawas CH, Keene CD, Kovacs GG, Kukull WA, Levey AI, Makkinejad N, Montine TJ, Murayama S, Murray ME, Nag S, Rissman RA, Seeley WW, Sperling RA, White Iii CL, Yu L, Schneider JA (2019) Limbic-predominant age-related TDP-43 encephalopathy (LATE): consensus working group report. Brain J Neurol 142:1503–1527. https://doi.org/10.1093/brain/awz099 · DOI · Paper page
- Neumann M, Sampathu DM, Kwong LK, Truax AC, Micsenyi MC, Chou TT, Bruce J, Schuck T, Grossman M, Clark CM, McCluskey LF, Miller BL, Masliah E, Mackenzie IR, Feldman H, Feiden W, Kretzschmar HA, Trojanowski JQ, Lee VM-Y (2006) Ubiquitinated TDP-43 in frontotemporal lobar degeneration and amyotrophic lateral sclerosis. Science 314:130–133. https://doi.org/10.1126/science.1134108 · DOI · Paper page
- Nuscher B, Kamp F, Mehnert T, Odoy S, Haass C, Kahle PJ, Beyer K (2004) Alpha-synuclein has a high affinity for packing defects in a bilayer membrane: a thermodynamics study. J Biol Chem 279:21966–21975. https://doi.org/10.1074/jbc.M401076200 · DOI
- Oakley SS, Maina MB, Marshall KE, Al-Hilaly YK, Harrington CR, Wischik CM, Serpell LC (2020) Tau filament self-assembly and structure: tau as a therapeutic target. Front Neurol 11:590754. https://doi.org/10.3389/fneur.2020.590754 · DOI
- Patel A, Lee HO, Jawerth L, Maharana S, Jahnel M, Hein MY, Stoynov S, Mahamid J, Saha S, Franzmann TM, Pozniakovski A, Poser I, Maghelli N, Royer LA, Weigert M, Myers EW, Grill S, Drechsel D, Hyman AA, Alberti S (2015) A liquid-to-solid phase transition of the ALS protein FUS accelerated by disease mutation. Cell 162:1066–1077. https://doi.org/10.1016/j.cell.2015.07.047 · DOI · Paper page
- Perez-Riverol Y, Bandla C, Kundu DJ, Kamatchinathan S, Bai J, Hewapathirana S, John NS, Prakash A, Walzer M, Wang S, Vizcaíno JA (2025) The PRIDE database at 20 years: 2025 update. Nucleic Acids Res 53:D543–D553. https://doi.org/10.1093/nar/gkae1011 · DOI
- Polymenidou M, Cleveland DW (2011) The seeds of neurodegeneration: prion-like spreading in ALS. Cell 147:498–508. https://doi.org/10.1016/j.cell.2011.10.011 · DOI
- Rai SK, Khanna R, Avni A, Mukhopadhyay S (2023) Heterotypic electrostatic interactions control complex phase separation of tau and prion into multiphasic condensates and co-aggregates. Proc Natl Acad Sci USA 120:e2216338120. https://doi.org/10.1073/pnas.2216338120 · DOI
- Ratti A, Buratti E (2016) Physiological functions and pathobiology of TDP-43 and FUS/TLS proteins. J Neurochem 138:95–111. https://doi.org/10.1111/jnc.13625 · DOI
- Ray S, Singh N, Kumar R, Patel K, Pandey S, Datta D, Mahato J, Panigrahi R, Navalkar A, Mehra S, Gadhe L, Chatterjee D, Sawner AS, Maiti S, Bhatia S, Gerez JA, Chowdhury A, Kumar A, Padinhateeri R, Riek R, Krishnamoorthy G, Maji SK (2020) α-Synuclein aggregation nucleates through liquid-liquid phase separation. Nat Chem 12:705–716. https://doi.org/10.1038/s41557-020-0465-9 · DOI · Paper page
- Ruf VC, Nübling GS, Willikens S, Shi S, Schmidt F, Levin J, Bötzel K, Kamp F, Giese A (2019) Different effects of α-synuclein mutants on lipid binding and aggregation detected by single molecule fluorescence spectroscopy and ThT fluorescence-based measurements. ACS Chem Neurosci 10:1649–1659. https://doi.org/10.1021/acschemneuro.8b00579 · DOI
- Ruf VC, Shi S, Schmidt F, Weckbecker D, Nübling GS, Ködel U, Mollenhauer B, Giese A (2020) Potential sources of interference with the highly sensitive detection and quantification of alpha-synuclein seeds by qRT-QuIC. FEBS Open Bio 10:883–893. https://doi.org/10.1002/2211-5463.12844 · DOI
- Rummens J, Khalil B, Yıldırım G, Silva P, Zorzini V, Peredo N, Wojno M, Ramakers M, Van Den Bosch L, Van Damme P, Davie K, Hendrix J, Rousseau F, Schymkowitz J, Da Cruz S (2025) TDP-43 seeding induces cytoplasmic aggregation heterogeneity and nuclear loss of function of TDP-43. Neuron 113:1597–1613.e8. https://doi.org/10.1016/j.neuron.2025.03.004 · DOI
- Sahin C, Leppert A, Landreh M (2023) Advances in mass spectrometry to unravel the structure and function of protein condensates. Nat Protoc 18:3653–3661. https://doi.org/10.1038/s41596-023-00900-0 · DOI
- Schindelin J, Arganda-Carreras I, Frise E, Kaynig V, Longair M, Pietzsch T, Preibisch S, Rueden C, Saalfeld S, Schmid B, Tinevez J-Y, White DJ, Hartenstein V, Eliceiri K, Tomancak P, Cardona A (2012) Fiji: an open-source platform for biological-image analysis. Nat Methods 9:676–682. https://doi.org/10.1038/nmeth.2019 · DOI · Paper page
- Scialò C, Zhong W, Jagannath S, Wilkins O, Caredio D, Hruska-Plochan M, Lurati F, Peter M, De Cecco E, Celauro L, Aguzzi A, Legname G, Fratta P, Polymenidou M (2025) Seeded aggregation of TDP-43 induces its loss of function and reveals early pathological signatures. Neuron 113:1614–1628.e11. https://doi.org/10.1016/j.neuron.2025.03.008 · DOI
- Shen YI, Chen A, Wang W, Shen Y, Ruggeri FS, Aime S, Wang Z, Qamar S, Espinosa JR, Garaizar A, St George-Hyslop P, Collepardo-Guevara R, Weitz DA, Vigolo D, Knowles TPJ (2023) The liquid-to-solid transition of FUS is promoted by the condensate surface. Proc Natl Acad Sci USA 120:e2301366120. https://doi.org/10.1073/pnas.2301366120 · DOI
- Shih Y-H, Tu L-H, Chang T-Y, Ganesan K, Chang W-W, Chang P-S, Fang Y-S, Lin Y-T, Jin L-W, Chen Y-R (2020) TDP-43 interacts with amyloid-β, inhibits fibrillization, and worsens pathology in a model of Alzheimer’s disease. Nat Commun 11:5950. https://doi.org/10.1038/s41467-020-19786-7 · DOI
- Smith VD, Bachstetter AD, Ighodaro E, Roberts K, Abner EL, Fardo DW, Nelson PT (2017) Overlapping but distinct TDP-43 and tau pathologic patterns in aged hippocampi. Brain Pathol 28:264–273. https://doi.org/10.1111/bpa.12505 · DOI
- Spires-Jones TL, Attems J, Thal DR (2017) Interactions of pathological proteins in neurodegenerative diseases. Acta Neuropathology 134:187–205. https://doi.org/10.1007/s00401-017-1709-7 · DOI
- Stringer C, Pachitariu M (2025) Cellpose3: one-click image restoration for improved cellular segmentation. Nat Methods 22:592–599. https://doi.org/10.1038/s41592-025-02595-5 · DOI
- Takeda S, Wegmann S, Cho H, DeVos SL, Commins C, Roe AD, Nicholls SB, Carlson GA, Pitstick R, Nobuhara CK, Costantino I, Frosch MP, Müller DJ, Irimia D, Hyman BT (2015) Neuronal uptake and propagation of a rare phosphorylated high-molecular-weight tau derived from Alzheimer’s disease brain. Nat Commun 6:8490. https://doi.org/10.1038/ncomms9490 · DOI · Paper page
- Thomas DX, Bajaj S, McRae-McKee K, Hadjichrysanthou C, Anderson RM, Collinge J (2020) Association of TDP-43 proteinopathy, cerebral amyloid angiopathy, and Lewy bodies with cognitive impairment in individuals with or without Alzheimer’s disease neuropathology. Sci Rep 10:14579. https://doi.org/10.1038/s41598-020-71305-2 · DOI
- Tinevez J-Y, Perry N, Schindelin J, Hoopes GM, Reynolds GD, Laplantine E, Bednarek SY, Shorte SL, Eliceiri KW (2017) TrackMate: an open and extensible platform for single-particle tracking. Methods 115:80–90. https://doi.org/10.1016/j.ymeth.2016.09.016 · DOI
- Tomé SO, Gomes LA, Li X, Vandenberghe R, Tousseyn T, Thal DR (2021) TDP-43 interacts with pathological τ protein in Alzheimer’s disease. Acta Neuropathol. https://doi.org/10.1007/s00401-021-02295-2 · DOI
- Tomé SO, Tsaka G, Ronisz A, Ospitalieri S, Gawor K, Gomes LA, Otto M, Von Arnim CAF, Van Damme P, Van Den Bosch L, Ghebremedhin E, Laureyssen C, Sleegers K, Vandenberghe R, Rousseau F, Schymkowitz J, Thal DR (2023) TDP-43 pathology is associated with increased tau burdens and seeding. Mol Neurodegener 18:71. https://doi.org/10.1186/s13024-023-00653-0 · DOI
- Tomé SO, Vandenberghe R, Ospitalieri S, Van Schoor E, Tousseyn T, Otto M, von Arnim CAF, Thal DR (2020) Distinct molecular patterns of TDP-43 pathology in Alzheimer’s disease: relationship with clinical phenotypes. Acta Neuropathol Commun 8:61. https://doi.org/10.1186/s40478-020-00934-5 · DOI
- Tremblay C, St-Amour I, Schneider J, Bennett DA, Calon F (2011) Accumulation of TAR DNA binding protein-43 (TDP-43) in mild cognitive impairment and Alzheimer disease. J Neuropathol Exp Neurol 70:788–798. https://doi.org/10.1097/NEN.0b013e31822c62cf · DOI
- Tziortzouda P, Van Den Bosch L, Hirth F (2021) Triad of TDP43 control in neurodegeneration: autoregulation, localization and aggregation. Nat Rev Neurosci 22:197–208. https://doi.org/10.1038/s41583-021-00431-1 · DOI
- Uemura N, Uemura MT, Luk KC, Lee VM-Y, Trojanowski JQ (2020) Cell-to-cell transmission of tau and α-synuclein. Trends Mol Med 26:936–952. https://doi.org/10.1016/j.molmed.2020.03.012 · DOI · Paper page
- Ukmar-Godec T, Hutten S, Grieshop MP, Rezaei-Ghaleh N, Cima-Omori MS, Biernat J, Mandelkow E, Söding J, Dormann D, Zweckstetter M (2019) Lysine/RNA-interactions drive and regulate biomolecular condensation. Nat Commun 10:2909. https://doi.org/10.1038/s41467-019-10792-y · DOI · Paper page
- Vanderweyde T, Yu H, Varnum M, Liu-Yesucevitz L, Citro A, Ikezu T, Duff K, Wolozin B (2012) Contrasting pathology of the stress granule proteins TIA-1 and G3BP in tauopathies. J 32:8270–8283. https://doi.org/10.1523/JNEUROSCI.1592-12.2012 · DOI
- Wang A, Conicella AE, Schmidt HB, Martin EW, Rhoads SN, Reeb AN, Nourse A, Ramirez Montero D, Ryan VH, Rohatgi R, Shewmaker F, Naik MT, Mittag T, Ayala YM, Fawzi NL (2018) A single N-terminal phosphomimic disrupts TDP-43 polymerization, phase separation, and RNA splicing. EMBO J 37:e97452. https://doi.org/10.15252/embj.201797452 · DOI
- Wegmann S, Eftekharzadeh B, Tepper K, Zoltowska KM, Bennett RE, Dujardin S, Laskowski PR, MacKenzie D, Kamath T, Commins C, Vanderburg C, Roe AD, Fan Z, Molliex AM, Hernandez-Vega A, Muller D, Hyman AA, Mandelkow E, Taylor JP, Hyman BT (2018) Tau protein liquid-liquid phase separation can initiate tau aggregation. EMBO J 37:e98049. https://doi.org/10.15252/embj.201798049 · DOI · Paper page
- Wille H, Drewes G, Biernat J, Mandelkow EM, Mandelkow E (1992) Alzheimer-like paired helical filaments and antiparallel dimers formed from microtubule-associated protein tau in vitro. J Cell Biol 118:573–584. https://doi.org/10.1083/jcb.118.3.573 · DOI · Paper page
- Wolozin B, Ivanov P (2019) Stress granules and neurodegeneration. Nat Rev Neurosci 20:649–666. https://doi.org/10.1038/s41583-019-0222-5 · DOI · Paper page
- Yan X, Kuster D, Mohanty P, Nijssen J, Pombo-García K, Garcia Morato J, Rizuan A, Franzmann TM, Sergeeva A, Ly AM, Liu F, Passos PM, George L, Wang S-H, Shenoy J, Danielson HL, Ozguney B, Honigmann A, Ayala YM, Fawzi NL, Dickson DW, Rossoll W, Mittal J, Alberti S, Hyman AA (2025) Intra-condensate demixing of TDP-43 inside stress granules generates pathological aggregates. Cell. https://doi.org/10.1016/j.cell.2025.04.039 · DOI
- Yılmaz Ş, Busch F, Nagaraj N, Cox J (2022) Accurate and automated high-coverage identification of chemically cross-linked peptides with MaxLynx. Anal Chem 94:1608–1617. https://doi.org/10.1021/acs.analchem.1c03688 · DOI
- Zhang X, Lin Y, Eschmann NA, Zhou H, Rauch JN, Hernandez I, Guzman E, Kosik KS, Han S (2017) RNA stores tau reversibly in complex coacervates. PLoS Biol 15:e2002183. https://doi.org/10.1371/journal.pbio.2002183 · DOI · Paper page
- Zhang X, Vigers M, McCarty J, Rauch JN, Fredrickson GH, Wilson MZ, Shea J-E, Han S, Kosik KS (2020) The proline-rich domain promotes Tau liquid-liquid phase separation in cells. J Cell Biol 219:e202006054. https://doi.org/10.1083/jcb.202006054 · DOI · Paper page
Cited by
Thiou, S., Martin, L., Manousaki, E., Nguyen, M., Mortelecque, J., Heidsieck, L., Cantrelle, F.-X., Blum, D., Buée-Scherrer, V., Buée, L., et al. (2026) · ACS Chemical Neuroscience · doi:10.1021/acschemneuro.6c00110 · Cited by 1
Metadata
- Authors
- Simonetti, F., Zhong, W., Hutten, S., Uliana, F., Schifferer, M., Rezaei, A., Ramirez, L. M., Hochmair, J., Sankar, R., Gopalan, A., Kielisch, F., Riemenschneider, H., Ruf, V., Schmidt, C., Simons, M., Zweckstetter, M., Wegmann, S., Lashley, T., Polymenidou, M., Edbauer, D., & Dormann, D.
- Venue
- The EMBO Journal
- Published
- 2025-10-17
- Volume
- 44
- Issue
- 24
- ISSN
- 0261-4189
- 1460-2075
- PMC
- PMC12706024
- Cited by
- 23
- References
- 19
- Language
- en
- Funders
- Alzheimers Research Award by the Hans and Isle Breuer Foundation
- Deutsche Forschungsgemeinschaft (442698351, 390857198, 408885537, 497669232, INST 247/912-1FUGG)
- Swiss National Science Foundation (310030_192650)
- Marie Curie Individual Fellowship (101207537)
- SPP2191 (419138680, 419139133)
- SFB1551 (464588647)
- Ministry of Science and Health of Rhineland-Palatinate and the European Regional Development Fund (84012490)
- Association for Frontotemporal Dementia
- Bundesministerium für Bildung und Forschung (03Z22HN22)
About these checks
Registry, retraction, Cites and statistics results are computed, not judged, with one exception: a printed reference that no index lists is read once by a model before it counts as a citation error. Claims are extracted by a model and kept only when their quote appears verbatim in the text; each cited source is then checked, with a model’s help, for whether it says what the claim relies on. Those verdicts can be wrong — read the claim’s quote and the cited source before relying on one.
Statistics and arithmetic are recomputed, not judged.
Confidence bands are shown only for fields calibrated on our annotated test set. None is calibrated yet, so no band is shown.
What counts as a claim ›How we measure confidence ›How we check this ›
Are you an author, or do you see a problem with this page? Request a review
Data sources
Bibliographic data: Semantic Scholar, OpenAlex, Crossref.
Contains information from the Semantic Scholar Academic Graph Datasets, made available under the ODC Attribution License (ODC-BY 1.0).
Semantic Scholar’s data is described in: Kinney, R., et al. (2023). The Semantic Scholar Open Data Platform. arXiv:2301.10140.
