

The DOI matches its Crossref record; 55 of the 55 references it cites were found in a registry or an index.
Ran-dependent TPX2 activation promotes acentrosomal microtubule nucleation in neurons
Abstract
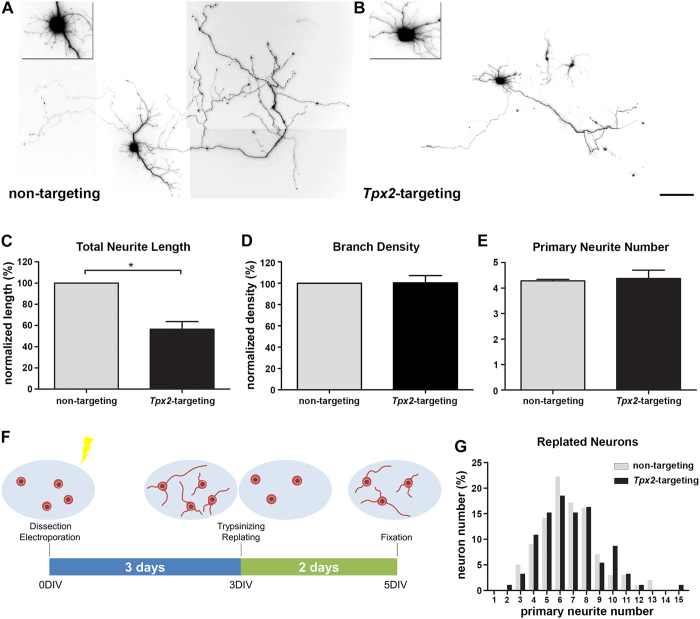
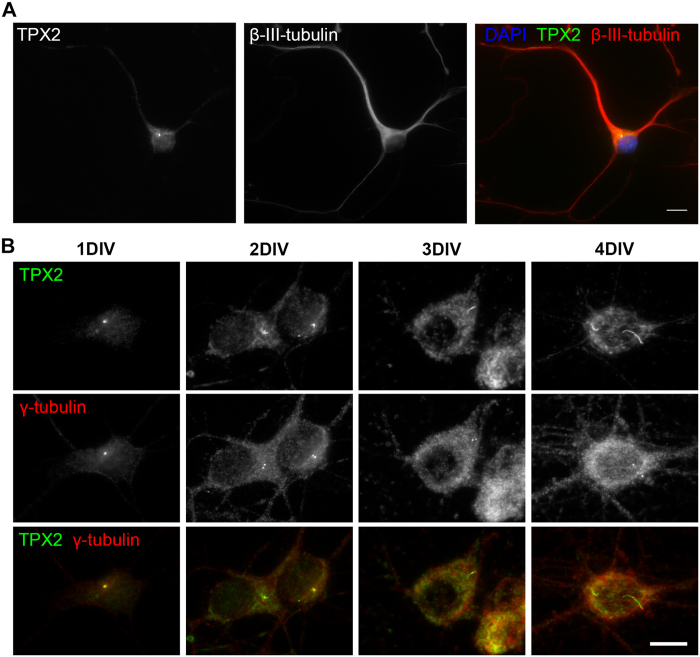
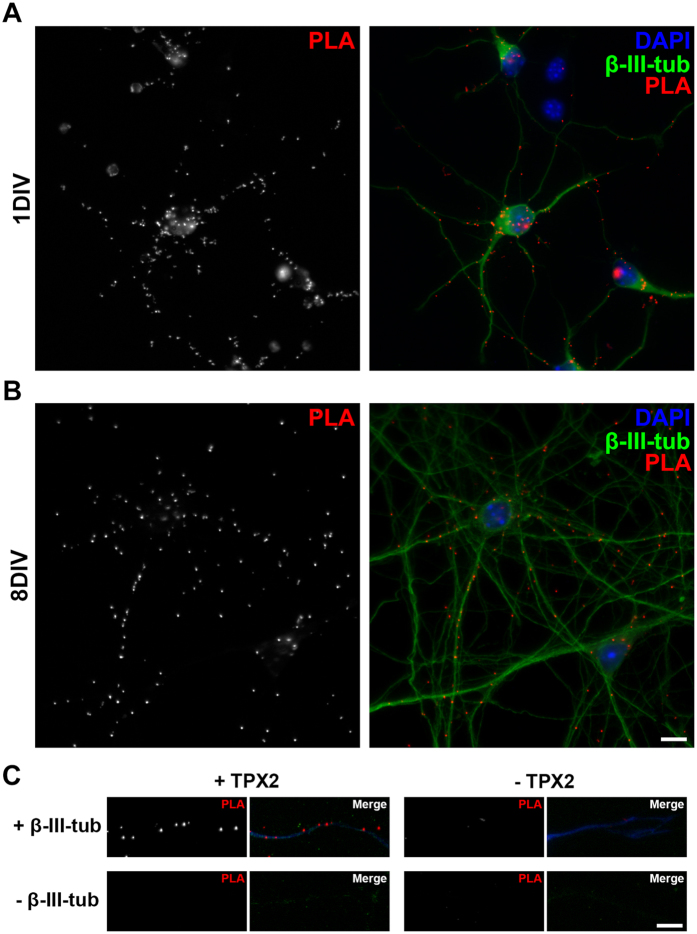
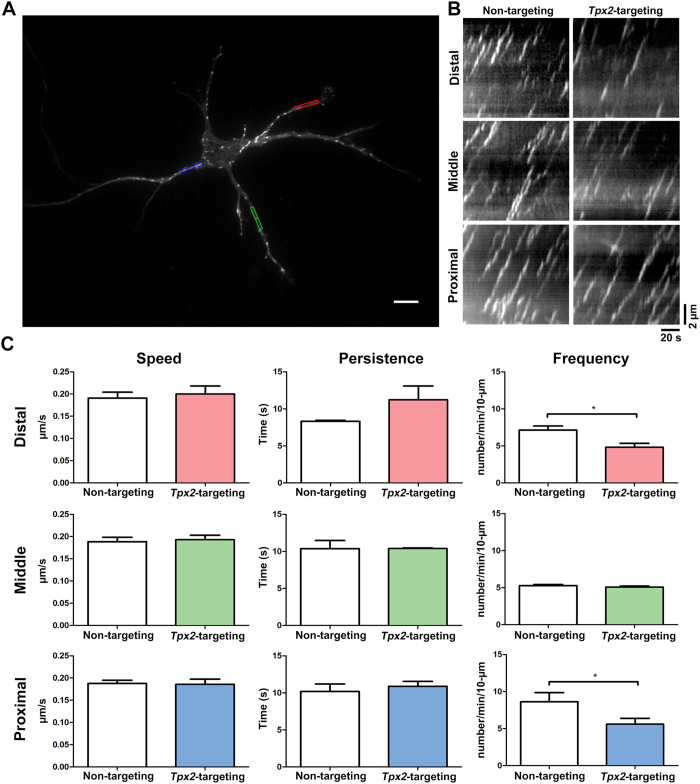
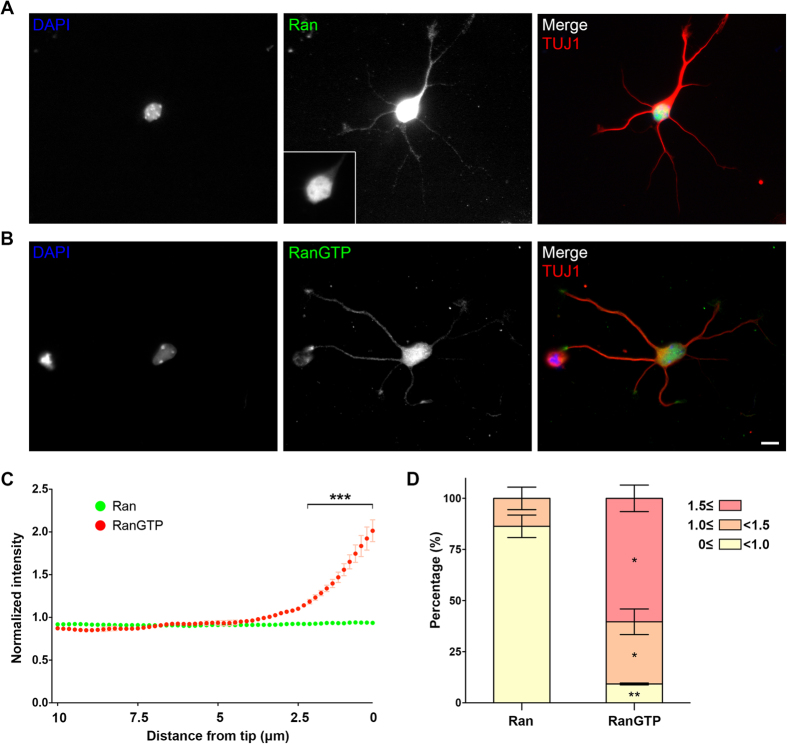
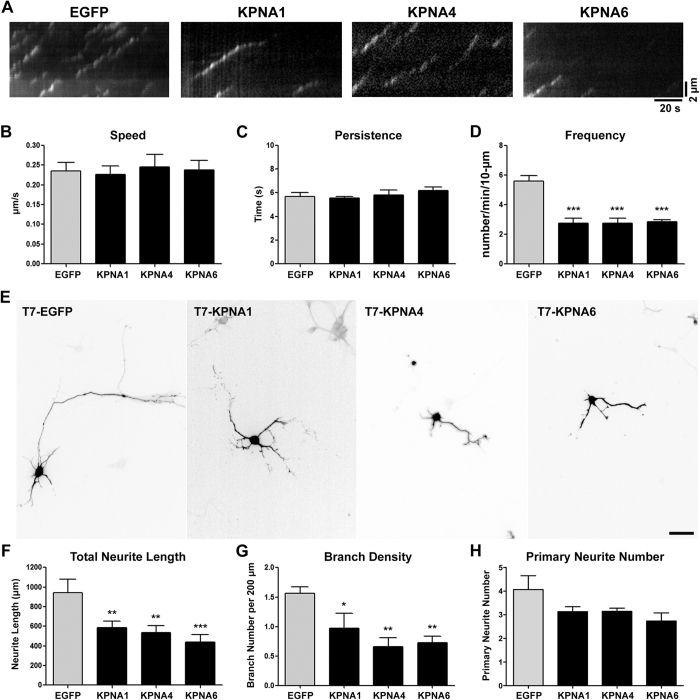
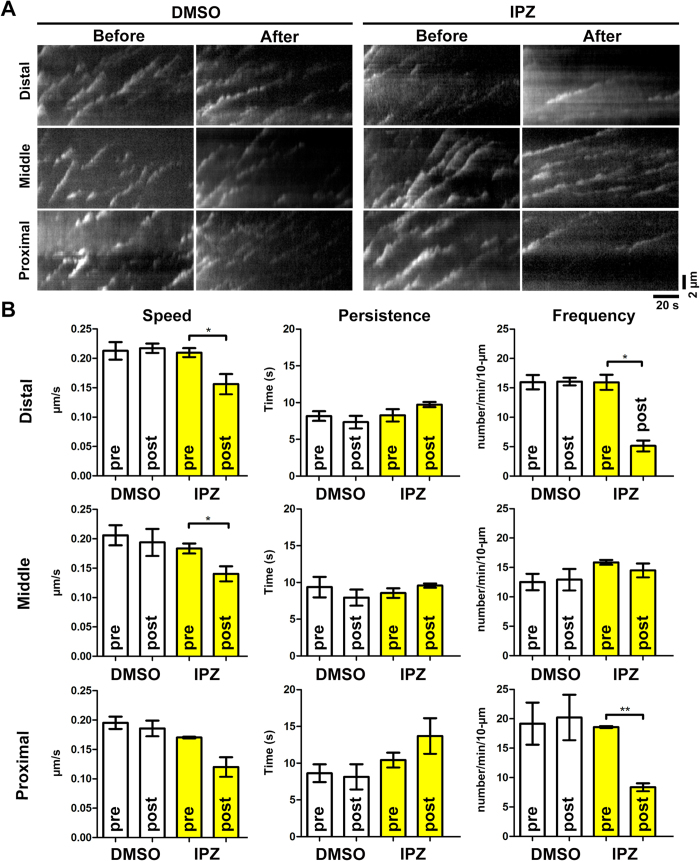
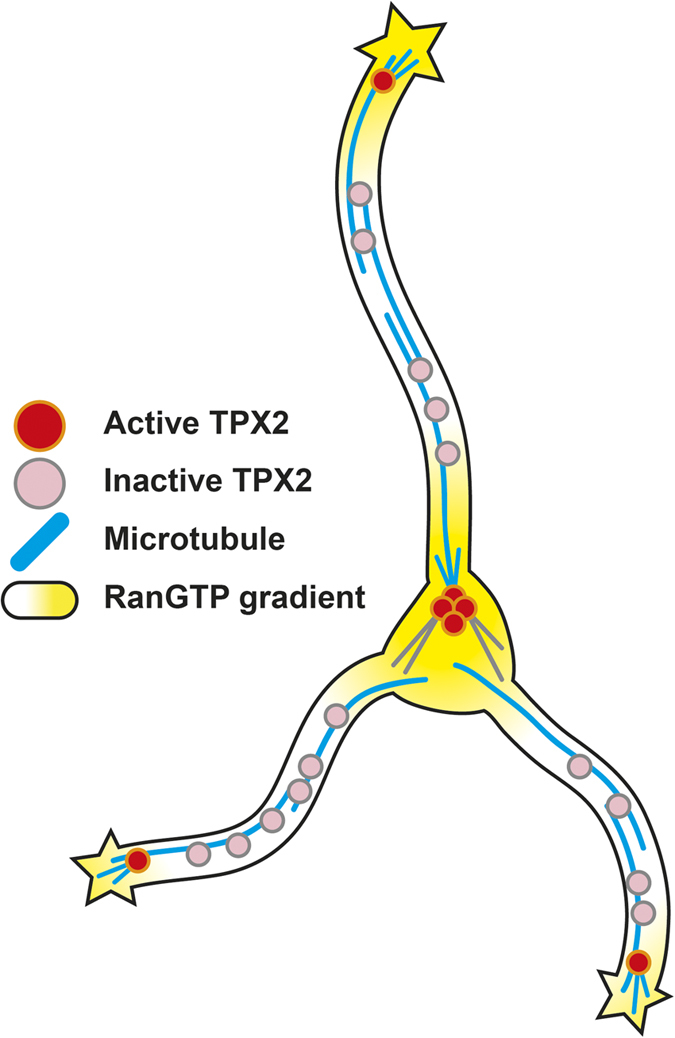
The microtubule (MT) cytoskeleton is essential for the formation of morphologically appropriate neurons. The existence of the acentrosomal MT organizing center in neurons has been proposed but its identity remained elusive. Here we provide evidence showing that TPX2 is an important component of this acentrosomal MT organizing center. First, neurite elongation is compromised in TPX2-depleted neurons. In addition, TPX2 localizes to the centrosome and along the neurite shaft bound to MTs. Depleting TPX2 decreases MT formation frequency specifically at the tip and the base of the neurite, and these correlate precisely with the regions where active GTP-bound Ran proteins are enriched. Furthermore, overexpressing the downstream effector of Ran, importin, compromises MT formation and neuronal morphogenesis. Finally, applying a Ran-importin signaling interfering compound phenocopies the effect of TPX2 depletion on MT dynamics. Together, these data suggest a model in which Ran-dependent TPX2 activation promotes acentrosomal MT nucleation in neurons.
Overview
The claims and statistics of this paper haven’t been checked yet.
Run the check — free, no account needed. It reads the open-access text and checks the sources it cites.
Integrity signals
Registry
Cites
Statistics
Figures
Verification
Claims the paper makes
The claims and statistics of this paper haven’t been checked yet.
Run the check — free, no account needed. It reads the open-access text and checks the sources it cites.
Claims other papers make about this one
Each is checked against this paper’s own text: does it say what the citing paper says it does?
In the citing paper
“whose depletion reduced neurite length by interfering with microtubules [67].”
From Neurodegenerative disease-associated microRNAs acting as signaling molecules modulate CNS neuron structure and viability (2025) · cites this paper as [67]
Self-check
Percentages, sums and reported differences re-computed from the paper’s own numbers.
The self-check needs the paper’s full text.
Citations
Cites
Direct observation of individual endogenous protein complexes in situ by proximity ligation
Söderberg, O., Gullberg, M., Jarvius, M., Ridderstråle, K., Leuchowius, K.-J., Jarvius, J., Wester, K., Hydbring, P., Bahram, F., Larsson, L.-G., et al. (2006) · Nature Methods · doi:10.1038/nmeth947 · Cited by 2,419
Kaech, S., & Banker, G. A. (2006) · Nature Protocols · doi:10.1038/nprot.2006.356 · Cited by 1,787
Design and validation of a tool for neurite tracing and analysis in fluorescence microscopy images
Meijering, E., Jacob, M., Sarria, J. ‐. F., Steiner, P., Hirling, H., & Unser, M. (2004) · Cytometry Part A · doi:10.1002/cyto.a.20022 · Cited by 1,608
Culturing hippocampal neurons.
Tanaka, H. (2002) · Folia Pharmacologica Japonica · doi:10.1254/fpj.119.163 · Cited by 1,142
Microtubule assembly, organization and dynamics in axons and dendrites
Conde, C., & Cáceres, A. (2009) · Nature Reviews Neuroscience · doi:10.1038/nrn2631 · Cited by 1,086
A genetically encoded photoactivatable Rac controls the motility of living cells
Wu, Y. I., Frey, D., Lungu, O. I., Jaehrig, A., Schlichting, I., Kuhlman, B., & Hahn, K. M. (2009) · Nature · doi:10.1038/nature08241 · Cited by 1,083
Conserved microtubule–actin interactions in cell movement and morphogenesis
Rodriguez, O. C., Schaefer, A. W., Mandato, C. A., Forscher, P., Bement, W. M., & Waterman-Storer, C. M. (2003) · Nature Cell Biology · doi:10.1038/ncb0703-599 · Cited by 844
Stepanova, T., Slemmer, J., Hoogenraad, C. C., Lansbergen, G., Dortland, B., De Zeeuw, C. I., Grosveld, F., van Cappellen, G., Akhmanova, A., & Galjart, N. (2003) · The Journal of Neuroscience · doi:10.1523/jneurosci.23-07-02655.2003 · Cited by 698
Ran Induces Spindle Assembly by Reversing the Inhibitory Effect of Importin α on TPX2 Activity
Gruss, O. J., Carazo-Salas, R. E., Schatz, C. A., Guarguaglini, G., Kast, J., Wilm, M., Le Bot, N., Vernos, I., Karsenti, E., & Mattaj, I. W. (2001) · Cell · doi:10.1016/s0092-8674(01)00193-3 · Cited by 593
Generation of GTP-bound Ran by RCC1 is required for chromatin-induced mitotic spindle formation
Salas, R. E. C., Guarguaglini, G., Gruß, O. J., Segref, A., Karsenti, E., & Mattaj, I. W. (1999) · Nature · doi:10.1038/22133 · Cited by 491
Breaking the neuronal sphere: regulation of the actin cytoskeleton in neuritogenesis
Silva, J. S. D., & Dotti, C. G. (2002) · Nature reviews. Neuroscience · doi:10.1038/nrn918 · Cited by 487
Axoplasmic Importins Enable Retrograde Injury Signaling in Lesioned Nerve
Hanz, S., Perlson, E., Willis, D. E., Zheng, J.-Q., Massarwa, R., Huerta, J. J., Koltzenburg, M., Köhler, M., van Minnen, J., Twiss, J. L., et al. (2003) · Neuron · doi:10.1016/s0896-6273(03)00770-0 · Cited by 487
Spatial and temporal coordination of mitosis by Ran GTPase
Clarke, P. R., & Zhang, C. (2008) · Nature Reviews Molecular Cell Biology · doi:10.1038/nrm2410 · Cited by 446
Stimulation of Microtubule Aster Formation and Spindle Assembly by the Small GTPase Ran
Wilde, A., & Zheng, Y. (1999) · Science · doi:10.1126/science.284.5418.1359 · Cited by 395
Tpx2, a Novel Xenopus Map Involved in Spindle Pole Organization
Wittmann, T., Wilm, M., Karsenti, E., & Vernos, I. (2000) · The Journal of Cell Biology · doi:10.1083/jcb.149.7.1405 · Cited by 377
Importin β Is a Mitotic Target of the Small GTPase Ran in Spindle Assembly
Nachury, M. V., Maresca, T. J., Salmon, W. C., Waterman-Storer, C. M., Heald, R., & Weis, K. (2001) · Cell · doi:10.1016/s0092-8674(01)00194-5 · Cited by 376
Branching Microtubule Nucleation in Xenopus Egg Extracts Mediated by Augmin and TPX2
Petry, S., Groen, A. C., Ishihara, K., Mitchison, T. J., & Vale, R. D. (2013) · Cell · doi:10.1016/j.cell.2012.12.044 · Cited by 375
Bellion, A. (2005) · Journal of Neuroscience · doi:10.1523/jneurosci.1030-05.2005 · Cited by 354
The Ran GTPase regulates mitotic spindle assembly
Kaláb, P., Pu, R. T., & Dasso, M. (1999) · Current Biology · doi:10.1016/s0960-9822(99)80213-9 · Cited by 353
Gruss, O. J., Wittmann, M., Yokoyama, H., Pepperkok, R., Kufer, T., Silljé, H., Karsenti, E., Mattaj, I. W., & Vernos, I. (2002) · Nature Cell Biology · doi:10.1038/ncb870 · Cited by 330
Interaction of the Nuclear GTP-Binding Protein Ran with Its Regulatory Proteins RCC1 and RanGAP1
Klebe, C., Bischoff, F. R., Ponstingl, H., & Wittinghofer, A. (1995) · Biochemistry · doi:10.1021/bi00002a031 · Cited by 324
Role of Importin-β in Coupling Ran to Downstream Targets in Microtubule Assembly
Wiese, C., Wilde, A., Moore, M. S., Adam, S. A., Merdes, A., & Zheng, Y. (2001) · Science · doi:10.1126/science.1057661 · Cited by 323
Ori-McKenney, K. M., Jan, L. Y., & Jan, Y.-N. (2012) · Neuron · doi:10.1016/j.neuron.2012.10.008 · Cited by 323
Vetter, I. R., Nowak, C., Nishimoto, T., Kuhlmann, J., & Wittinghofer, A. (1999) · Nature · doi:10.1038/17969 · Cited by 314
Branch management: mechanisms of axon branching in the developing vertebrate CNS
Kalil, K., & Dent, E. W. (2013) · Nature reviews. Neuroscience · doi:10.1038/nrn3650 · Cited by 314
Self-Organization of Microtubule Asters Induced in Xenopus Egg Extracts by GTP-Bound Ran
Ohba, T., Nakamura, M., Nishitani, H., & Nishimoto, T. (1999) · Science · doi:10.1126/science.284.5418.1356 · Cited by 302
Axon Extension Occurs Independently of Centrosomal Microtubule Nucleation
Stieß, M., Maghelli, N., Kapitein, L. C., Gomis-Rüth, S., Wilsch‐Bräuninger, M., Hoogenraad, C. C., Tolić, I. M., & Bradke, F. (2010) · Science · doi:10.1126/science.1182179 · Cited by 299
Importazole, a Small Molecule Inhibitor of the Transport Receptor Importin-β
Soderholm, J. F., Bird, S. L., Kalab, P., Sampathkumar, Y., Hasegawa, K., Uehara-Bingen, M., Weis, K., & Heald, R. (2011) · ACS Chemical Biology · doi:10.1021/cb2000296 · Cited by 274
Actin and microtubules in neurite initiation: Are MAPs the missing link?
Dehmelt, L., & Halpain, S. (2003) · Journal of Neurobiology · doi:10.1002/neu.10284 · Cited by 256
Localized Regulation of Axonal RanGTPase Controls Retrograde Injury Signaling in Peripheral Nerve
Yudin, D., Hanz, S., Yoo, S., Iavnilovitch, E., Willis, D. E., Gradus, T., Vuppalanchi, D., Segal-Ruder, Y., Ben‐Yaakov, K., Hieda, M., et al. (2008) · Neuron · doi:10.1016/j.neuron.2008.05.029 · Cited by 219
Crystal structure of the nuclear Ras-related protein Ran in its GDP-bound form
Scheffzek, K., Klebe, C., Fritz‐Wolf, K., Kabsch, W., & Wittinghofer, A. (1995) · Nature · doi:10.1038/374378a0 · Cited by 199
Sánchez-Huertas, C., Freixo, F., Viais, R., Lacasa, C., Soriano, E., & Lüders, J. (2016) · Nature Communications · doi:10.1038/ncomms12187 · Cited by 198
Importin α‐regulated nucleation of microtubules by TPX2
Schatz, C., Santarella, R. A., Hoenger, A., Karsenti, E., Mattaj, I. W., Gruß, O. J., & Salas, R. E. C. (2003) · The EMBO Journal · doi:10.1093/emboj/cdg195 · Cited by 195
Neuronal polarization: The cytoskeleton leads the way
Stieß, M., & Bradke, F. (2010) · Developmental Neurobiology · doi:10.1002/dneu.20849 · Cited by 175
Kosodo, Y., Suetsugu, T., Suda, M., Mimori‐Kiyosue, Y., Toida, K., Baba, S. A., Kimura, A., & Matsuzaki, F. (2011) · The EMBO Journal · doi:10.1038/emboj.2011.81 · Cited by 170
Poulain, F. E., & Sobel, A. (2009) · Molecular and Cellular Neuroscience · doi:10.1016/j.mcn.2009.07.012 · Cited by 162
Ho, S., Chao, C.-Y., Huang, H.-L., Chiu, T.-W., Charoenkwan, P., & Hwang, E. (2011) · BMC Bioinformatics · doi:10.1186/1471-2105-12-230 · Cited by 159
Self-citationBaas, P. W., Karabay, A., & Qiang, L. (2005) · Trends in Cell Biology · doi:10.1016/j.tcb.2005.08.004 · Cited by 156
Ran-GTP stabilises microtubule asters and inhibits nuclear assembly in Xenopus egg extracts
Zhang, C., Hughes, M., & Clarke, P. R. (1999) · Journal of Cell Science · doi:10.1242/jcs.112.14.2453 · Cited by 144
Karyopherin α7 (KPNA7), a divergent member of the importin α family of nuclear import receptors
Kelley, J. B., Talley, A. M., Spencer, A., Gioeli, D. G., & Paschal, B. M. (2010) · BMC Cell Biology · doi:10.1186/1471-2121-11-63 · Cited by 141
Mori, D., Yamada, M., Mimori‐Kiyosue, Y., Shirai, Y., Suzuki, A., Ohno, S., Saya, H., Wynshaw-Boris, A. J., & Hirotsune, S. (2009) · Nature Cell Biology · doi:10.1038/ncb1919 · Cited by 130
Brunet, S., Sardón, T., Zimmerman, T., Wittmann, T., Pepperkok, R., Karsenti, E., & Vernos, I. (2004) · Molecular Biology of the Cell · doi:10.1091/mbc.e04-05-0385 · Cited by 130
Richards, S. A., Lounsbury, K. M., & Macara, I. G. (1995) · Journal of Biological Chemistry · doi:10.1074/jbc.270.24.14405 · Cited by 129
Groen, A. C., Cameron, L., Coughlin, M. L., Miyamoto, D. T., Mitchison, T. J., & Ohi, R. (2004) · Current Biology · doi:10.1016/j.cub.2004.10.002 · Cited by 113
GM130 Regulates Golgi-Derived Spindle Assembly by Activating TPX2 and Capturing Microtubules
Wei, J., Zhang, Z. C., Wynn, R., & Seemann, J. (2015) · Cell · doi:10.1016/j.cell.2015.06.014 · Cited by 108
Identification of Neural Outgrowth Genes using Genome-Wide RNAi
Sepp, K. J., Hong, P., Lizarraga, S. B., Liu, J. S.-H., Mejia, L. A., Walsh, C. A., & Perrimon, N. (2008) · PLoS Genetics · doi:10.1371/journal.pgen.1000111 · Cited by 106
Cheng, L., Lemmon, S. K., & Lemmon, V. (2005) · Journal of Neurochemistry · doi:10.1111/j.1471-4159.2005.03254.x · Cited by 90
Ran on tracks – cytoplasmic roles for a nuclear regulator
Yudin, D., & Fainzilber, M. (2009) · Journal of Cell Science · doi:10.1242/jcs.015289 · Cited by 89
Ciciarello, M., Mangiacasale, R., Thibier, C., Guarguaglini, G., Marchetti, E., Fiore, B. D., & Lavia, P. (2004) · Journal of Cell Science · doi:10.1242/jcs.01569 · Cited by 86
RanBPM Contributes to Semaphorin3A Signaling through Plexin-A Receptors
Togashi, H., Schmidt, E. F., & Strittmatter, S. M. (2006) · Journal of Neuroscience · doi:10.1523/jneurosci.0704-06.2006 · Cited by 76
Tedeschi, A., Ciciarello, M., Mangiacasale, R., Roscioli, E., Rensen, W. M., & Lavia, P. (2007) · Journal of Cell Science · doi:10.1242/jcs.009308 · Cited by 60
Schulze, H., Dose, M., Korpal, M., Meyer, I., Italiano, J. E., & Shivdasani, R. A. (2008) · Journal of Biological Chemistry · doi:10.1074/jbc.m709397200 · Cited by 57
Pivotal role of RanBP9 in integrin‐dependent focal adhesion signaling and assembly
Woo, J. A., Roh, S., Lakshmana, M. K., & Kang, D. E. (2012) · The FASEB Journal · doi:10.1096/fj.11-194423 · Cited by 45
Hosokawa, K., Nishi, M., Sakamoto, H., Tanaka, Y., & Kawata, M. (2008) · Neuroscience · doi:10.1016/j.neuroscience.2008.09.045 · Cited by 31
TPX 2 regulates neuronal morphology through kinesin‐5 interaction
Kahn, O. I., Ha, N. T., Baird, M. A., Davidson, M. W., & Baas, P. W. (2015) · Cytoskeleton · doi:10.1002/cm.21234 · Cited by 22
Cited by
Local Nucleation of Microtubule Bundles through Tubulin Concentration into a Condensed Tau Phase
Hernández-Vega, A., Braun, M., Scharrel, L., Jahnel, M., Wegmann, S., Hyman, B. T., Alberti, S., Diez, S., & Hyman, A. A. (2017) · Cell Reports · doi:10.1016/j.celrep.2017.08.042 · Cited by 395
“Although there is considerable knowledge about how neurons use microtubule bundles for microtubule-based transport, we have less knowledge of how microtubule bundles form in the first place (Baas et al., 2005; Chen et al., 2017; Sanchez and Feldman, 2016; Tanaka and Kirschner, 1991).”
BackgroundKumbol, V., Ivanov, A., McGurran, H., Schüler, J., Zhai, Y., Ludwik, K., Hinkelmann, L., Brehm, M., Krüger, C., Küchler, J., et al. (2025) · Cell Communication and Signaling · doi:10.1186/s12964-025-02199-8 · Cited by 8
Fard, A. T., Leeson, H., Perez, J. A., Pietrogrande, G., Power, D., Inclan, C. L. G., Zheng, H., Nelson, C., Soheilmoghaddam, F., Glass, N., et al. (2022) · doi:10.1101/2022.01.24.476823 · Cited by 3
Metadata
- Authors
- Chen, W.-S., Chen, Y.-J., Huang, Y.-A., Hsieh, B.-Y., Chiu, H.-C., Kao, P.-Y., Chao, C.-Y., & Hwang, E.
- Venue
- Scientific Reports
- Published
- 2017-02-13
- Volume
- 7
- Issue
- 1
- ISSN
- 2045-2322
- PMC
- PMC5304320
- Cited by
- 41
- References
- 55
- Language
- en
- Licence
- creativecommons.org/licenses/by/4.0 (tdm)
- creativecommons.org/licenses/by/4.0 (vor)
About these checks
Registry, retraction, Cites and statistics results are computed, not judged, with one exception: a printed reference that no index lists is read once by a model before it counts as a citation error. Claims are extracted by a model and kept only when their quote appears verbatim in the text; each cited source is then checked, with a model’s help, for whether it says what the claim relies on. Those verdicts can be wrong — read the claim’s quote and the cited source before relying on one.
Statistics and arithmetic are recomputed, not judged.
Confidence bands are shown only for fields calibrated on our annotated test set. None is calibrated yet, so no band is shown.
What counts as a claim ›How we measure confidence ›How we check this ›
Are you an author, or do you see a problem with this page? Request a review
Data sources
Bibliographic data: Semantic Scholar, OpenAlex, Crossref.
Contains information from the Semantic Scholar Academic Graph Datasets, made available under the ODC Attribution License (ODC-BY 1.0).
Semantic Scholar’s data is described in: Kinney, R., et al. (2023). The Semantic Scholar Open Data Platform. arXiv:2301.10140.
