

The DOI matches its Crossref record; 1 of the 1 references it cites were found in a registry or an index.
Resting-state glutamate level in the anterior cingulate predicts blood-oxygen level-dependent response to cognitive control
Abstract
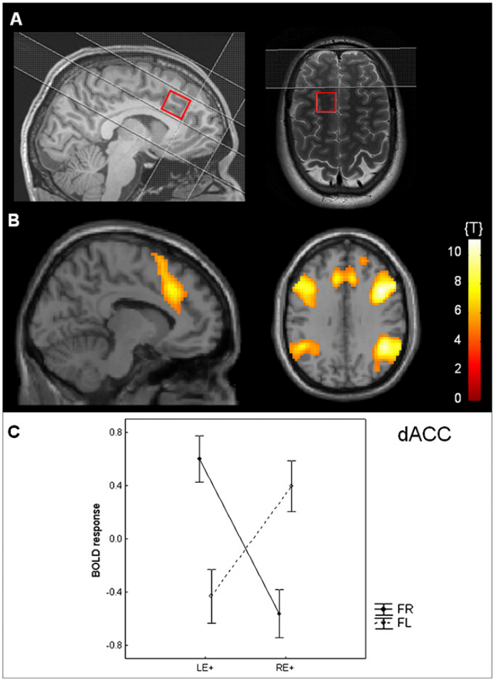
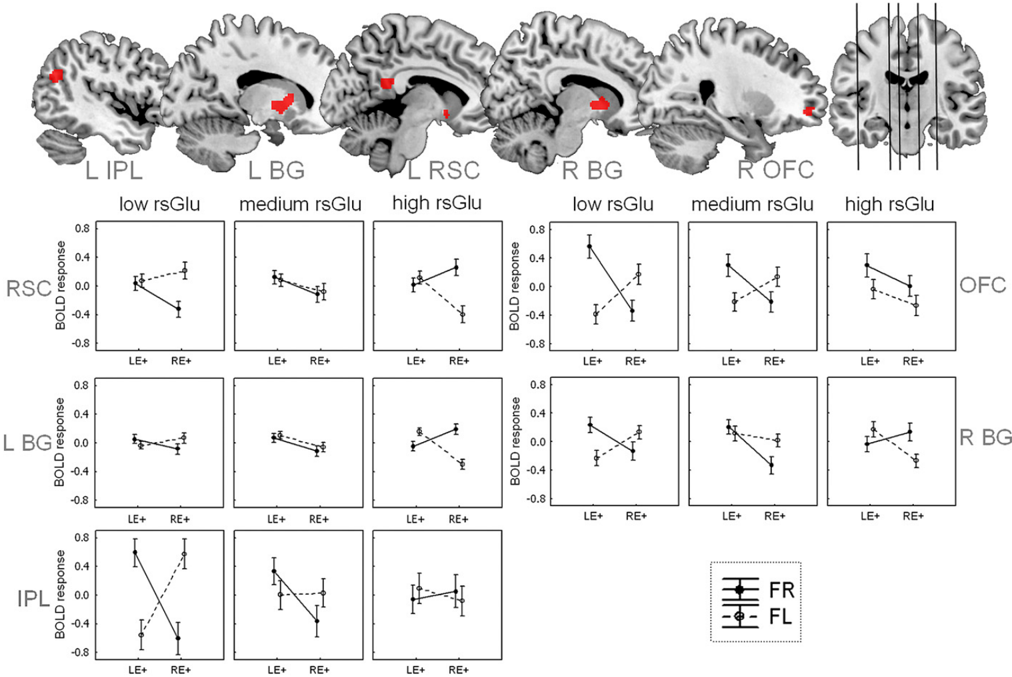
The dorsal anterior cingulate cortex (dACC) is a core structure for the governing of cognitive control, and recent studies have shown that interindividual differences in dACC anatomy are associated with corresponding differences in the ability for cognitive control. However, individuals differ not only in anatomical features of dACC, but also exhibit substantial variability regarding the biochemical characteristics of the dACC. In this study, we combined magnetic resonance spectroscopy ( 1 H-MRS) and functional magnetic resonance imaging (fMRI), finding that interindividual differences of glutamate levels in the dACC during resting-state predict the strength of the blood-oxygen level-dependent (BOLD) response to a task requiring cognitive control. This relationship was observed in the retrosplenial cortex, the orbitofrontal cortex, the inferior parietal lobe, and the basal ganglia. More specifically, individuals with low resting-state glutamate levels in the dACC showed an increased BOLD response when the task demands were high, whereas high-glutamate individuals showed the opposite pattern of an increased BOLD response when the task demands were low. Thus, we show here that individual variability of glutamate levels is directly related to how the brain implements cognitive control.
Overview
The claims and statistics of this paper haven’t been checked yet.
Run the check — free, no account needed. It reads the open-access text and checks the sources it cites.
Integrity signals
Registry
Cites
Statistics
Figures
Verification
Claims the paper makes
The claims and statistics of this paper haven’t been checked yet.
Run the check — free, no account needed. It reads the open-access text and checks the sources it cites.
Claims other papers make about this one
Each is checked against this paper’s own text: does it say what the citing paper says it does?
In the citing paper
“The relationship between glutamate concentration and BOLD signal is not well established.”
From Lisdexamfetamine Effects on Executive Activation and Neurochemistry in Menopausal Women with Executive Function Difficulties (2017) · cites this paper as Falkenberg et al, 2012
In the citing paper
“One study found a positive correlation between dorsal anterior cingulate cortex (ACC) glutamate and BOLD during a cognitive control task in several regions including the retrosplenial cortex, orbitofrontal cortex, inferior parietal lobule, and basal ganglia (Falkenberg et al, 2012).”
From Lisdexamfetamine Effects on Executive Activation and Neurochemistry in Menopausal Women with Executive Function Difficulties (2017) · cites this paper as Falkenberg et al, 2012
Self-check
Percentages, sums and reported differences re-computed from the paper’s own numbers.
The self-check needs the paper’s full text.
Citations
Cites
Attention and cognitive control networks assessed in a dichotic listening fMRI study
Falkenberg, L. E., Specht, K., & Westerhausen, R. (2011) · Brain and Cognition · doi:10.1016/j.bandc.2011.02.006 · Cited by 61
Self-citation
Research works printed but not linked: 37
- 10.1146/annurev.physiol.65.092101.142131 · DOI · Paper page
- 10.1038/sj.mp.4001551 · DOI
- 10.1093/cercor/bhp145 · DOI
- 10.1038/sj.mp.4001955 · DOI
- 10.1037/0033-295X.108.3.624 · DOI · Paper page
- 10.1038/nn.2321 · DOI · Paper page
- 10.1016/j.biopsych.2011.03.028 · DOI · Paper page
- 10.1093/acprof:oso/9780195104233.001.0001 · DOI · Paper page
- 10.1152/jn.90355.2008 · DOI · Paper page
- 10.1002/hbm.20667 · DOI
- 10.1016/j.neuropsychologia.2010.03.028 · DOI
- 10.1523/JNEUROSCI.1111-10.2010 · DOI
- 10.1146/annurev.neuro.30.051606.094334 · DOI
- 10.1038/nrn2201 · DOI · Paper page
- 10.1038/jcbfm.2009.197 · DOI
- 10.1038/sj.jcbfm.9600401 · DOI
- 10.1002/hbm.21179 · DOI
- 10.1073/pnas.0504136102 · DOI · Paper page
- 10.1038/nn2001 · DOI
- 10.1073/pnas.0900728106 · DOI
- 10.1002/hbm.21223 · DOI
- 10.1016/0028-3932(71)90067-4 · DOI · Paper page
- K Hugdahl The Asymmetrical Brain, eds K Hugdahl, RJ Davidson (MIT Press, Cambridge, MA), pp. 441–476 (2003).
- 10.1016/j.neuropsychologia.2005.05.006 · DOI
- P Sandmann, et al., Hemispheric asymmetries in the processing of temporal acoustic cues in consonant-vowel syllables. Restor Neurol Neurosci 25, 227–240 (2007).
- 10.1016/j.neulet.2007.11.046 · DOI
- 10.7551/mitpress/9780262014137.003.0350 · DOI
- 10.1016/S0010-9452(86)80005-3 · DOI
- 10.1006/nimg.1999.0498 · DOI
- 10.1016/j.neuroimage.2007.11.051 · DOI
- 10.1002/mrm.1910300604 · DOI
- 10.1016/j.neuroimage.2005.10.048 · DOI
- 10.1016/j.neuroimage.2006.10.023 · DOI
- 10.1016/j.neuroimage.2005.02.018 · DOI · Paper page
- J Cohen, P Cohen, SG West, LS Aiken Applied Multiple Regression/Correlation Analysis for the Behavioral Sciences (Lawrence Erlbaum Associates, Mahwah, NJ, 2003).
- M Brett, JJ Anton, R Valabregue, JP Poline, Region of interest analysis using an SPM toolbox. Neuroimage 16, 497 (2002).
- 10.1006/nimg.2001.0978 · DOI · Paper page
Cited by
Sorted by citations
Kapogiannis, D., Reiter, D. A., Willette, A. A., & Mattson, M. P. (2013) · NeuroImage · doi:10.1016/j.neuroimage.2012.09.029 · Cited by 211
Hu, Y., Chen, X., Gu, H., & Yang, Y. (2013) · The Journal of Neuroscience · doi:10.1523/jneurosci.1973-13.2013 · Cited by 167
Are hallucinations due to an imbalance between excitatory and inhibitory influences on the brain?
Jardri, R., Hugdahl, K., Hughes, M., Brunelin, J., Waters, F., Alderson-Day, B., Smailes, D., Sterzer, P., Corlett, P. R., Leptourgos, P., et al. (2016) · Schizophrenia Bulletin · doi:10.1093/schbul/sbw075 · Cited by 157
Self-citationGlutamate as a mediating transmitter for auditory hallucinations in schizophrenia: A 1H MRS study
Hugdahl, K., Craven, A. R., Nygård, M., Løberg, E.-M., Berle, J. Ø., Johnsen, E., Kroken, R., Specht, K., Andreassen, O. A., & Ersland, L. (2015) · Schizophrenia Research · doi:10.1016/j.schres.2014.11.015 · Cited by 64
Self-citationVidal-Piñeiro, D., Martín-Trias, P., Falcón, C., Bargalló, N., Clemente, I. C., Valls-Solé, J., Junqué, C., Pascual-Leone, A., & Bartrés-Faz, D. (2015) · Brain Stimulation · doi:10.1016/j.brs.2015.04.005 · Cited by 49
Metadata
- Authors
- Falkenberg, L. E., Westerhausen, R., Specht, K., & Hugdahl, K.
- Venue
- Proceedings of the National Academy of Sciences
- Publisher
- National Academy of Sciences
- Published
- 2012-03-12
- Volume
- 109
- Issue
- 13
- Pages
- 5069-5073
- ISSN
- 0027-8424
- 1091-6490
- Cited by
- 72
- References
- 1
- Language
- en
About these checks
Registry, retraction, Cites and statistics results are computed, not judged, with one exception: a printed reference that no index lists is read once by a model before it counts as a citation error. Claims are extracted by a model and kept only when their quote appears verbatim in the text; each cited source is then checked, with a model’s help, for whether it says what the claim relies on. Those verdicts can be wrong — read the claim’s quote and the cited source before relying on one.
Statistics and arithmetic are recomputed, not judged.
Confidence bands are shown only for fields calibrated on our annotated test set. None is calibrated yet, so no band is shown.
What counts as a claim ›How we measure confidence ›How we check this ›
Are you an author, or do you see a problem with this page? Request a review
