

The DOI matches its Crossref record; 35 of the 35 references it cites were found in a registry or an index.
Early childhood stress exposure, reward pathways, and adult decision making
Open accessAbstract
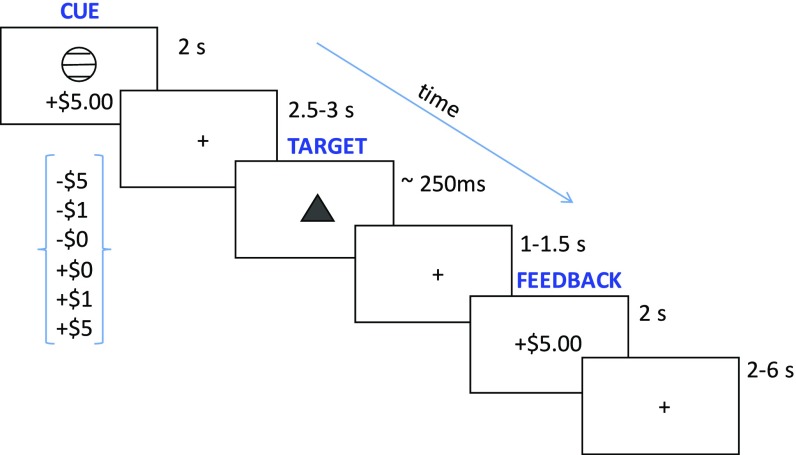
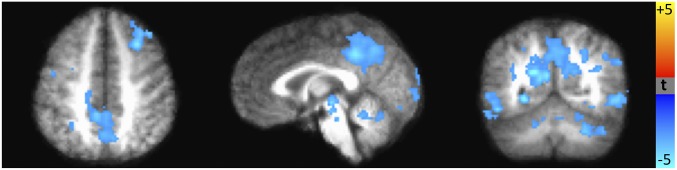
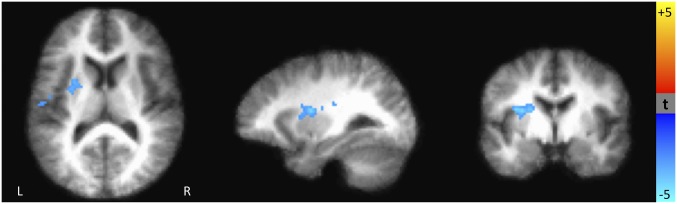
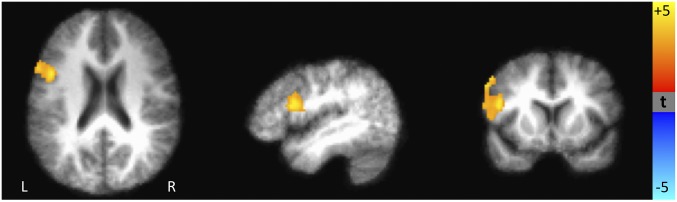
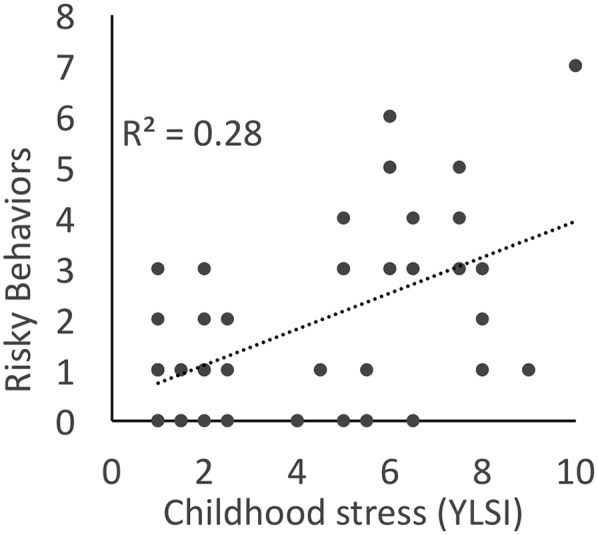
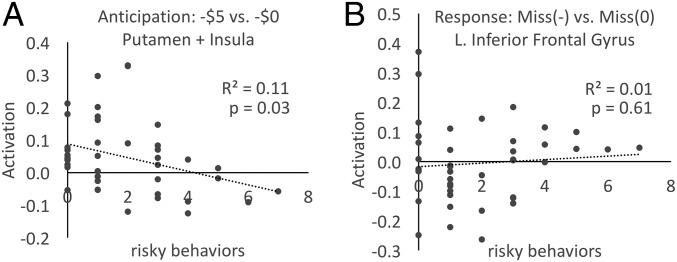
Individuals who have experienced chronic and high levels of stress during their childhoods are at increased risk for a wide range of behavioral problems, yet the neurobiological mechanisms underlying this association are poorly understood. We measured the life circumstances of a community sample of school-aged children and then followed these children for a decade. Those from the highest and lowest quintiles of childhood stress exposure were invited to return to our laboratory as young adults, at which time we reassessed their life circumstances, acquired fMRI data during a reward-processing task, and tested their judgment and decision making. Individuals who experienced high levels of early life stress showed lower levels of brain activation when processing cues signaling potential loss and increased responsivity when actually experiencing losses. Specifically, those with high childhood stress had reduced activation in the posterior cingulate/precuneus, middle temporal gyrus, and superior occipital cortex during the anticipation of potential rewards; reduced activation in putamen and insula during the anticipation of potential losses; and increased left inferior frontal gyrus activation when experiencing an actual loss. These patterns of brain activity were associated with both laboratory and real-world measures of individuals' risk taking in adulthood. Importantly, these effects were predicated only by childhood stress exposure and not by current levels of life stress.
Overview
The claims and statistics of this paper haven’t been checked yet.
Run the check — free, no account needed. It reads the open-access text and checks the sources it cites.
Integrity signals
Registry
Cites
Statistics
Figures
Verification
Claims the paper makes
The claims and statistics of this paper haven’t been checked yet.
Run the check — free, no account needed. It reads the open-access text and checks the sources it cites.
Claims other papers make about this one
Each is checked against this paper’s own text: does it say what the citing paper says it does?
In the citing paper
“For example, women with a history of both childhood sexual abuse and MDD (Pechtel and Pizzagalli, 2013), adolescents exposed to physical abuse (Hanson et al., 2017), and young adults who had high levels of various adversities in early life (Birn et al., 2017) demonstrate decreased reinforcement learning.”
From The effects of early life stress on reward processing (2018) · cites this paper as Birn et al., 2017
Self-check
Percentages, sums and reported differences re-computed from the paper’s own numbers.
The self-check needs the paper’s full text.
Citations
Cites
AFNI: Software for analysis and visualization of functional magnetic resonance neuroimages
Cox, R. W. (1996) · Computers and Biomedical Research · doi:10.1006/cbmr.1996.0014 · Cited by 10,913
A comparison of methods to test mediation and other intervening variable effects
MacKinnon, D. P., Lockwood, C. M., Hoffman, J. M., West, S. G., & Sheets, V. (2002) · Psychological Methods · doi:10.1037/1082-989x.7.1.83 · Cited by 9,406
The Lifelong Effects of Early Childhood Adversity and Toxic Stress
Shonkoff, J. P., Garner, A. S., THE COMMITTEE ON PSYCHOSOCIAL ASPECTS OF CHILD AND FAMILY HEALTH, C. O. E. C., Siegel, B. S., Dobbins, M. I., Earls, M. F., Garner, A. S., McGuinn, L., Pascoe, J., & Wood, D. L. (2012) · Pediatrics · doi:10.1542/peds.2011-2663 · Cited by 5,164
The precuneus: a review of its functional anatomy and behavioural correlates
Cavanna, A. E., & Trimble, M. R. (2006) · Brain · doi:10.1093/brain/awl004 · Cited by 5,128
Norman, R. E., Byambaa, M., De, R., Butchart, A., Scott, J., & Vos, T. (2012) · PLoS Medicine · doi:10.1371/journal.pmed.1001349 · Cited by 3,387
Anticipation of Increasing Monetary Reward Selectively Recruits Nucleus Accumbens
Knutson, B., Adams, C. M., Fong, G. W., & Hommer, D. (2001) · The Journal of Neuroscience · doi:10.1523/jneurosci.21-16-j0002.2001 · Cited by 2,244
Manuscripts Accepted for Publication
(2005) · Child Development · doi:10.1111/j.1467-8624.2005.00876.x · Cited by 2,051
Cumulative risk and child development.
Evans, G. W., Li, D., & Whipple, S. S. (2013) · Psychological Bulletin · doi:10.1037/a0031808 · Cited by 2,024
Youth Risk Behavior Surveillance - United States, 2009
Eaton, D. K., Kann, L. K., Kinchen, S., Shanklin, S. L., Flint, K. H., Hawkins, J., Harris, W. A., Lowry, R., McManus, T., Chyen, D., et al. (2010) · PsycEXTRA Dataset · doi:10.1037/e661322010-001 · Cited by 1,754
Youth Risk Behavior Surveillance — United States, 1999
Kann, L. K., Kinchen, S. A., Williams, B. I., Ross, J. G., Lowry, R., Grunbaum, J. A., & Kolbe, L. J. (2000) · Journal of School Health · doi:10.1111/j.1746-1561.2000.tb07252.x · Cited by 1,633
Liking, wanting, and the incentive-sensitization theory of addiction
Berridge, K. C., & Robinson, T. E. (2016) · American Psychologist · doi:10.1037/amp0000059 · Cited by 1,440
FMRI visualization of brain activity during a monetary incentive delay task
Knutson, B., Westdorp, A., Kaiser, E., & Hommer, D. (2000) · NeuroImage · doi:10.1006/nimg.2000.0593 · Cited by 1,414
Pechtel, P., & Pizzagalli, D. A. (2011) · Psychopharmacology · doi:10.1007/s00213-010-2009-2 · Cited by 1,352
Dissociation of reward anticipation and outcome with event-related fMRI
Knutson, B., Fong, G. W., Adams, C. M., Varner, J. L., & Hommer, D. (2001) · Neuroreport · doi:10.1097/00001756-200112040-00016 · Cited by 1,300
FMRI Clustering in AFNI: False-Positive Rates Redux
Cox, R., Chen, G., Glen, D., Reynolds, R., & Taylor, P. (2017) · Brain Connectivity · doi:10.1089/brain.2016.0475 · Cited by 792
Anticipatory affect: neural correlates and consequences for choice
Knutson, B. D., & Greer, S. M. (2008) · Philosophical Transactions of the Royal Society B Biological Sciences · doi:10.1098/rstb.2008.0155 · Cited by 720
Visual attention: Insights from brain imaging
Kanwisher, N., & Wojciulik, E. (2000) · Nature reviews. Neuroscience · doi:10.1038/35039043 · Cited by 641
Dillon, D. G., Holmes, A. J., Birk, J. L., Brooks, N., Lyons-Ruth, K., & Pizzagalli, D. A. (2009) · Biological Psychiatry · doi:10.1016/j.biopsych.2009.02.019 · Cited by 370
Children of depressed mothers: Maternal strain and symptom predictors of dysfunction.
Hammen, C. L., Adrian, C., Gordon, D., Burge, D., Jaenicke, C., & Hiroto, D. (1987) · Journal of Abnormal Psychology · doi:10.1037//0021-843x.96.3.190 · Cited by 355
Children of depressed mothers: maternal strain and symptom predictors of dysfunction
Hammen, C., Adrian, C., Gordon, D., Burge, D., Jaenicke, C., & Hiroto, D. (1987) · Journal of Abnormal Psychology · doi:10.1037/0021-843x.96.3.190 · Cited by 354
Stress, depression and the mesolimbic dopamine system
Cabib, S., & Puglisi‐Allegra, S. (1996) · Psychopharmacology · doi:10.1007/s002130050142 · Cited by 320
Severe stress switches CRF action in the nucleus accumbens from appetitive to aversive
Lemos, J. C., Wanat, M. J., Smith, J. S., Reyes, B. A. S., Hollon, N. G., Bockstaele, E. J. V., Chavkin, C., & Phillips, P. E. M. (2012) · Nature · doi:10.1038/nature11436 · Cited by 319
Abortion surveillance--United States, 1999.
Elam–Evans, L. D., Strauss, L. T., Herndon, J. L., Parker, W. Y., Whitehead, S. J., & Berg, C. J. (2002) · PubMed · Cited by 308
Balodis, I. M., Kober, H., Worhunsky, P. D., Stevens, M. C., Pearlson, G. D., & Potenza, M. N. (2012) · Biological Psychiatry · doi:10.1016/j.biopsych.2012.01.006 · Cited by 305
Matthews, K., & Robbins, T. W. (2003) · Neuroscience & Biobehavioral Reviews · doi:10.1016/s0149-7634(03)00008-3 · Cited by 237
fMRI clustering and false-positive rates
Cox, R. W., Chen, G., Glen, D. R., Reynolds, R. C., & Taylor, P. A. (2017) · Proceedings of the National Academy of Sciences · doi:10.1073/pnas.1614961114 · Cited by 219
Boecker, R., Holz, N. E., Buchmann, A. F., Blomeyer, D., Plichta, M. M., Wolf, I., Baumeister, S., Meyer-Lindenberg, A., Banaschewski, T., Brandeis, D., et al. (2014) · PLoS ONE · doi:10.1371/journal.pone.0104185 · Cited by 157
Decision-related loss: Regret and disappointment
Chua, H. F., Gonzalez, R., Taylor, S. F., Welsh, R. C., & Liberzon, I. (2009) · NeuroImage · doi:10.1016/j.neuroimage.2009.06.006 · Cited by 147
Differential effects of acute stress on anticipatory and consummatory phases of reward processing
Kumar, P., Berghorst, L. H., Nickerson, L. D. H., Dutra, S. J., Goer, F., Greve, D. N., & Pizzagalli, D. A. (2014) · Neuroscience · doi:10.1016/j.neuroscience.2014.01.058 · Cited by 146
Harms, M. B., Shannon, K. E., Hanson, J. L., & Pollak, S. D. (2017) · Developmental Science · doi:10.1111/desc.12596 · Cited by 138
Self-citationStress effects on the neural substrates of motivated behavior
Hollon, N. G., Burgeno, L. M., & Phillips, P. E. M. (2015) · Nature Neuroscience · doi:10.1038/nn.4114 · Cited by 129
Pryce, C. R., Dettling, A. C., Spengler, M., Schnell, C. R., & Feldon, J. (2004) · Biological Psychiatry · doi:10.1016/j.biopsych.2004.05.002 · Cited by 124
Choi, J., Shin, Y. C., Jung, W. H., Jang, J. H., Kang, D., Choi, C., Choi, S., Lee, J., Hwang, J. Y., & Kwon, J. S. (2012) · PLoS ONE · doi:10.1371/journal.pone.0045938 · Cited by 120
Pollak, S. D. (2015) · Development and Psychopathology · doi:10.1017/s0954579415000826 · Cited by 56
Self-citationAlterations of Monetary Reward and Punishment Processing in Chronic Cannabis Users: An fMRI Study
Enzi, B., Lissek, S., Edel, M., Tegenthoff, M., Nicolas, V., Scherbaum, N., Juckel, G., & Roser, P. (2015) · PLoS ONE · doi:10.1371/journal.pone.0119150 · Cited by 37
Cited by
Sorted by citations
Early life stress and development: potential mechanisms for adverse outcomes
Smith, K. E., & Pollak, S. D. (2020) · Journal of Neurodevelopmental Disorders · doi:10.1186/s11689-020-09337-y · Cited by 500
Self-citationSmith, K. E., & Pollak, S. D. (2020) · Perspectives on Psychological Science · doi:10.1177/1745691620920725 · Cited by 379
Self-citationForkey, H. C., Szilagyi, M. A., Kelly, E. T., Duffee, J. H., Springer, S. H., Fortin, K., Jones, V. F., Greiner, M. B. V., Ochs, T. J., Partap, A. N., et al. (2021) · PEDIATRICS · doi:10.1542/peds.2021-052580 · Cited by 247
Herzberg, M. P., & Gunnar, M. R. (2019) · NeuroImage · doi:10.1016/j.neuroimage.2019.116493 · Cited by 265
Emotion regulation as mediator between childhood adversity and psychopathology: A meta-analysis
Miu, A. C., Szentágotai-Tătar, A., Balázsi, R., Nechita, D., Bunea, I., & Pollak, S. D. (2022) · Clinical Psychology Review · doi:10.1016/j.cpr.2022.102141 · Cited by 233
Self-citation
Metadata
- Authors
- Birn, R. M., Roeber, B. J., & Pollak, S. D.
- Affiliations
- University of Wisconsin–Madison (US)
- Corresponding author
- Birn, Rasmus M.
- Pollak, Seth D.
- Venue
- Proceedings of the National Academy of Sciences
- Publisher
- National Academy of Sciences
- Published
- 2017-12-04
- Volume
- 114
- Issue
- 51
- Pages
- 13549-13554
- ISSN
- 0027-8424 (ISSN-L)
- 1091-6490
- PMC
- PMC5754769
- OpenAlex
- W2774496090
- Cited by
- 197
- References
- 35
- Citations by year
- 2026: 13 · 2025: 13 · 2024: 42 · 2023: 30 · 2022: 20 · 2021: 30 · 2020: 30 · 2019: 12 · 2018: 7
- FWCI
- 16.58
- Type
- journal article
- Language
- en
- Open access
- hybrid
- doi.org
- Licence
- Locations
- Proceedings of the National Academy of Sciences (publishedVersion, cc-by-nc-nd)
- PubMed Central (publishedVersion, cc-by-nc-nd)
- PubMed (publishedVersion)
- Funders
- HHS | National Institutes of Health (MH61285, MH68858, HD03352)
- Topics
- Social Sciences › Psychology › Clinical Psychology › Child Abuse and Trauma
- Life Sciences › Neuroscience › Cognitive Neuroscience › Neural and Behavioral Psychology Studies
- Life Sciences › Neuroscience › Behavioral Neuroscience › Stress Responses and Cortisol
- Keywords
- early childhood stress, reward processing, loss anticipation, decision-making, risk-taking, reward pathways, posterior cingulate cortex, insula, putamen, inferior frontal gyrus, living conditions, brain development
- MeSH terms
- Child, Child Abuse, Decision Making, Female, Humans, Male, Reward, Stress, Psychological, Young Adult
About these checks
Registry, retraction, Cites and statistics results are computed, not judged, with one exception: a printed reference that no index lists is read once by a model before it counts as a citation error. Claims are extracted by a model and kept only when their quote appears verbatim in the text; each cited source is then checked, with a model’s help, for whether it says what the claim relies on. Those verdicts can be wrong — read the claim’s quote and the cited source before relying on one.
Statistics and arithmetic are recomputed, not judged.
Confidence bands are shown only for fields calibrated on our annotated test set. None is calibrated yet, so no band is shown.
What counts as a claim ›How we measure confidence ›How we check this ›
Are you an author, or do you see a problem with this page? Request a review
