

The DOI matches its Crossref record; 72 of the 72 references it cites were found in a registry or an index.
Genetic analysis of social-class mobility in five longitudinal studies
Open accessAbstract
Significance: Genome-wide association study (GWAS) discoveries about educational attainment have raised questions about the meaning of the genetics of success. These discoveries could offer clues about biological mechanisms or, because children inherit genetics and social class from parents, education-linked genetics could be spurious correlates of socially transmitted advantages. To distinguish between these hypotheses, we studied social mobility in five cohorts from three countries. We found that people with more education-linked genetics were more successful compared with parents and siblings. We also found mothers’ education-linked genetics predicted their children’s attainment over and above the children’s own genetics, indicating an environmentally mediated genetic effect. Findings reject pure social-transmission explanations of education GWAS discoveries. Instead, genetics influences attainment directly through social mobility and indirectly through family environments.
Overview
The claims and statistics of this paper haven’t been checked yet.
Run the check — free, no account needed. It reads the open-access text and checks the sources it cites.
Integrity signals
Registry
Cites
Statistics
Figures
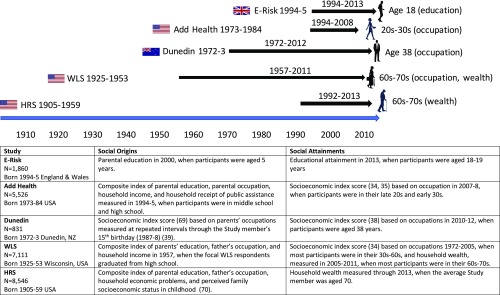
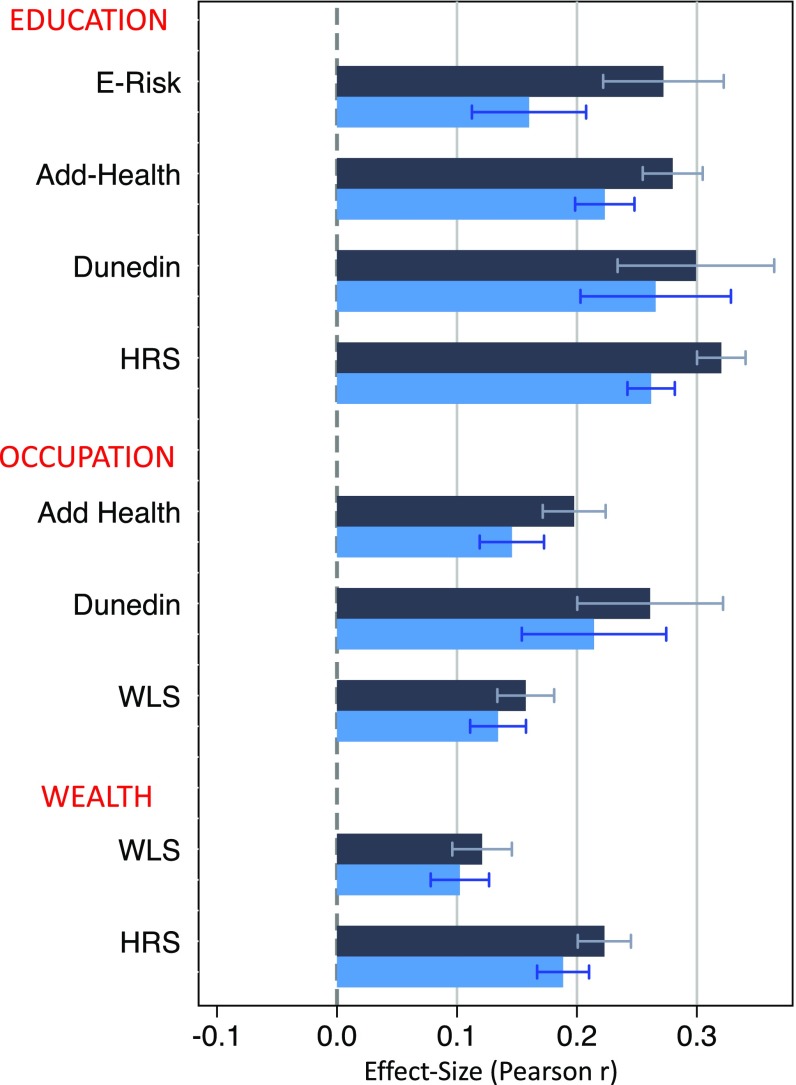
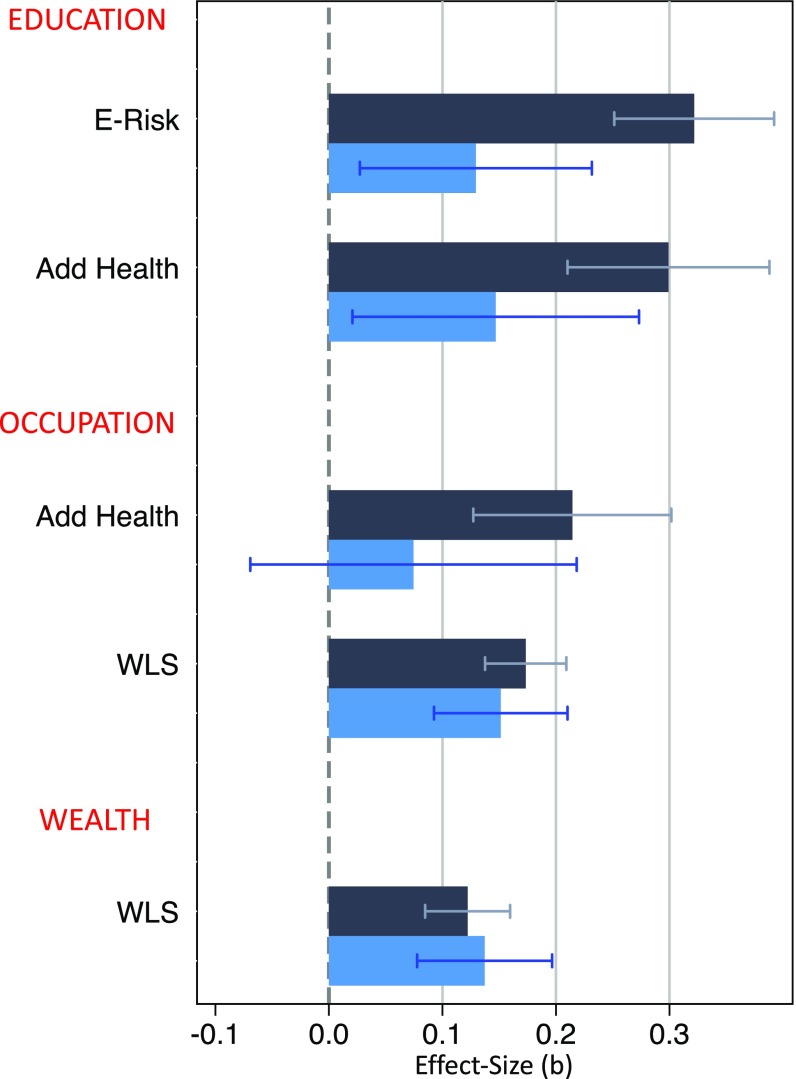
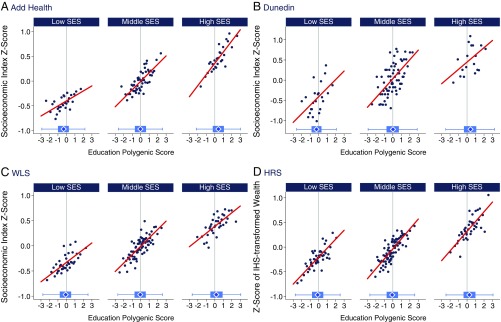
Verification
Claims the paper makes
The claims and statistics of this paper haven’t been checked yet.
Run the check — free, no account needed. It reads the open-access text and checks the sources it cites.
Claims other papers make about this one
Each is checked against this paper’s own text: does it say what the citing paper says it does?
The cited source says what the claim attributes to it.
In the citing paper
“This remainder is due to assortment on phenotypes correlated with the EA PGI other than EA, cognitive performance, and vocabulary—possibly including various personality traits42-44—and sources of social homogamy other than genetic ancestry captured by the top 40 PCs—possibly including geographic location at courtship age45,46, socioeconomic status, and social class47.”
From Polygenic prediction of educational attainment within and between families from genome-wide association analyses in 3 million individuals (2022) · cites this paper as [47]
Self-check
Percentages, sums and reported differences re-computed from the paper’s own numbers.
The self-check needs the paper’s full text.
Citations
Cites
Principal components analysis corrects for stratification in genome-wide association studies
Price, A. L., Patterson, N. J., Plenge, R. M., Weinblatt, M. E., Shadick, N. A., & Reich, D. (2006) · Nature Genetics · doi:10.1038/ng1847 · Cited by 10,248 · cited 1×
“Within each dataset, we regressed SSGAC-computed polygenic scores on the first 10 principal components estimated from the genome-wide SNP data (67) and calculated residual values.”
MethodSocial conditions as fundamental causes of disease.
Link, B. G., & Phelan, J. (1995) · Journal of Health and Social Behavior · doi:10.2307/2626958 · Cited by 5,722
The American Occupational Structure.
Blalock, H. M., Blau, P. M., Duncan, O. D., & Tyrée, A. (1968) · American Sociological Review · doi:10.2307/2092399 · Cited by 4,412
An atlas of genetic correlations across human diseases and traits
ReproGen Consortium, Bulik-Sullivan, B., Psychiatric Genomics Consortium, Genetic Consortium for Anorexia Nervosa of the Wellcome Trust Case Control Consortium 3, Finucane, H. K., Anttila, V., Gusev, A., Day, F. R., Loh, P.-R., Duncan, L., et al. (2015) · Nature Genetics · doi:10.1038/ng.3406 · Cited by 4,255
10 Years of GWAS Discovery: Biology, Function, and Translation
Visscher, P. M., Wray, N. R., Zhang, Q., Sklar, P., McCarthy, M. I., Brown, M. A., & Yang, J. (2017) · The American Journal of Human Genetics · doi:10.1016/j.ajhg.2017.06.005 · Cited by 3,719
How People Make Their Own Environments: A Theory of Genotype Environment Effects
Scarr, S., & McCartney, K. (1983) · Child Development · doi:10.1111/j.1467-8624.1983.tb03884.x · Cited by 2,895 · cited 3×
“This evidence supports theory in the social sciences that frames genetics as one mechanism among several through which social position is transmitted across generations (9, 20, 21, 59).”
BackgroundSocial Conditions as Fundamental Causes of Disease
Link, B. G., & Phelan, J. C. (1995) · PubMed · doi:10.13016/rpln-eiwa · Cited by 2,684
23andMe Research Team, Lee, J. J., COGENT (Cognitive Genomics Consortium), Social Science Genetic Association Consortium, Wedow, R., Okbay, A., Kong, E., Maghzian, O., Zacher, M., Nguyen-Viet, T. A., et al. (2018) · Nature Genetics · doi:10.1038/s41588-018-0147-3 · Cited by 2,470
Self-citationMeta-analysis of the heritability of human traits based on fifty years of twin studies
Polderman, T. J. C., Benyamin, B., de Leeuw, C. A., Sullivan, P. F., van Bochoven, A., Visscher, P. M., & Posthuma, D. (2015) · Nature Genetics · doi:10.1038/ng.3285 · Cited by 2,467
An Equilibrium Theory of the Distribution of Income and Intergenerational Mobility
Becker, G. S., & Tomes, N. (1979) · Journal of Political Economy · doi:10.1086/260831 · Cited by 2,243 · cited 1×
“This evidence supports theory in the social sciences that frames genetics as one mechanism among several through which social position is transmitted across generations (9, 20, 21, 59).”
Background
Research works printed but not linked: 2
- J Lee, , Gene discovery and polygenic prediction from a 1.1-million-person GWAS of educational attainment. Nat Genet, in press.
- WB Elley, JC Irving, Revised socioeconomic index for New-Zealand. N Z J Educ Stud 11, 25–36 (1976).
Cited by
Sorted by citations
Items 301–318 of 318
Ali, N., van der Heijden, F., Baene, W. D., van den Heuvel, M. I., & Sitskoorn, M. M. (2026) · Neuroscience & Biobehavioral Reviews · doi:10.1016/j.neubiorev.2026.106605
Weighing down the future: long-term effects of childhood obesity on intergenerational mobility
Fan, M., Jin, Y., & Zhang, M. (2026) · Journal of Population Economics · doi:10.1007/s00148-026-01147-1
“7 For instance, Belsky et al. (2018) find that individuals with higher education-related PGSs are more likely to achieve career success, accumulate greater wealth, and experience upward social mobility relative to their parents.”
Linarte, J. T., & Spörlein, C. (2026) · Social Science Research · doi:10.1016/j.ssresearch.2026.103324 · Cited by 2
Social mobility and parenting: Testing associations in a prospective longitudinal cohort study
Islam, S., Jaffee, S. R., Belsky, J., Hancox, R. J., Poulton, R., Ramrakha, S., & Wertz, J. (2026) · Child Development · doi:10.1093/chidev/aacaf050
“Despite the prospective-longitudinal design and control for pre-existing differences between mobility groups, there may be additional unobserved variables, such as personal characteristics or genetic influences on social mobility and parenting (D. W. Belsky et al., 2018; Wertz et al., 2019).”
Self-citationFinancial assets and cardiometabolic risk in early adulthood: Evidence from add health
Cheng, H., & Schechtl, M. (2026) · Social Science & Medicine · doi:10.1016/j.socscimed.2026.119006
Strengthening Causal Inference Using Sibling Designs
Schlomer, G. L., Robertson, O. C., & Marceau, K. P. (2026) · Wiley eBooks · doi:10.1002/9781119880851.ch3
Wang, J., Yang, Y., Mei, H., Yuan, Y., Mei, K., Fang, H., Ruan, W., Wang, T., Chen, L., Liang, Y., et al. (2026) · Child and Adolescent Psychiatry and Mental Health · doi:10.1186/s13034-026-01066-9
“Moreover, enhanced EFs have been linked to higher levels of educational attainment and career success, which contribute to improved socioeconomic stability [6, 7].”
Dobewall, H., Vaalavuo, M., Böckerman, P., Viinikainen, J., Sirniö, O., Kantojärvi, K., Pehkonen, J., Raitakari, O. T., & Lehtimäki, T. J. (2026) · Demography · doi:10.1215/00703370-12550847 · Cited by 2
Domingue, B. W., Trejo, S., & Martschenko, D. O. (2023) · OSF Preprints (OSF Preprints)
Self-citationSiddoway, C., Rogers, A. A., & Christensen-Duerden, C. (2026) · Archives of Sexual Behavior · doi:10.1007/s10508-026-03460-y
“Maternal education predicts higher educational attainment in their children (Belsky et al., 2018; Strømme & Wiborg, 2024).”
Intergenerational Mobility: New Ideas, New Evidence, and Remaining Puzzles
Lindahl, M. (2026) · Oxford University Press eBooks · doi:10.1093/9780197851418.003.0962
Slutske, W. S., Baker, T. B., & Piasecki, T. M. (2026) · Addiction · doi:10.1111/add.70533
“Parental SES was based on parent reports obtained from Add Health wave 1 when the participants were adolescents, and included parental education, parental occupation, household income and household receipt of public assistance [25].”
Stratified Equality of Opportunity in the German Education System: Evidence from the SOEP-G Data
Harjes, L. (2026) · KZfSS Kölner Zeitschrift für Soziologie und Sozialpsychologie · doi:10.1007/s11577-026-01089-2
Social and Genetic Origins Show Similar Patterns of Stratification in Educational Attainment
Isungset, M. A. (2026) · Socius Sociological Research for a Dynamic World · doi:10.1177/23780231261474336
Mapping Research on Genetics and Educational Outcomes: A Bibliometric Review (1970-2025)
Pellegrino, A., & Stasi, A. (2026) · OBM Genetics · doi:10.21926/obm.genet.2603355
Tuder, S., Martin, C., Hargrove, T., Boen, C. E., D'Alessio, A., Harris, K., Aiello, A., & Gaydosh, L. (2026) · Social Science & Medicine · doi:10.1016/j.socscimed.2026.119787
Self-citationSlutske, W. S., Baker, T. B., Boardman, J. D., & Piasecki, T. M. (2026) · Drug and Alcohol Dependence · doi:10.1016/j.drugalcdep.2026.113357
Self-citationSchool Performance Explains Socioeconomic Differences in Mental HealthPreprint
Nordmo, M., Melby‐Lervåg, M., & Torvik, F. A. (2026) · Research Square · doi:10.21203/rs.3.rs-9550794/v1
Metadata
- Authors
- Belsky, D. W., Domingue, B. W., Wedow, R., Arseneault, L., Boardman, J. D., Caspi, A., Conley, D., Fletcher, J. M., Freese, J., Herd, P., Moffitt, T. E., Poulton, R., Sicinski, K., Wertz, J., & Harris, K. M.
- Affiliations
- Duke University (US)
- Stanford University (US)
- University of Colorado Boulder (US)
- King's College London (GB)
- Princeton University (US)
- University of Wisconsin–Madison (US)
- Department of Sociology, Stanford University, Stanford, CA 94305;
- University of Otago (NZ)
- University of North Carolina at Chapel Hill (US)
- Corresponding author
- Belsky, Daniel W.
- Harris, Kathleen Mullan
- ORCID
- Venue
- Proceedings of the National Academy of Sciences
- Publisher
- National Academy of Sciences
- Published
- 2018-07-09
- Volume
- 115
- Issue
- 31
- Pages
- E7275-E7284
- ISSN
- 0027-8424 (ISSN-L)
- 1091-6490
- PMC
- PMC6077729
- OpenAlex
- W2848694795
- Cited by
- 315
- References
- 72
- Citations by year
- 2026: 21 · 2025: 26 · 2024: 36 · 2023: 35 · 2022: 42 · 2021: 47 · 2020: 34 · 2019: 65 · 2018: 8
- FWCI
- 87.42
- Type
- journal article
- Language
- en
- Update notices
- correction (2018-11-05)
- Open access
- hybrid
- doi.org
- Licence
- Locations
- Proceedings of the National Academy of Sciences (publishedVersion, cc-by-nc-nd)
- Europe PMC (PubMed Central) (publishedVersion, cc-by-nc-nd)
- PubMed Central (publishedVersion, cc-by-nc-nd)
- PubMed (publishedVersion)
- RePEc: Research Papers in Economics (submittedVersion)
- Research Portal (King's College London) (submittedVersion, cc-by-nc-nd)
- Funders
- Office of Extramural Research, National Institutes of Health (R01HD077482, P01HD31921, R01HD073342, R01HD060726, R01AG032282)
- UK Medical Research Council (G1002190, MR/P005918/1)
- Jacobs Foundation (Jacobs Prize, Early Career Fellowship)
- Russel Sage Foundation (961704)
- National Science Foundation (DGE1144083)
- Topics
- Social Sciences › Sociology and Political Science › Intergenerational and Educational Inequality Studies
- Life Sciences › Biochemistry, Genetics and Molecular Biology › Genetics › Genetic Associations and Epidemiology
- Social Sciences › Psychology › Experimental and Cognitive Psychology › Cognitive Abilities and Testing
- Keywords
- social mobility, educational attainment, polygenic risk score, upward mobility, socioeconomic attainment, wealth accumulation, parental socioeconomic status, family environment
- MeSH terms
- Educational Status, Genetic Testing, Humans, Longitudinal Studies, Occupations, Social Class, Social Mobility, Siblings, Genome-Wide Association Study
About these checks
Registry, retraction, Cites and statistics results are computed, not judged, with one exception: a printed reference that no index lists is read once by a model before it counts as a citation error. Claims are extracted by a model and kept only when their quote appears verbatim in the text; each cited source is then checked, with a model’s help, for whether it says what the claim relies on. Those verdicts can be wrong — read the claim’s quote and the cited source before relying on one.
Statistics and arithmetic are recomputed, not judged.
Confidence bands are shown only for fields calibrated on our annotated test set. None is calibrated yet, so no band is shown.
What counts as a claim ›How we measure confidence ›How we check this ›
Are you an author, or do you see a problem with this page? Request a review
