

Predictability of human differential gene expression
Open accessThe DOI matches its Crossref record; 94 of the 94 references it cites were found in a registry or an index.
Abstract
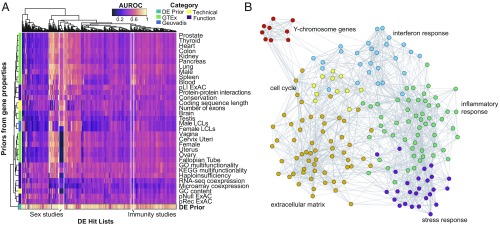
Differential expression (DE) is commonly used to explore molecular mechanisms of biological conditions. While many studies report significant results between their groups of interest, the degree to which results are specific to the question at hand is not generally assessed, potentially leading to inaccurate interpretation. This could be particularly problematic for metaanalysis where replicability across datasets is taken as strong evidence for the existence of a specific, biologically relevant signal, but which instead may arise from recurrence of generic processes. To address this, we developed an approach to predict DE based on an analysis of over 600 studies. A predictor based on empirical prior probability of DE performs very well at this task (mean area under the receiver operating characteristic curve, ∼0.8), indicating that a large fraction of DE hit lists are nonspecific. In contrast, predictors based on attributes such as gene function, mutation rates, or network features perform poorly. Genes associated with sex, the extracellular matrix, the immune system, and stress responses are prominent within the “DE prior.” In a series of control studies, we show that these patterns reflect shared biology rather than technical artifacts or ascertainment biases. Finally, we demonstrate the application of the DE prior to data interpretation in three use cases: ( i ) breast cancer subtyping, ( ii ) single-cell genomics of pancreatic islet cells, and ( iii ) metaanalysis of lung adenocarcinoma and renal transplant rejection transcriptomics. In all cases, we find hallmarks of generic DE, highlighting the need for nuanced interpretation of gene phenotypic associations.
Overview
The claims and statistics of this paper haven’t been checked yet.
Free: it reads the open-access text and checks the first 5 claims that cite a source we can check. Create a free account to check every claim.
Integrity signals
Registry
Cites
Statistics
Figures




Verification
Claims the paper makes
The claims and statistics of this paper haven’t been checked yet.
Free: it reads the open-access text and checks the first 5 claims that cite a source we can check. Create a free account to check every claim.
Claims other papers make about this one
Each is checked against this paper’s own text: does it say what the citing paper says it does?
The check wasn’t confident either way, so it gives no verdict — never disputed.
In the citing paper
“In simulations, we confirmed that the TRADE perturbation impact and response enrichment estimators are approximately unbiased, including for small gene sets (Supplementary Fig. 14), and we performed further validation with positive-control gene sets19,20 (Supplementary Fig. 15).”
From Transcriptome-wide analysis of differential expression in perturbation atlases (2025) · cites this paper as [19]
Experimental — accuracy not yet measured
Self-check
Percentages, sums and reported differences re-computed from the paper’s own numbers.
The self-check needs the paper’s full text.
Citations
Cites
Molecular portraits of human breast tumours
Perou, C. M., Sørlie, T., Eisen, M. B., van de Rijn, M., Jeffrey, S. S., Rees, C. A., Pollack, J. R., Ross, D. T., Johnsen, H., Akslen, L. A., et al. (2000) · Nature · doi:10.1038/35021093 · Cited by 16,261 · cited 1×
“Almost two decades ago, it was observed that breast cancer subtypes were distinguishable by their mRNA expression patterns (30).”
BackgroundThe igraph software package for complex network research
Csárdi, G., & Nepusz, T. (2006) · Medical Entomology and Zoology · Cited by 13,507
Nishimura, R., Osako, T., Nishiyama, Y., Tashima, R., Nakano, M., Fujisue, M., Toyozumi, Y., & Arima, N. (2013) · Oncology · doi:10.1159/000353099 · Cited by 13,166
Gene expression profiling predicts clinical outcome of breast cancer
van 't Veer, L. J., Dai, H., van de Vijver, M. J., He, Y. D., Hart, A. A. M., Mao, M., Peterse, H. L., van der Kooy, K., Marton, M. J., Witteveen, A. T., et al. (2002) · Nature · doi:10.1038/415530a · Cited by 9,536 · cited 1×
“This type of analysis has been used as the basis for key insights into the genes that drive physiological and disease mechanisms, for example, identifying novel circadian rhythm genes (1), characterizing transcriptional mechanisms of stem cell differentiation (2), and highlighting the critical role of cell proliferati…”
Methodlimma: Linear Models for Microarray Data
Smyth, G. K. (2005) · Statistics for Biology and Health · doi:10.1007/0-387-29362-0_23 · Cited by 5,796 · cited 1×
“Processed and parsed kidney transplant rejection data and lung adenocarcinoma data were kindly provided by Purvesh Khatri, Stanford University, Stanford, CA, and Timothy Sweeney, Inflammatix, Burlingame, CA, as RDS files (87), and limma (91) was used for DE analysis.”
MethodRepeated observation of breast tumor subtypes in independent gene expression data sets
Sørlie, T., Tibshirani, R., Parker, J., Hastie, T., Marron, J. S., Nobel, A., Deng, S., Johnsen, H., Pesich, R., Geisler, S., et al. (2003) · Proceedings of the National Academy of Sciences · doi:10.1073/pnas.0932692100 · Cited by 5,429 · cited 1×
“Since then, the set of genes required for classification was increasingly refined (31, 32), and now a set of 50 genes called “PAM50” for “Prediction Analysis of Microarray 50,” are available as a commercial kit for clinical use (33).”
BackgroundThe Genotype-Tissue Expression (GTEx) pilot analysis: Multitissue gene regulation in humans
The GTEx Consortium, Ardlie, K. G., Deluca, D. S., Segrè, A. V., Sullivan, T. J., Young, T. R., Gelfand, E. T., Trowbridge, C. A., Maller, J. B., Tukiainen, T., et al. (2015) · Science · doi:10.1126/science.1262110 · Cited by 5,062 · cited 4×
“The genotype-tissue expression (GTEx) pilot analysis: Multitissue gene regulation in humans.”
MethodInfluentialDissecting the multicellular ecosystem of metastatic melanoma by single-cell RNA-seq
Tirosh, I., Izar, B., Prakadan, S. M., Wadsworth, M. H., Treacy, D., Trombetta, J. J., Rotem, A., Rodman, C., Lian, C., Murphy, G., et al. (2016) · Science · doi:10.1126/science.aad0501 · Cited by 4,944 · cited 1×
“Studies of single-cell transcriptomics are perhaps the most obvious method for doing this, as they allow for expression to be dissected into cell type-specific signals, already helping to deconvolve immune responses within the tumor microenvironment, for example (80).”
MethodSupervised Risk Predictor of Breast Cancer Based on Intrinsic Subtypes
Parker, J. S., Mullins, M., Cheang, M. C. U., Leung, S., Voduc, D., Vickery, T., Davies, S., Fauron, C., He, X., Hu, Z., et al. (2009) · Journal of Clinical Oncology · doi:10.1200/jco.2008.18.1370 · Cited by 4,721 · cited 1×
“Since then, the set of genes required for classification was increasingly refined (31, 32), and now a set of 50 genes called “PAM50” for “Prediction Analysis of Microarray 50,” are available as a commercial kit for clinical use (33).”
BackgroundElkablawy, M. A., Albasri, A. M., Mohammed, R. A., Hussainy, A. S., Nouh, M. M., & Alhujaily, A. S. (2016) · Saudi Medical Journal · doi:10.15537/smj.2016.2.12285 · Cited by 4,382
Cited by
Qin, Q., Fan, J., Zheng, R., Wan, C., Mei, S., Wu, Q., Sun, H., Brown, M., Zhang, J., Meyer, C. A., et al. (2020) · Genome Biology · doi:10.1186/s13059-020-1934-6 · Cited by 296
(2020) · doi:10.1093/nar/gkaa609 · Cited by 268
Ellis, J. L., Jacobs, M., Dijkstra, J., van Laar, H., Cant, J. P., Tulpan, D., & Ferguson, N. D. (2020) · animal · doi:10.1017/s1751731120000312 · Cited by 120
“Mechanistic models used to interpret big ‘omics’ data There is a plethora of ‘omics’ data currently being generated but with minimal biological interpretation of their meaning (data translated into information) (Crow et al., 2019; Misra et al., 2018).”
MethodGoosens, S., Wybouw, N., Leeuwen, T. V., & Bonte, D. (2020) · Movement Ecology · doi:10.1186/s40462-020-0192-2 · Cited by 93
Meena, J., & Hasija, Y. (2022) · Computers in Biology and Medicine · doi:10.1016/j.compbiomed.2022.105505 · Cited by 72
Metadata
- Authors
- Crow, M., Lim, N., Ballouz, S., Pavlidis, P., & Gillis, J.
- Affiliations
- Cold Spring Harbor Laboratory (US)
- University of British Columbia (CA)
- Corresponding author
- Gillis, Jesse
- Venue
- Proceedings of the National Academy of Sciences
- Publisher
- National Academy of Sciences
- Published
- 2019-03-07
- Volume
- 116
- Issue
- 13
- Pages
- 6491-6500
- ISSN
- 0027-8424 (ISSN-L)
- 1091-6490
- PMC
- PMC6442595
- OpenAlex
- W2921170286
- Cited by
- 117
- References
- 92
- Citations by year
- 2026: 2 · 2025: 9 · 2024: 13 · 2023: 15 · 2022: 22 · 2021: 29 · 2020: 24 · 2019: 3
- FWCI
- 6.45
- Type
- journal article
- Language
- en
- Open access
- hybrid
- doi.org
- Licence
- Locations
- Proceedings of the National Academy of Sciences (publishedVersion, cc-by-nc-nd)
- Europe PMC (PubMed Central) (publishedVersion, cc-by-nc-nd)
- PubMed Central (publishedVersion, cc-by-nc-nd)
- PubMed (publishedVersion)
- Cold Spring Harbor Laboratory Institutional Repository (Cold Spring Harbor Laboratory) (acceptedVersion)
- UNSWorks (University of New South Wales, Sydney, Australia) (submittedVersion, cc-by-nc-nd)
- Funders
- HHS | NIH | National Institute of Mental Health (F32MH114501, R01MH113005, R01MH111099)
- Brain and Behavior Research Foundation (26140)
- HHS | NIH | U.S. National Library of Medicine (R01LM012736)
- Topics
- Life Sciences › Biochemistry, Genetics and Molecular Biology › Molecular Biology › Gene expression and cancer classification
- Life Sciences › Biochemistry, Genetics and Molecular Biology › Molecular Biology › Bioinformatics and Genomic Networks
- Life Sciences › Biochemistry, Genetics and Molecular Biology › Molecular Biology › Genomics and Phylogenetic Studies
- Keywords
- differential gene expression, ascertainment bias, extracellular matrix, immune system genes, stress response genes, breast cancer subtyping, lung adenocarcinoma, renal allograft rejection
- MeSH terms
- Human Genetics, Adenocarcinoma, Electronic Data Processing, Breast Neoplasms, Female, Gene Expression Regulation, Graft Rejection, Humans, Lung Neoplasms, Probability, Recurrence, ROC Curve, Sensitivity and Specificity, Biomarkers, Tumor, Kidney Transplantation, Genes, Essential, Gene Expression Profiling, Genomics, Gene Regulatory Networks, Transcriptome
About these checks
Registry, retraction, Cites and statistics results are computed, not judged, with one exception: a printed reference that no index lists is read once by a model before it counts as a citation error. Claims are extracted by a model and kept only when their quote appears verbatim in the text; each cited source is then checked, with a model’s help, for whether it says what the claim relies on. Those verdicts can be wrong — read the claim’s quote and the cited source before relying on one.
Statistics and arithmetic are recomputed, not judged.
Confidence bands are shown only for fields calibrated on our annotated test set. None is calibrated yet, so no band is shown.
What counts as a claim ›How we measure confidence ›How we check this ›
Are you an author, or do you see a problem with this page? Request a review
How to cite
Cite CoChat for the checks on this page, and the paper for its own findings.
- This page
- CoChat. (2026). Citation check: Predictability of human differential gene expression. https://app.cochat.ai/papers/10.1073/pnas.1802973116
- The paper
- Crow, M., Lim, N., Ballouz, S., Pavlidis, P., & Gillis, J. (2019). Predictability of human differential gene expression. Proceedings of the National Academy of Sciences. https://doi.org/10.1073/pnas.1802973116
Data sources
Bibliographic data: Semantic Scholar, OpenAlex, Crossref.
Contains information from the Semantic Scholar Academic Graph Datasets, made available under the ODC Attribution License (ODC-BY 1.0).
Semantic Scholar’s data is described in: Kinney, R., et al. (2023). The Semantic Scholar Open Data Platform. arXiv:2301.10140.
