

The DOI matches its Crossref record; 5 of the 5 references it cites were found in a registry or an index.
NF-κB Activation Represses Tumor Necrosis Factor-α-induced Autophagy
Overview
The claims and statistics of this paper haven’t been checked yet.
Run the check — free, no account needed. It reads the open-access text and checks the sources it cites.
Integrity signals
Registry
Cites
Statistics
Figures
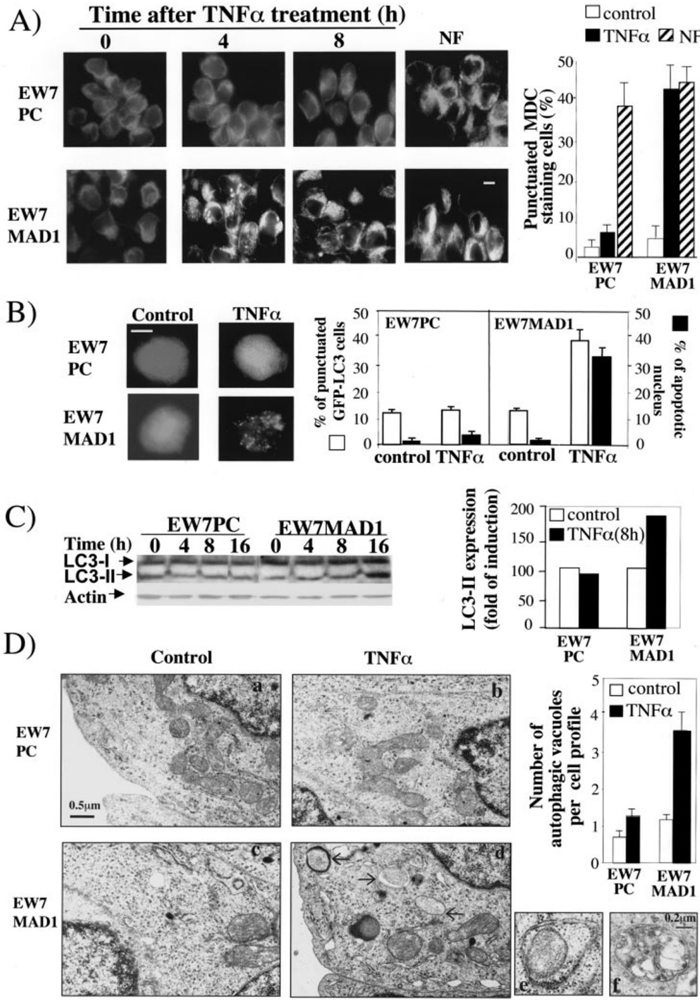
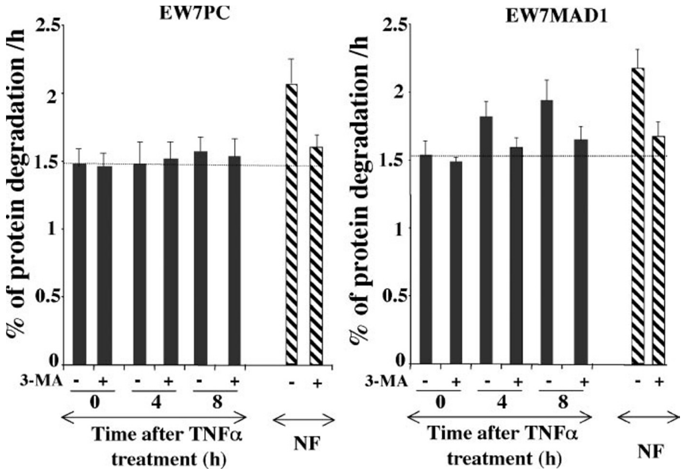
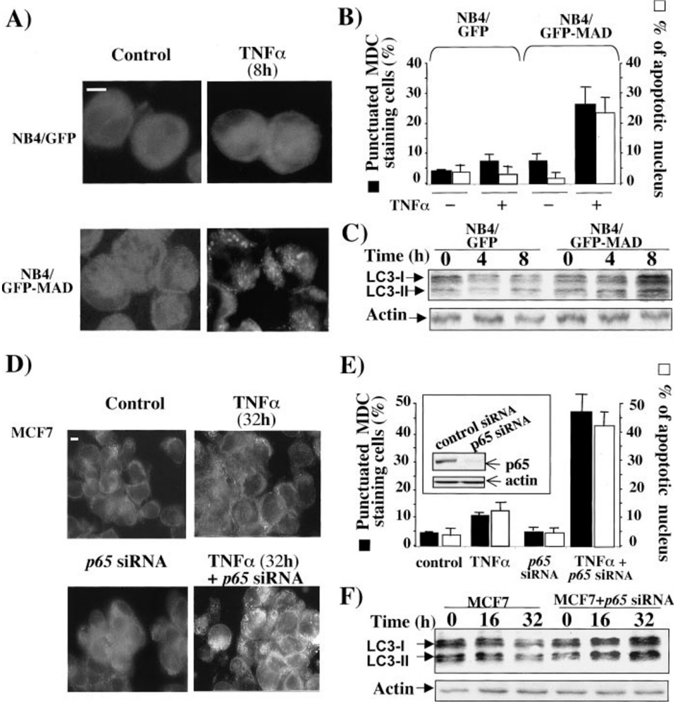
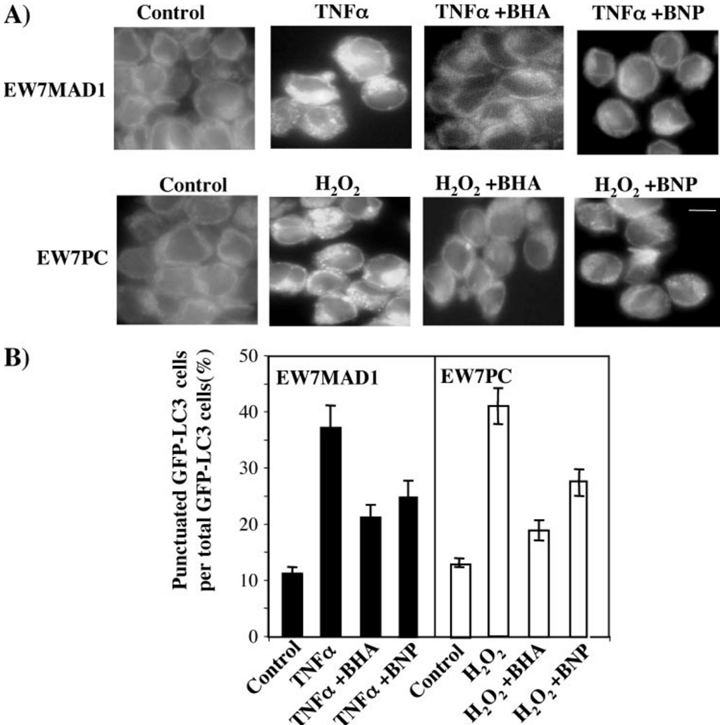
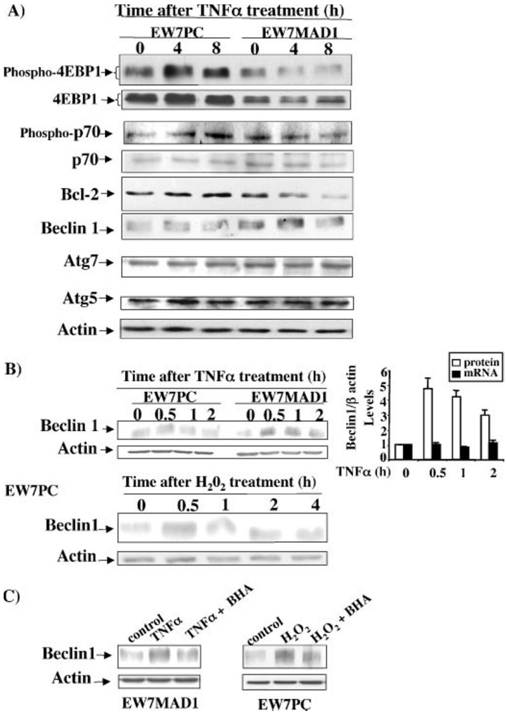
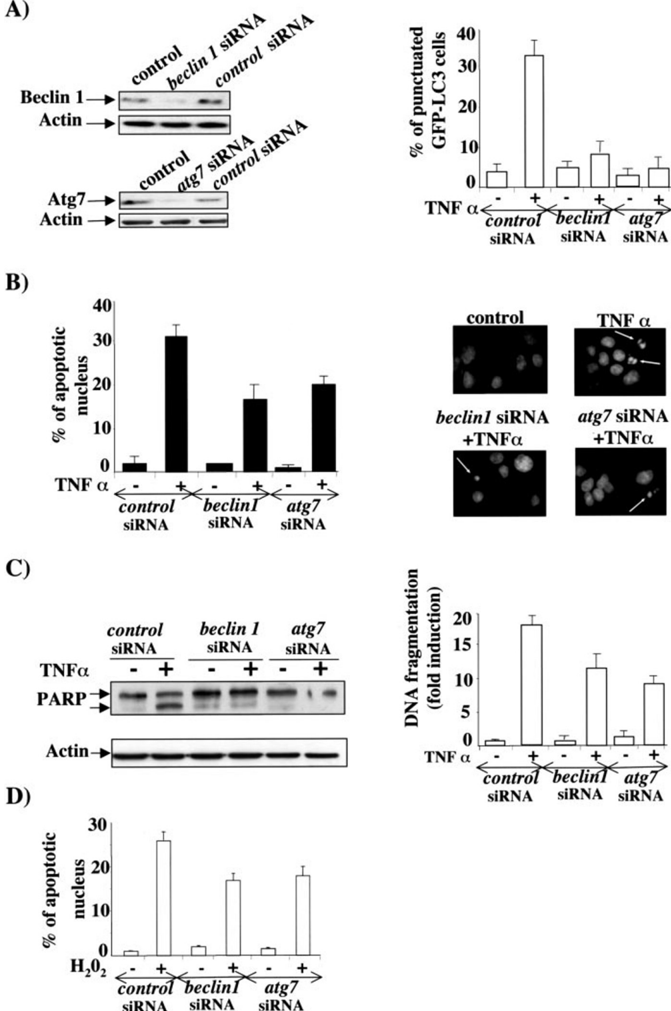
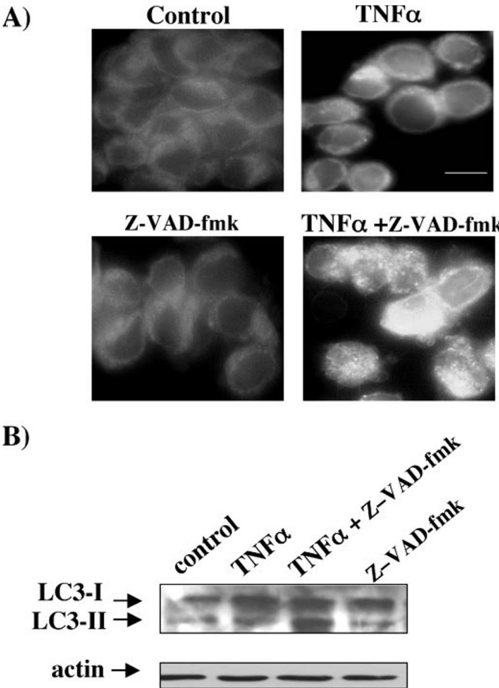
Verification
Claims the paper makes
The claims and statistics of this paper haven’t been checked yet.
Run the check — free, no account needed. It reads the open-access text and checks the sources it cites.
Claims other papers make about this one
Each is checked against this paper’s own text: does it say what the citing paper says it does?
In the citing paper
“there are instances in commonly used cancer cell lines and influenza A virus-infected cells in which MTOR appears to be a positive effector [764, 765].”
From Guidelines for the use and interpretation of assays for monitoring autophagy (4th edition) 1 (2021) · cites this paper as [764]
Self-check
Percentages, sums and reported differences re-computed from the paper’s own numbers.
The self-check needs the paper’s full text.
Citations
Cites
Induction of autophagy and inhibition of tumorigenesis by beclin 1
Liang, X. H., Jackson, S., Seaman, M., Brown, K., Kempkes, B., Hibshoosh, H., & Levine, B. (1999) · Nature · doi:10.1038/45257 · Cited by 3,347
The role of autophagy during the early neonatal starvation period
Kuma, A., Hatano, M., Matsui, M., Yamamoto, A., Nakaya, H., Yoshimori, T., Ohsumi, Y., Tokuhisa, T., & Mizushima, N. (2004) · Nature · doi:10.1038/nature03029 · Cited by 2,865
Molecular dissection of autophagy: two ubiquitin-like systems
Ohsumi, Y. (2001) · Nature Reviews Molecular Cell Biology · doi:10.1038/35056522 · Cited by 1,240
Kihara, A., Noda, T., Ishihara, N., & Ohsumi, Y. (2001) · The Journal of Cell Biology · doi:10.1083/jcb.152.3.519 · Cited by 1,004
Öllinger, K., & Roberg, K. (1997) · Journal of Biological Chemistry · doi:10.1074/jbc.272.38.23707 · Cited by 65
Research works printed but not linked: 57
- Mayo, 2000, Biochim. Biophys. Acta, 1470, M55
- Bharti, 2002, Biochem. Pharmacol., 64, 883, 10.1016/S0006-2952(02)01154-1 · DOI
- Luo, 2005, J. Clin. Invest., 115, 2625, 10.1172/JCI26322 · DOI
- Nakanishi, 2005, Nat. Rev. Cancer, 5, 297, 10.1038/nrc1588 · DOI
- Baeuerle, 1996, Cell, 87, 13, 10.1016/S0092-8674(00)81318-5 · DOI
- Karin, 2002, Nat. Immunol., 3, 221, 10.1038/ni0302-221 · DOI · Paper page
- Barkett, 1999, Oncogene, 18, 6910, 10.1038/sj.onc.1203238 · DOI
- Baldwin, 1996, Annu. Rev. Immunol., 14, 649, 10.1146/annurev.immunol.14.1.649 · DOI
- Bours, 1994, Biochem. Pharmacol., 47, 145, 10.1016/0006-2952(94)90448-0 · DOI
- Orlowski, 2002, Trends Mol. Med., 8, 385, 10.1016/S1471-4914(02)02375-4 · DOI
- Ogier-Denis, 2003, Biochim. Biophys. Acta, 1603, 113
- Alva, 2004, Cell Death Differ., 11, 1046, 10.1038/sj.cdd.4401445 · DOI
- Klionsky, 2000, Science, 290, 1717, 10.1126/science.290.5497.1717 · DOI
- Seglen, 1992, Experientia, 48, 158, 10.1007/BF01923509 · DOI
- Tsukada, 1993, FEBS Lett., 333, 169, 10.1016/0014-5793(93)80398-E · DOI
- Thumm, 1994, FEBS Lett., 349, 275, 10.1016/0014-5793(94)00672-5 · DOI
- Klionsky, 2003, Dev. Cell, 5, 539, 10.1016/S1534-5807(03)00296-X · DOI
- Kroemer, 2005, Nat. Rev. Cancer, 5, 886, 10.1038/nrc1738 · DOI
- Baehrecke, 2005, Nat. Rev. Mol. Cell. Biol., 6, 505, 10.1038/nrm1666 · DOI
- Lum, 2005, Cell, 120, 237, 10.1016/j.cell.2004.11.046 · DOI · Paper page
- Boya, 2005, Mol. Cell. Biol., 25, 1025, 10.1128/MCB.25.3.1025-1040.2005 · DOI
- Martin, 2004, Development, 131, 275, 10.1242/dev.00933 · DOI
- Kondo, 2005, Nat. Rev. Cancer, 5, 726, 10.1038/nrc1692 · DOI
- Jaattela, 2004, Oncogene, 23, 2746, 10.1038/sj.onc.1207513 · DOI
- Mills, 2004, Proc. Natl. Acad. Sci. U. S. A., 101, 3438, 10.1073/pnas.0400443101 · DOI
- Jia, 1997, Br. J. Haematol., 98, 673, 10.1046/j.1365-2141.1997.2623081.x · DOI
- Lemasters, 1998, Biochim. Biophys. Acta, 1366, 177, 10.1016/S0005-2728(98)00112-1 · DOI · Paper page
- Yu, 2004, Science, 304, 1500, 10.1126/science.1096645 · DOI
- Pyo, 2005, J. Biol. Chem., 280, 20722, 10.1074/jbc.M413934200 · DOI
- Javelaud, 2000, Oncogene, 19, 61, 10.1038/sj.onc.1203246 · DOI
- Mathieu, 2005, Oncogene, 24, 7145, 10.1038/sj.onc.1208889 · DOI
- Biederbick, 1995, Eur. J. Cell Biol., 66, 3
- Pattingre, 2004, Methods Enzymol., 390, 17, 10.1016/S0076-6879(04)90002-X · DOI · Paper page
- Lavieu, 2006, J. Biol. Chem., 281, 8518, 10.1074/jbc.M506182200 · DOI · Paper page
- Zhou, 2003, Oncogene, 22, 2054, 10.1038/sj.onc.1206262 · DOI
- Kabeya, 2004, J. Cell Sci., 117, 2805, 10.1242/jcs.01131 · DOI · Paper page
- Djavaheri-Mergny, 2004, FEBS Lett., 578, 111, 10.1016/j.febslet.2004.10.082 · DOI
- Blommaart, 1995, J. Biol. Chem., 270, 2320, 10.1074/jbc.270.5.2320 · DOI · Paper page
- Noda, 1998, J. Biol. Chem., 273, 3963, 10.1074/jbc.273.7.3963 · DOI
- Pattingre, 2005, Cell, 122, 927, 10.1016/j.cell.2005.07.002 · DOI · Paper page
- Kucharczak, 2003, Oncogene, 22, 8961, 10.1038/sj.onc.1207230 · DOI
- Chen, 2000, Mol. Cell. Biol., 20, 2687, 10.1128/MCB.20.8.2687-2695.2000 · DOI
- Sakon, 2003, EMBO J., 22, 3898, 10.1093/emboj/cdg379 · DOI · Paper page
- Kamata, 2005, Cell, 120, 649, 10.1016/j.cell.2004.12.041 · DOI · Paper page
- Iwanaga, 1998, Free Radic. Biol. Med., 24, 1256, 10.1016/S0891-5849(97)00443-7 · DOI
- Bernard, 2002, Oncogene, 21, 4392, 10.1038/sj.onc.1205536 · DOI
- Brouard, 2002, J. Biol. Chem., 277, 17950, 10.1074/jbc.M108317200 · DOI · Paper page
- Pham, 2004, Cell, 119, 529, 10.1016/j.cell.2004.10.017 · DOI · Paper page
- Clarke, 1990, Anat. Embryol. (Berl.), 181, 195, 10.1007/BF00174615 · DOI · Paper page
- Lockshin, 2004, Oncogene, 23, 2766, 10.1038/sj.onc.1207514 · DOI
- Levine, 2005, J. Clin. Invest., 115, 2679, 10.1172/JCI26390 · DOI
- Gomez-Santos, 2003, J. Neurosci. Res., 73, 341, 10.1002/jnr.10663 · DOI
- Xue, 2001, Curr. Biol., 11, 361, 10.1016/S0960-9822(01)00100-2 · DOI
- Zheng, 2005, Neurosci. Lett, 394, 184, 10.1016/j.neulet.2005.10.035 · DOI
- Tomas-Zapico, 2005, FASEB J., 19, 2066, 10.1096/fj.04-3595fje · DOI
- Saeki, 2000, Cell Death Differ., 7, 1263, 10.1038/sj.cdd.4400759 · DOI
- Xu, 2006, J. Biol. Chem., 281, 19179, 10.1074/jbc.M513377200 · DOI
Cited by
Sorted by citations
Guidelines for the use and interpretation of assays for monitoring autophagy (3rd edition).
Klionsky, D. J., Abdelmohsen, K., Abe, A., Abedin, M. J., Abeliovich, H., Acevedo Arozena, A., Adachi, H., Adams, C. M., Adams, P. D., Adeli, K., et al. (2016) · Autophagy · doi:10.1080/15548627.2015.1100356 · Cited by 5,894
Self-citationGuidelines for the use and interpretation of assays for monitoring autophagy
Klionsky, D. J., Abdalla, F. C., Abeliovich, H., Abraham, R. T., Acevedo-Arozena, A., Adeli, K., Agholme, L., Agnello, M., Agostinis, P., Aguirre-Ghiso, J. A., et al. (2012) · Autophagy · doi:10.4161/auto.19496 · Cited by 3,996
Self-citationGuidelines for the use and interpretation of assays for monitoring autophagy (4th edition) 1
Klionsky, D. J., Abdel-Aziz, A. K., Abdelfatah, S., Abdellatif, M., Abdoli, A., Abel, S., Abeliovich, H., Abildgaard, M. H., Abudu, Y. P., Acevedo-Arozena, A., et al. (2021) · Autophagy · doi:10.1080/15548627.2020.1797280 · Cited by 2,897
Self-citationEndoplasmic reticulum stress and the inflammatory basis of metabolic disease
Hotamisligil, G. S. (2010) · Cell · doi:10.1016/j.cell.2010.02.034 · Cited by 2,802
Reactive Oxygen Species in Metabolic and Inflammatory Signaling
Forrester, S. J., Kikuchi, D. S., Hernandes, M. S., Xu, Q., & Griendling, K. K. (2018) · Circulation Research · doi:10.1161/circresaha.117.311401 · Cited by 2,081
Autophagy, mitochondria and oxidative stress: cross-talk and redox signalling.
Lee, J., Giordano, S., & Zhang, J. (2012) · Biochemical Journal · doi:10.1042/bj20111451 · Cited by 1,438
Regulation of autophagy by ROS: physiology and pathology
Scherz-Shouval, R., & Elazar, Z. (2011) · Trends in Biochemical Sciences · doi:10.1016/j.tibs.2010.07.007 · Cited by 1,263
ROS, mitochondria and the regulation of autophagy
Scherz-Shouval, R., & Elazar, Z. (2007) · Trends in Cell Biology · doi:10.1016/j.tcb.2007.07.009 · Cited by 954
The Role of Autophagy in the Heart
Sciarretta, S., Maejima, Y., Zablocki, D., & Sadoshima, J. (2018) · Annual Review of Physiology · doi:10.1146/annurev-physiol-021317-121427 · Cited by 547
Interplay between ROS and autophagy in cancer cells, from tumor initiation to cancer therapy
Poillet-Perez, L., Despouy, G., Delage-Mourroux, R., & Boyer-Guittaut, M. (2015) · Redox Biology · doi:10.1016/j.redox.2014.12.003 · Cited by 503
Chakraborty, S., Kaur, S., Guha, S., & Batra, S. K. (2012) · Biochimica et Biophysica Acta (BBA) - Reviews on Cancer · doi:10.1016/j.bbcan.2012.03.008 · Cited by 503
Egr-1 Regulates Autophagy in Cigarette Smoke-Induced Chronic Obstructive Pulmonary Disease
Chen, Z.-H., Kim, H. P., Sciurba, F. C., Lee, S.-J., Feghali-Bostwick, C., Stolz, D. B., Dhir, R., Landreneau, R. J., Schuchert, M. J., Yousem, S. A., et al. (2008) · PLoS ONE · doi:10.1371/journal.pone.0003316 · Cited by 459
Regulation of the aging process by autophagy.
Salminen, A., & Kaarniranta, K. (2009) · Trends in Molecular Medicine · doi:10.1016/j.molmed.2009.03.004 · Cited by 270
Chloroquine reduces osteoclastogenesis in murine osteoporosis by preventing TRAF3 degradation
Xiu, Y., Xu, H., Zhao, C., Li, J., Morita, Y., Yao, Z., Xing, L., & Boyce, B. F. (2014) · Journal of Clinical Investigation · doi:10.1172/jci66947 · Cited by 164
p53 isoforms regulate aging- and tumor-associated replicative senescence in T lymphocytes
Mondal, A. M., Horikawa, I., Pine, S. R., Fujita, K., Morgan, K. M., Vera, E., Mazur, S. J., Appella, E., Vojtesek, B., Blasco, M. A., et al. (2013) · Journal of Clinical Investigation · doi:10.1172/jci70355 · Cited by 164
The Decline of Autophagy Contributes to Proximal Tubular Dysfunction During Sepsis
Hsiao, H.-W., Tsai, K.-L., Wang, L.-F., Chen, Y.-H., Chiang, P.-C., Chuang, S.-M., & Hsu, C. (2012) · Shock · doi:10.1097/shk.0b013e318240b52a · Cited by 151
Regulation of the autophagic machinery in human neutrophils
Mitroulis, I., Kourtzelis, I., Kambas, K., Rafail, S., Chrysanthopoulou, A., Speletas, M., & Ritis, K. (2010) · European Journal of Immunology · doi:10.1002/eji.200940025 · Cited by 132
Autophagy in Locomotor Muscles of Patients with Chronic Obstructive Pulmonary Disease
Guo, Y., Gosker, H. R., Schols, A. M. W. J., Kapchinsky, S., Bourbeau, J., Sandri, M., Jagoe, R. T., Debigaré, R., Maltais, F., Taivassalo, T., et al. (2013) · American Journal of Respiratory and Critical Care Medicine · doi:10.1164/rccm.201304-0732oc · Cited by 117
Innate immunity to mycobacteria: vitamin D and autophagy
Jo, E.-K. (2010) · Cellular Microbiology · doi:10.1111/j.1462-5822.2010.01491.x · Cited by 98
Wang, M., Hossain, M. S., Tan, W., Coolman, B., Zhou, J., Liu, S., & Casey, P. J. (2010) · Oncogene · doi:10.1038/onc.2010.247 · Cited by 75
Beauvarlet, J., Bensadoun, P., Darbo, E., Labrunie, G., Rousseau, B., Richard, E., Draskovic, I., Londono-Vallejo, A., Dupuy, J.-W., Nath Das, R., et al. (2019) · Nucleic Acids Research · doi:10.1093/nar/gkz095 · Cited by 73
Self-citationMitigation of ALS Pathology by Neuron-Specific Inhibition of Nuclear Factor Kappa B Signaling
Dutta, K., Thammisetty, S. S., Boutej, H., Bareil, C., & Julien, J.-P. (2020) · The Journal of Neuroscience · doi:10.1523/jneurosci.0536-20.2020 · Cited by 55
Tateosian, N. L., Pellegrini, J. M., Amiano, N. O., Rolandelli, A., Casco, N., Palmero, D. J., Colombo, M. I., & García, V. E. (2017) · Autophagy · doi:10.1080/15548627.2017.1320636 · Cited by 45
Transcription factors and cognate signalling cascades in the regulation of autophagy
Chandra, V., Bhagyaraj, E., Parkesh, R., & Gupta, P. (2016) · Biological Reviews · doi:10.1111/brv.12177 · Cited by 26
Metadata
- Authors
- Djavaheri-Mergny, M., Amelotti, M., Mathieu, J., Besançon, F., Bauvy, C., Souquère, S., Pierron, G., & Codogno, P.
- Venue
- Journal of Biological Chemistry
- Publisher
- Elsevier BV
- Published
- 2006-10
- Volume
- 281
- Issue
- 41
- Pages
- 30373-30382
- ISSN
- 0021-9258
- Cited by
- 407
- References
- 5
- Language
- en
About these checks
Registry, retraction, Cites and statistics results are computed, not judged, with one exception: a printed reference that no index lists is read once by a model before it counts as a citation error. Claims are extracted by a model and kept only when their quote appears verbatim in the text; each cited source is then checked, with a model’s help, for whether it says what the claim relies on. Those verdicts can be wrong — read the claim’s quote and the cited source before relying on one.
Statistics and arithmetic are recomputed, not judged.
Confidence bands are shown only for fields calibrated on our annotated test set. None is calibrated yet, so no band is shown.
What counts as a claim ›How we measure confidence ›How we check this ›
Are you an author, or do you see a problem with this page? Request a review
