

Tracking and Elucidating Alphavirus-Host Protein Interactions
Open accessThe DOI matches its Crossref record; 45 of the 45 references it cites were found in a registry or an index.
Abstract
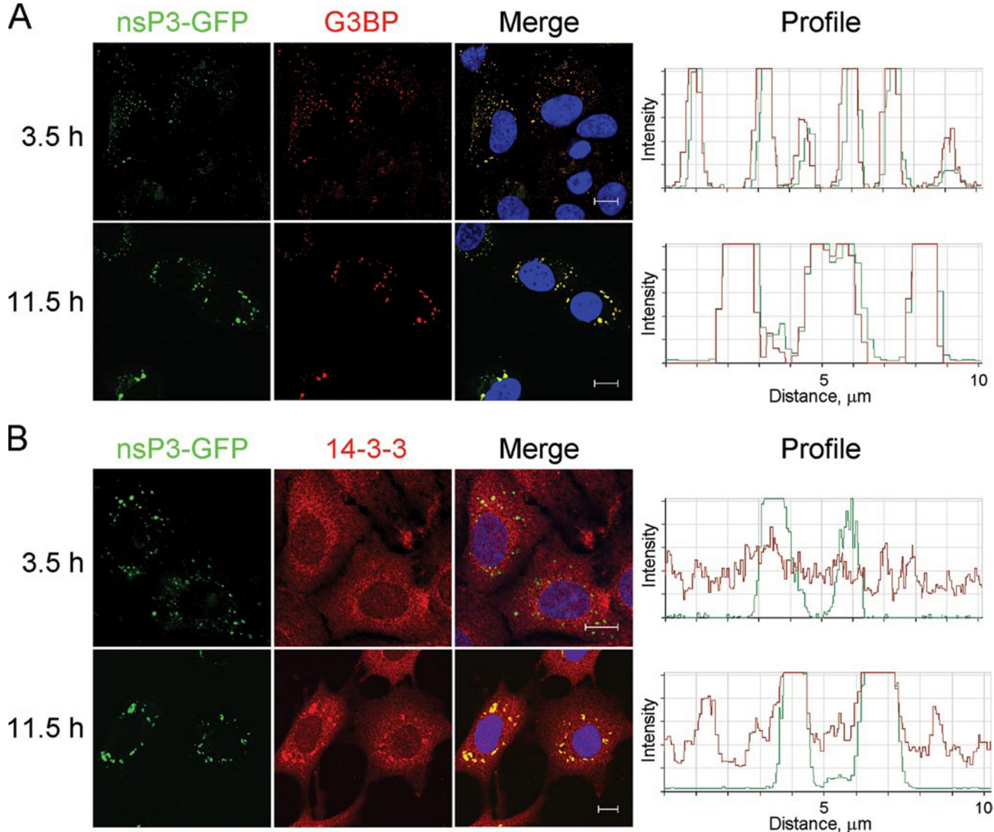
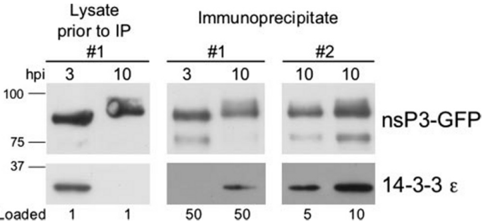
Viral infections cause profound alterations in host cells. Here, we explore the interactions between proteins of the Alphavirus Sindbis and host factors during the course of mammalian cell infection. Using a mutant virus expressing the viral nsP3 protein tagged with green fluorescent protein (GFP) we directly observed nsP3 localization and isolated nsP3-interacting proteins at various times after infection. These results revealed that host factor recruitment to nsP3-containing complexes was time dependent, with a specific early and persistent recruitment of G3BP and a later recruitment of 14-3-3 proteins. Expression of GFP-tagged G3BP allowed reciprocal isolation of nsP3 in Sindbis infected cells, as well as the identification of novel G3BP-interacting proteins in both uninfected and infected cells. Note-worthy interactions include nuclear pore complex components whose interactions with G3BP were reduced upon Sindbis infection. This suggests that G3BP is a nuclear transport factor, as hypothesized previously, and that viral infection may alter RNA transport. Immunoelectron microscopy showed that a portion of Sindbis nsP3 is localized at the nuclear envelope, suggesting a possible site of G3BP recruitment to nsP3-containing complexes. Our results demonstrate the utility of using a standard GFP tag to both track viral protein localization and elucidate specific viral-host interactions over time in infected mammalian cells.
Overview
The claims and statistics of this paper haven’t been checked yet.
Free: it reads the open-access text and checks the first 5 claims that cite a source we can check. Create a free account to check every claim.
Integrity signals
Registry
Cites
Statistics
Figures






Verification
Claims the paper makes
The claims and statistics of this paper haven’t been checked yet.
Free: it reads the open-access text and checks the first 5 claims that cite a source we can check. Create a free account to check every claim.
Claims other papers make about this one
Each is checked against this paper’s own text: does it say what the citing paper says it does?
The source backs part of the claim, not all of it — or backs it for a different population, condition or comparison.
In the citing paper
“Further advancements introduced through this AP-MS strategy were cryogenic cell lysis of infected cells and fast isolations on magnetic beads, which helped preserve complexes close to their original state in the cell, maximized viral bait isolation, and reduced nonspecific interactions (38).”
From The Impact of Mass Spectrometry–Based Proteomics on Fundamental Discoveries in Virology (2014) · cites this paper as [38]
Experimental — accuracy not yet measuredThe source backs part of the claim, not all of it — or backs it for a different population, condition or comparison.
In the citing paper
“this strategy was shown to help preserve protein complexes and weak protein interactions [24,25].”
From Proteomic approaches to uncovering virus–host protein interactions during the progression of viral infection (2016) · cites this paper as [24]
Experimental — accuracy not yet measuredIn the citing paper
“it was not until the use of fluorescent probes for AP by Cristea and coworkers (37) that the applicability of AP-MS was demonstrated for the isolation of protein complexes at different stages of a viral infection (38).”
From The Impact of Mass Spectrometry–Based Proteomics on Fundamental Discoveries in Virology (2014) · cites this paper as [38]
In the citing paper
“This study led to the discovery of time-specific interactions, with the early and stable recruitment of an endoribonuclease (G3BP), identified at all time points assessed, and the later recruitment of signaling proteins (14-3-3), identified only at the late 6, 8, and 10 hpi time points in the SINV life cycle.”
From Proteomic approaches to uncovering virus–host protein interactions during the progression of viral infection (2016) · cites this paper as [24]
In the citing paper
“While some viral proteins can be tagged at their C- or N-termini (e.g. [86]), others may require the inclusion of the tag within an internal loop (e.g. [24]).”
From Proteomic approaches to uncovering virus–host protein interactions during the progression of viral infection (2016) · cites this paper as [24]
Self-check
Percentages, sums and reported differences re-computed from the paper’s own numbers.
The self-check needs the paper’s full text.
Citations
Cites
1 retracted
RETRACTED: The RasGAP-associated endoribonuclease G3BP assembles stress granules
Tourrière, H., Chebli, K., Zekri, L., Courselaud, B., Blanchard, J. M., Bertrand, E., & Tazi, J. (2003) · The Journal of Cell Biology · doi:10.1083/jcb.200212128 · Cited by 834
RetractedAntibodies, a laboratory manual
(1989) · Biomedicine & Pharmacotherapy · doi:10.1016/0753-3322(89)90130-3 · Cited by 12,366
Antibodies: A laboratory manual
J.L. (1989) · Trends in Biochemical Sciences · doi:10.1016/0968-0004(89)90307-1 · Cited by 5,089
A monomeric red fluorescent protein
Campbell, R. E., Tour, O., Palmer, A. E., Steinbach, P. A., Baird, G. S., Zacharias, D. A., & Tsien, R. Y. (2002) · Proceedings of the National Academy of Sciences · doi:10.1073/pnas.082243699 · Cited by 2,365
The alphaviruses: gene expression, replication, and evolution.
Strauss, J. H., & Strauss, E. G. (1994) · Microbiological Reviews · doi:10.1128/mmbr.58.3.491-562.1994 · Cited by 2,221
Proteomic analysis of the mammalian nuclear pore complex
Cronshaw, J. M., Krutchinsky, A. N., Zhang, W., Chait, B. T., & Matunis, M. J. (2002) · The Journal of Cell Biology · doi:10.1083/jcb.200206106 · Cited by 966
Self-citationDynamic interactions between 14-3-3 proteins and phosphoproteins regulate diverse cellular processes
MACKINTOSH, C. (2004) · Biochemical Journal · doi:10.1042/bj20031332 · Cited by 526
Application of cryoultramicrotomy to immunocytochemistry
Tokuyasu, K. T. (1986) · Journal of Microscopy · doi:10.1111/j.1365-2818.1986.tb02772.x · Cited by 512
Rice, C. M., Levis, R., Strauss, J. H., & Huang, H. V. (1987) · Journal of Virology · doi:10.1128/jvi.61.12.3809-3819.1987 · Cited by 474
Self-citationMK2‐induced tristetraprolin:14‐3‐3 complexes prevent stress granule association and ARE‐mRNA decay
Stoecklin, G., Stubbs, T., Kedersha, N., Wax, S., Rigby, W. F., Blackwell, T. K., & Anderson, P. (2004) · The EMBO Journal · doi:10.1038/sj.emboj.7600163 · Cited by 448
Suntharalingam, M., & Wente, S. R. (2003) · Developmental Cell · doi:10.1016/s1534-5807(03)00162-x · Cited by 410
Alphavirus RNA replicase is located on the cytoplasmic surface of endosomes and lysosomes.
Froshauer, S., Kartenbeck, J., & Helenius, A. (1988) · The Journal of cell biology · doi:10.1083/jcb.107.6.2075 · Cited by 396
Expression of the Zinc-Finger Antiviral Protein Inhibits Alphavirus Replication
Bick, M. J., Carroll, J.-W. N., Gao, G., Goff, S. P., Rice, C. M., & MacDonald, M. R. (2003) · Journal of Virology · doi:10.1128/jvi.77.21.11555-11562.2003 · Cited by 384
Self-citationAnderson, P., & Kedersha, N. (2002) · Journal of Cell Science · doi:10.1242/jcs.115.16.3227 · Cited by 375
Importance of eIF2α Phosphorylation and Stress Granule Assembly in Alphavirus Translation Regulation
McInerney, G. M., Kedersha, N. L., Kaufman, R. J., Anderson, P., & Liljeström, P. (2005) · Molecular Biology of the Cell · doi:10.1091/mbc.e05-02-0124 · Cited by 270
Biogenesis of the Semliki Forest Virus RNA Replication Complex
Kujala, P., Ikäheimonen, A., Ehsani, N., Vihinen, H., Auvinen, P., & Kääriäinen, L. (2001) · Journal of Virology · doi:10.1128/jvi.75.8.3873-3884.2001 · Cited by 252
Fluorescent Proteins as Proteomic Probes
Cristea, I. M., Williams, R., Chait, B. T., & Rout, M. P. (2005) · Molecular & Cellular Proteomics · doi:10.1074/mcp.m500227-mcp200 · Cited by 251
Self-citationFrolova, E. I., Fayzulin, R. Z., Cook, S. H., Griffin, D. E., Rice, C. M., & Frolov, I. (2002) · Journal of Virology · doi:10.1128/jvi.76.22.11254-11264.2002 · Cited by 245
Self-citationGrimley, P. M., Berezesky, I. K., & Friedman, R. M. (1968) · Journal of Virology · doi:10.1128/jvi.2.11.1326-1338.1968 · Cited by 218
A Ras-GTPase-Activating Protein SH3-Domain-Binding Protein
Parker, F., Maurier, F., Delumeau, I., Duchesne, M., Faucher, D., Debussche, L., Dugue, A., Schweighoffer, F., & Tocque, B. (1996) · Molecular and Cellular Biology · doi:10.1128/mcb.16.6.2561 · Cited by 216
Griffiths, G., Simons, K., Warren, G., & Tokuyasu, K. T. (1983) · Methods in Enzymology · doi:10.1016/s0076-6879(83)96041-x · Cited by 212
Tourrière, H., Gallouzi, I.-E., Chebli, K., Capony, J. P., Mouaikel, J., van der Geer, P., & Tazi, J. (2001) · Molecular and Cellular Biology · doi:10.1128/mcb.21.22.7747-7760.2001 · Cited by 207
Gallouzi, I.-E., Parker, F., Chebli, K., Maurier, F., Labourier, E., Barlat, I., Capony, J.-P., Tocque, B., & Tazi, J. (1998) · Molecular and Cellular Biology · doi:10.1128/mcb.18.7.3956 · Cited by 199
Post‐transcriptional regulation of gene expression by mitogen‐activated protein kinase p38
Clark, A. R., Dean, J. L. E., & Saklatvala, J. (2003) · FEBS Letters · doi:10.1016/s0014-5793(03)00439-3 · Cited by 196
Soncini, C., Berdo, I., & Draetta, G. (2001) · Oncogene · doi:10.1038/sj.onc.1204553 · Cited by 178
Rasputin, more promiscuous than ever: a review of G3BP
Irvine, K., Stirling, R., Hume, D., & Kennedy, D. (2004) · The International Journal of Developmental Biology · doi:10.1387/ijdb.041893ki · Cited by 148
Salonen, A., Vasiljeva, L., Merits, A., Magden, J., Jokitalo, E., & Kääriäinen, L. (2003) · Journal of Virology · doi:10.1128/jvi.77.3.1691-1702.2003 · Cited by 145
Association of Sindbis virion glycoproteins and their precursors
Rice, C. M., & Strauss, J. H. (1982) · Journal of Molecular Biology · doi:10.1016/0022-2836(82)90067-5 · Cited by 144
Self-citationFormation of nsP3-Specific Protein Complexes during Sindbis Virus Replication
Frolova, E., Gorchakov, R., Garmashova, N., Atasheva, S., Vergara, L. A., & Frolov, I. (2006) · Journal of Virology · doi:10.1128/jvi.80.8.4122-4134.2006 · Cited by 144
Solubilization and immunoprecipitation of alphavirus replication complexes
Barton, D. J., Sawicki, S. G., & Sawicki, D. L. (1991) · Journal of Virology · doi:10.1128/jvi.65.3.1496-1506.1991 · Cited by 142
Functions of alphavirus nonstructural proteins in RNA replication
(2002) · Progress in Nucleic Acid Research and Molecular Biology · doi:10.1016/s0079-6603(02)71044-1 · Cited by 137
Targeted Proteomic Study of the Cyclin-Cdk Module
Archambault, V., Chang, E. J., Drapkin, B. J., Cross, F. R., Chait, B. T., & Rout, M. P. (2004) · Molecular Cell · doi:10.1016/j.molcel.2004.05.025 · Cited by 123
Self-citationProteomics techniques and their application to hematology
Cristea, I. M., Gaskell, S. J., & Whetton, A. D. (2004) · Blood · doi:10.1182/blood-2003-09-3295 · Cited by 122
Self-citationPrigent, M., Barlat, I., Langen, H., & Dargemont, C. (2000) · Journal of Biological Chemistry · doi:10.1074/jbc.m004751200 · Cited by 115
Phosphorylation of sindbis virus nsP3 in vivo and in vitro
Li, G., Lastarza, M. W., Hardy, W. R., Strauss, J. H., & Rice, C. M. (1990) · Virology · doi:10.1016/0042-6822(90)90310-n · Cited by 110
Self-citationChambers, T. J., McCourt, D. W., & Rice, C. M. (1989) · Virology · doi:10.1016/0042-6822(89)90045-7 · Cited by 101
Self-citationHeterogeneous nuclear ribonucleoprotein A1 regulates RNA synthesis of a cytoplasmic virus
Shi, S. T., Huang, P., Li, H., & Lai, M. M. C. (2000) · The EMBO Journal · doi:10.1093/emboj/19.17.4701 · Cited by 96
Lastarza, M. W., Grakoui, A., & Rice, C. M. (1994) · Virology · doi:10.1006/viro.1994.1338 · Cited by 91
Self-citationPrediction of structural domains of TAP reveals details of its interaction with p15 and nucleoporins
Suyama, M., Doerks, T., Kos‐Braun, I. C., Sattler, M., Izaurralde, E., & Bork, P. (2000) · EMBO Reports · doi:10.1093/embo-reports/kvd009 · Cited by 88
Katsafanas, G. C., & Moss, B. (2004) · Journal of Biological Chemistry · doi:10.1074/jbc.m411033200 · Cited by 82
Biogenesis of type I cytopathic vacuoles in Semliki Forest virus-infected BHK cells
Peränen, J., & Kääriäinen, L. (1991) · Journal of Virology · doi:10.1128/jvi.65.3.1623-1627.1991 · Cited by 70
Wright, C. F., Oswald, B. W., & Dellis, S. (2001) · Journal of Biological Chemistry · doi:10.1074/jbc.m102399200 · Cited by 65
Shi, S. T., Yu, G.-Y., & Lai, M. M. C. (2003) · Journal of Virology · doi:10.1128/jvi.77.19.10584-10593.2003 · Cited by 54
Choi, K. S., Mizutani, A., & Lai, M. M. C. (2004) · Journal of Virology · doi:10.1128/jvi.78.23.13153-13162.2004 · Cited by 52
Nakatsue, T., Katoh, I., Nakamura, S., Takahashi, Y., Ikawa, Y., & Yoshinaka, Y. (1998) · Biochemical and Biophysical Research Communications · doi:10.1006/bbrc.1998.9724 · Cited by 45
Research works printed but not linked: 2
- Liang, 2005, Gene Ther. Mol. Biol., 9, 317
- Kennedy, 1997, Biomed. Pept. Proteins Nucleic Acids, 2, 93
Cited by
Determining the architectures of macromolecular assemblies
Alber, F., Dokudovskaya, S., Veenhoff, L. M., Zhang, W., Kipper, J., Devos, D., Suprapto, A., Karni-Schmidt, O., Williams, R., Chait, B. T., et al. (2007) · Nature · doi:10.1038/nature06404 · Cited by 524
Self-citationAlphavirus RNA synthesis and non-structural protein functions
Rupp, J. C., Sokoloski, K. J., Gebhart, N. N., & Hardy, R. W. (2015) · Journal of General Virology · doi:10.1099/jgv.0.000249 · Cited by 285
“Immunoprecipitation of SINV nsP3 from infected cells has revealed numerous interactions with host factors, most notably perhaps with the cellular G3BP proteins (Cristea et al., 2006, 2010; Frolova et al., 2006; Scholte et al., 2015).”
BackgroundToward the dynamic interactome: it's about time
Przytycka, T. M., Singh, M., & Slonim, D. K. (2010) · Briefings in Bioinformatics · doi:10.1093/bib/bbp057 · Cited by 254
Magnetic separations in biotechnology
Borlido, L., Azevedo, A. M., Roque, A. C. A., & Aires-Barros, M. R. (2013) · Biotechnology Advances · doi:10.1016/j.biotechadv.2013.05.009 · Cited by 235
Jean Beltran, P. M., Federspiel, J. D., Sheng, X., & Cristea, I. M. (2017) · Molecular Systems Biology · doi:10.15252/msb.20167062 · Cited by 212
“Initially demonstrated for studying the RNA virus Sindbis (Cristea et al , 2006), this approach was later applied to other viruses, such as the RNA virus respiratory syncytial virus (Wu et al , 2012) and the DNA viruses human cyto-megalovirus (HCMV) and pseudorabies virus (PRV) (Moorman et al ,…”
Self-citation
Metadata
- Authors
- Cristea, I. M., Carroll, J.-W. N., Rout, M. P., Rice, C. M., Chait, B. T., & MacDonald, M. R.
- Affiliations
- Rockefeller University (US)
- Corresponding author
- Chait, Brian T.
- MacDonald, Margaret R.
- Venue
- Journal of Biological Chemistry
- Publisher
- Elsevier BV
- Published
- 2006-10
- Volume
- 281
- Issue
- 40
- Pages
- 30269-30278
- ISSN
- 0021-9258 (ISSN-L)
- OpenAlex
- W2100002560
- Cited by
- 192
- References
- 45
- Citations by year
- 2026: 4 · 2025: 5 · 2024: 8 · 2023: 7 · 2022: 11 · 2021: 11 · 2020: 5 · 2019: 9 · 2018: 13 · 2017: 12 · 2016: 12 · 2015: 15 · 2014: 13 · 2013: 13 · 2012: 14
- FWCI
- 8.02
- Type
- journal article
- Language
- en
- Open access
- hybrid
- doi.org
- Licence
- cc-by
- www.elsevier.com/tdm/userlicense/1.0/ (tdm)
- creativecommons.org/licenses/by/4.0/ (vor, 5115 d)
- Locations
- Journal of Biological Chemistry (publishedVersion, cc-by)
- PubMed (publishedVersion)
- Funders
- Greenberg Medical Research Institute
- National Institutes of Health (RR00862, RR022220)
- National Institute of General Medical Sciences (R01GM062427, GM062427)
- National Institute of Allergy and Infectious Diseases (AI063233, R01AI063233, AI 24134)
- National Center for Research Resources (RR00862, P41RR000862, RR 022220, U54RR022220)
- Topics
- Health Sciences › Medicine › Public Health, Environmental and Occupational Health › Mosquito-borne diseases and control
- Health Sciences › Medicine › Epidemiology › Virology and Viral Diseases
- Health Sciences › Medicine › Infectious Diseases › Viral Infections and Vectors
- Keywords
- Sindbis virus, alphavirus, host-virus protein interaction, NSP3, G3BP, 14-3-3 proteins, nuclear pore complex, nuclear transport, RNA transport, viral protein localization, GFP tagging, nuclear envelope
- MeSH terms
- Animals, Cell Line, Fibroblasts, Humans, Sindbis Virus, Viral Nonstructural Proteins, Protein Interaction Mapping, Rats
About these checks
Registry, retraction, Cites and statistics results are computed, not judged, with one exception: a printed reference that no index lists is read once by a model before it counts as a citation error. Claims are extracted by a model and kept only when their quote appears verbatim in the text; each cited source is then checked, with a model’s help, for whether it says what the claim relies on. Those verdicts can be wrong — read the claim’s quote and the cited source before relying on one.
Statistics and arithmetic are recomputed, not judged.
Confidence bands are shown only for fields calibrated on our annotated test set. None is calibrated yet, so no band is shown.
What counts as a claim ›How we measure confidence ›How we check this ›
Are you an author, or do you see a problem with this page? Request a review
Data sources
Bibliographic data: Semantic Scholar, OpenAlex, Crossref.
Contains information from the Semantic Scholar Academic Graph Datasets, made available under the ODC Attribution License (ODC-BY 1.0).
Semantic Scholar’s data is described in: Kinney, R., et al. (2023). The Semantic Scholar Open Data Platform. arXiv:2301.10140.
