

The DOI matches its Crossref record; 72 of the 73 references it cites were found in a registry or an index.
Defective autophagy in vascular smooth muscle cells accelerates senescence and promotes neointima formation and atherogenesis
Open accessAbstract
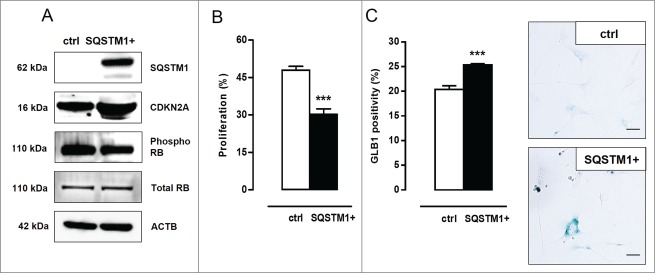
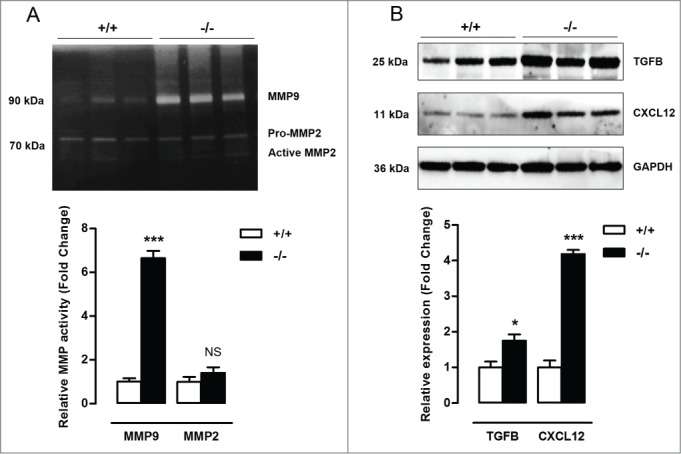
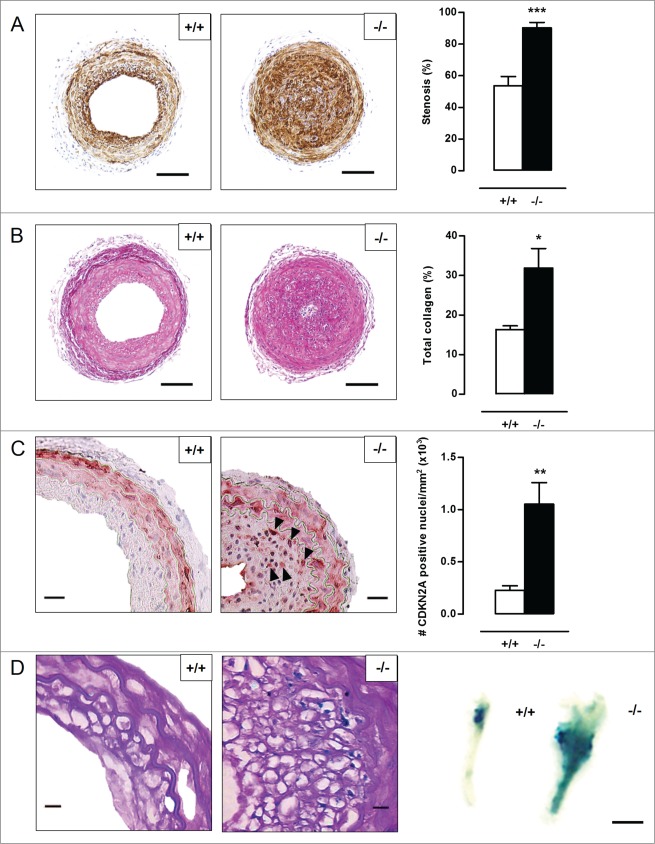
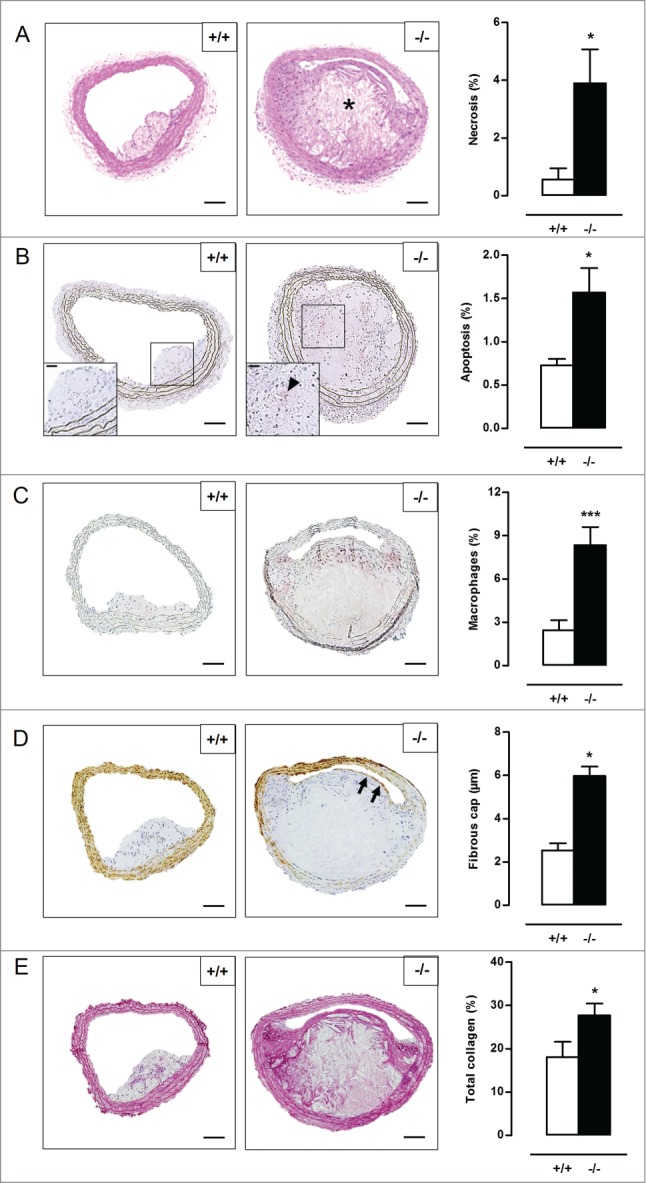
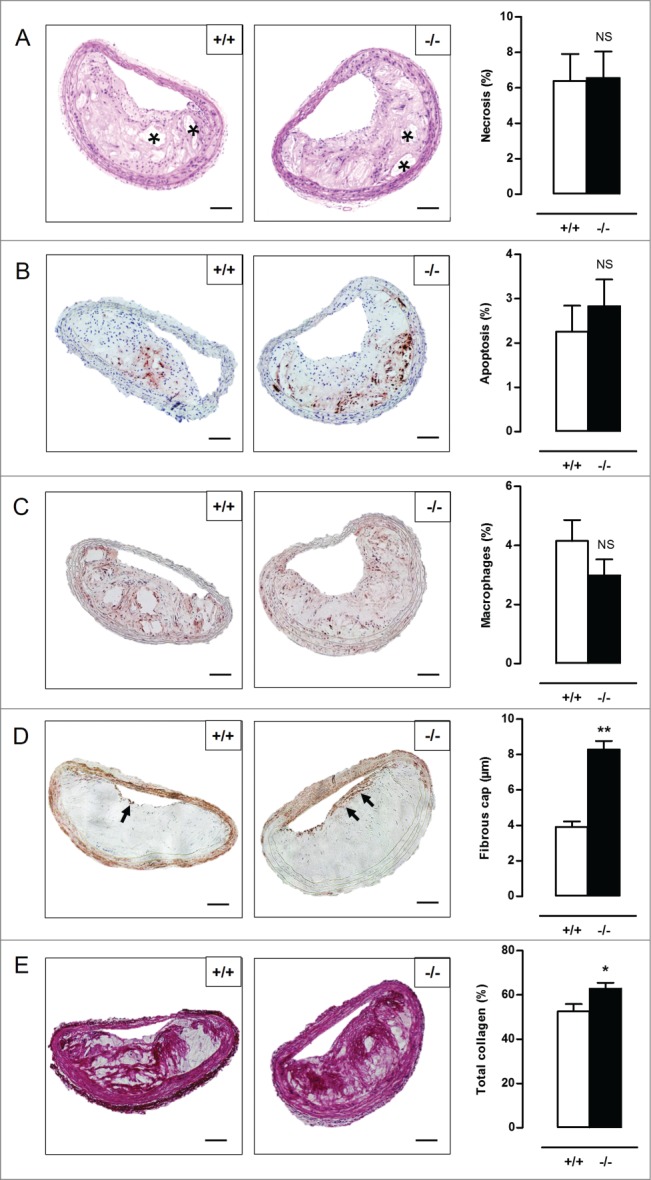
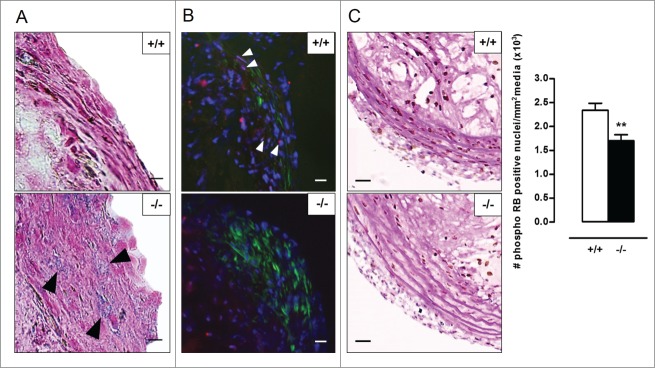
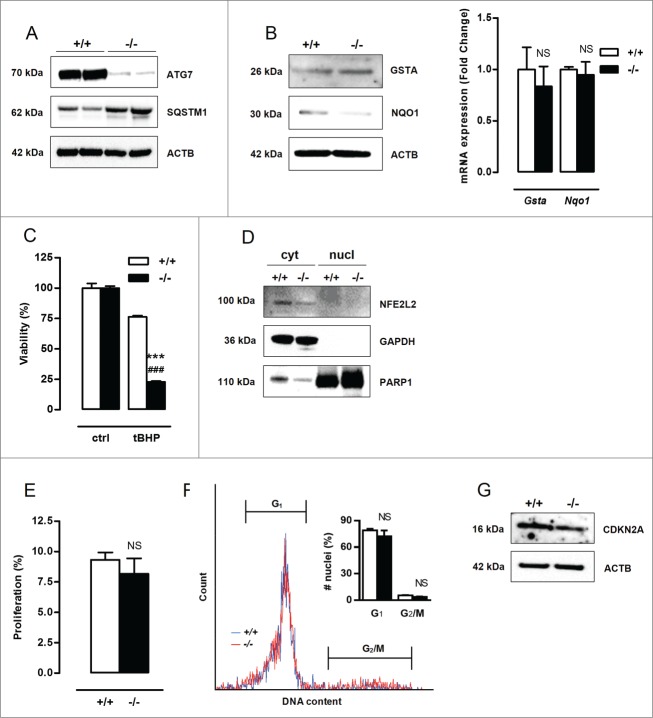
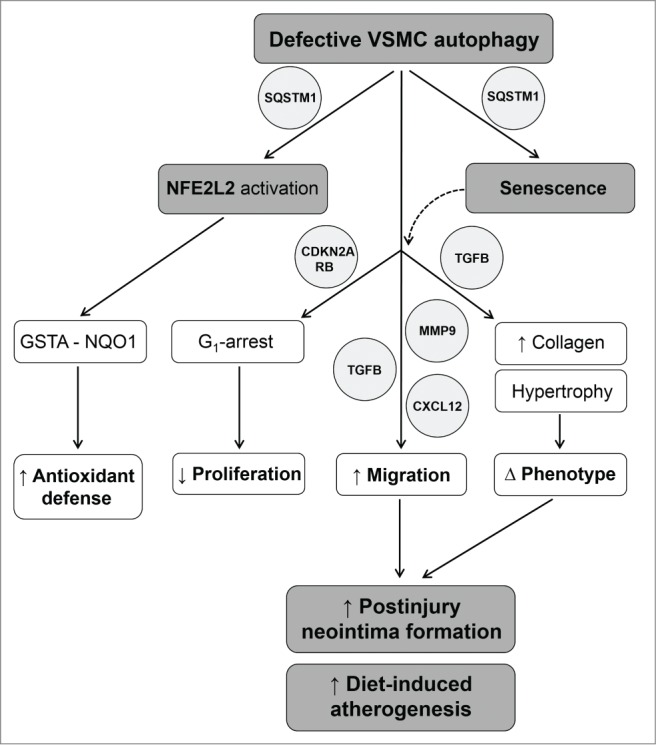
Autophagy is triggered in vascular smooth muscle cells (VSMCs) of diseased arterial vessels. However, the role of VSMC autophagy in cardiovascular disease is poorly understood. Therefore, we investigated the effect of defective autophagy on VSMC survival and phenotype and its significance in the development of postinjury neointima formation and atherosclerosis. Tissue-specific deletion of the essential autophagy gene Atg7 in murine VSMCs (atg7−/− VSMCs) caused accumulation of SQSTM1/p62 and accelerated the development of stress-induced premature senescence as shown by cellular and nuclear hypertrophy, CDKN2A-RB-mediated G1 proliferative arrest and senescence-associated GLB1 activity. Transfection of SQSTM1-encoding plasmid DNA in Atg7+/+ VSMCs induced similar features, suggesting that accumulation of SQSTM1 promotes VSMC senescence. Interestingly, atg7−/− VSMCs were resistant to oxidative stress-induced cell death as compared to controls. This effect was attributed to nuclear translocation of the transcription factor NFE2L2 resulting in upregulation of several antioxidative enzymes. In vivo, defective VSMC autophagy led to upregulation of MMP9, TGFB and CXCL12 and promoted postinjury neointima formation and diet-induced atherogenesis. Lesions of VSMC-specific atg7 knockout mice were characterized by increased total collagen deposition, nuclear hypertrophy, CDKN2A upregulation, RB hypophosphorylation, and GLB1 activity, all features typical of cellular senescence. To conclude, autophagy is crucial for VSMC function, phenotype, and survival. Defective autophagy in VSMCs accelerates senescence and promotes ligation-induced neointima formation and diet-induced atherogenesis, implying that autophagy inhibition as therapeutic strategy in the treatment of neointimal stenosis and atherosclerosis would be unfavorable. Conversely, stimulation of autophagy could be a valuable new strategy in the treatment of arterial disease.
Overview
The claims and statistics of this paper haven’t been checked yet.
Run the check — free, no account needed. It reads the open-access text and checks the sources it cites.
Integrity signals
Registry
Cites
Statistics
Figures
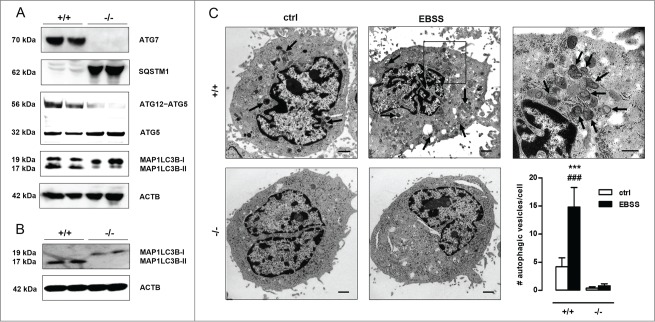
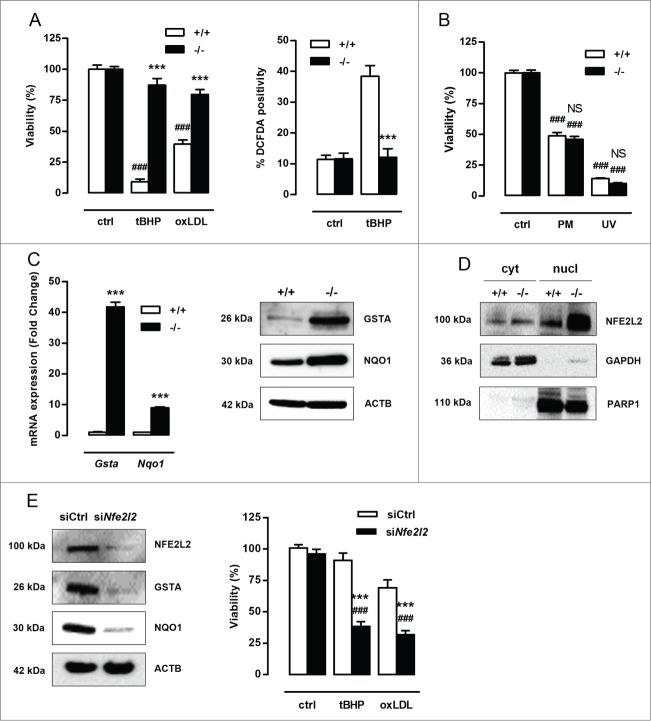
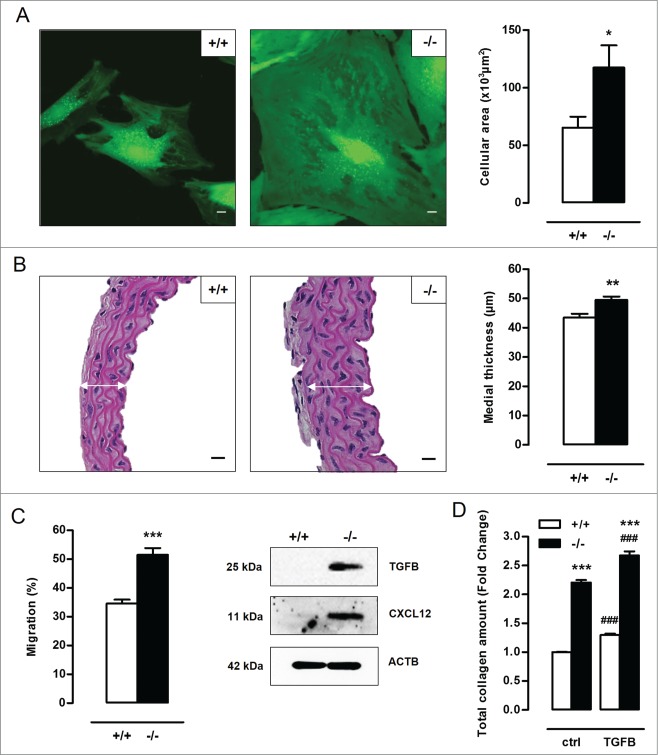
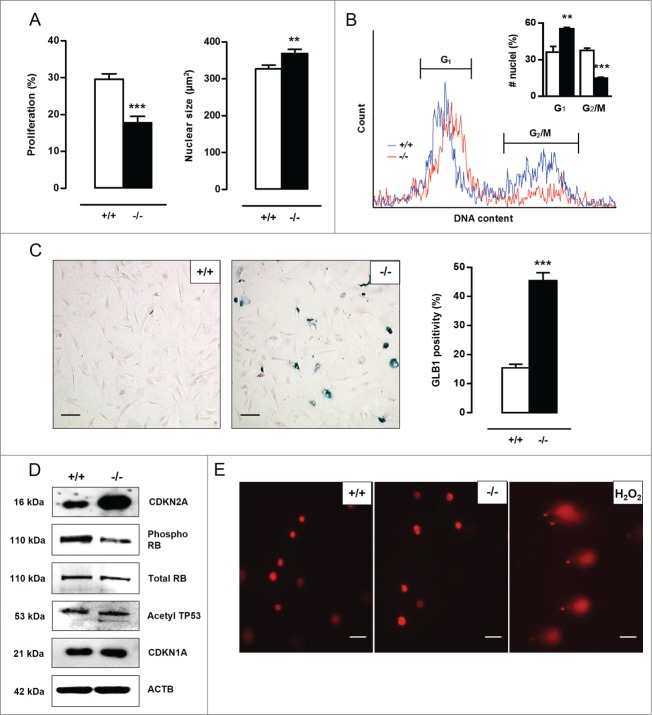
Verification
Claims the paper makes
The claims and statistics of this paper haven’t been checked yet.
Run the check — free, no account needed. It reads the open-access text and checks the sources it cites.
Claims other papers make about this one
Each is checked against this paper’s own text: does it say what the citing paper says it does?
In the citing paper
“Loss of autophagy can also drive VSMC senescence 75 .”
From Vascular smooth muscle cells in atherosclerosis (2019) · cites this paper as [75]
Self-check
Percentages, sums and reported differences re-computed from the paper’s own numbers.
The self-check needs the paper’s full text.
Citations
Cites
Repertoires of Autophagy in the Pathogenesis of Ocular Diseases
Li, Y., Jiang, Q. L., Cao, G.-F., Yao, J., & Yan, B. (2015) · Cellular Physiology and Biochemistry · doi:10.1159/000373980 · Cited by 16,351
Autophagy: Renovation of Cells and Tissues
Mizushima, N., & Komatsu, M. (2011) · Cell · doi:10.1016/j.cell.2011.10.026 · Cited by 6,615 · cited 1×
“amino acids) are recycled in order to replenish nutrient and energy supply.(2) Basal autophagy is therefore an important housekeeping and life-sustaining process.”
BackgroundCellular senescence: when bad things happen to good cells
Campisi, J., & d'Adda di Fagagna, F. (2007) · Nature Reviews Molecular Cell Biology · doi:10.1038/nrm2233 · Cited by 4,441 · cited 3×
“Cellular senescence can be established by the activation of 2 different tumor suppressor pathways: TP53-CDKN1A and CDKN2A-RB.(20,21) The TP53 pathway is triggered by DNA damage and generally associated with CDKN1A upregulation to initiate growth arrest.”
BackgroundLoss of autophagy in the central nervous system causes neurodegeneration in mice
Komatsu, M., Waguri, S., Chiba, T., Murata, S., Iwata, J.-I., Tanida, I., Ueno, T., Koike, M., Uchiyama, Y., Kominami, E., et al. (2006) · Nature · doi:10.1038/nature04723 · Cited by 3,500
Aging, Cellular Senescence, and Cancer
Campisi, J. (2013) · Annual Review of Physiology · doi:10.1146/annurev-physiol-030212-183653 · Cited by 2,954 · cited 3×
“Moreover, atg7¡/¡ VSMCs show an increase in TGFB and CXCL12 expression, which is most likely related to the increase in migration potential and the development of a senescence-associated secretory phenotype.(29,30) Cellular senescence can be established by the activation of 2 different tumor suppressor pathways: TP53-…”
BackgroundImpairment of starvation-induced and constitutive autophagy in Atg7 -deficient mice
Komatsu, M., Waguri, S., Ueno, T., Iwata, J., Murata, S., Tanida, I., Ezaki, J., Mizushima, N., Ohsumi, Y., Uchiyama, Y., et al. (2005) · The Journal of Cell Biology · doi:10.1083/jcb.200412022 · Cited by 2,331
Komatsu, M., Kurokawa, H., Waguri, S., Taguchi, K., Kobayashi, A., Ichimura, Y., Sou, Y.-S., Ueno, I., Sakamoto, A., Tong, K. I., et al. (2010) · Nature Cell Biology · doi:10.1038/ncb2021 · Cited by 2,288 · cited 4×
“SQSTM1 is considered to be a crucial activator of NFE2L2.(19) In the present study, atg7¡/¡ VSMCs showed increased nuclear translocation of NFE2L2.”
BackgroundInfluentialOxidative stress and autophagy: The clash between damage and metabolic needs
Filomeni, G., De Zio, D., & Cecconi, F. (2015) · Cell Death & Differentiation · doi:10.1038/cdd.2014.150 · Cited by 2,195 · cited 1×
“Defective autophagy in VSMCs triggers an antioxidative backup mechanism ROS production, oxidative damage and cell death are major events in cardiovascular disease(15,16) and may be regulated by autophagy.(17,18) To test the role of autophagy in VSMC survival against oxidative stress, Atg7C/C and atg7¡/¡ VSMCs were tre…”
MethodHomeostatic levels of p62 control cytoplasmic inclusion body formation in autophagy-deficient mice.
Komatsu, M., Waguri, S., Koike, M., Sou, Y.-S., Ueno, T., Hara, T., Mizushima, N., Iwata, J.-I., Ezaki, J., Murata, S., et al. (2007) · Cell · doi:10.1016/j.cell.2007.10.035 · Cited by 2,124
Rubinsztein, D. C., Mariño, G., & Kroemer, G. (2011) · Cell · doi:10.1016/j.cell.2011.07.030 · Cited by 2,107 · cited 1×
“Induction of autophagy by caloric restriction, spermidine, resveratrol or rapamycin extends life span in different organisms.(35) For example, the autophagy-inducers rapamycin and resveratrol suppress cellular senescence by partially preventing loss of proliferative potential,(36,37) whereas inhibition of autophagy by…”
Background
Research works printed but not linked: 3
- Grube E, 2004, Rev Cardiovasc Med, 5, S3
- Louis SF, 2010, Exp Clin Cardiol, 15, e75-85
- Seimon TA, 2009, J Clin Invest, 119, 886
Cited by
Sorted by citations
Items 101–200 of 267
Defective autophagy in vascular smooth muscle cells enhances atherosclerotic plaque instability
Masuyama, A., Mita, T., Azuma, K., Osonoi, Y., Nakajima, K., Goto, H., Nishida, Y., Miyatsuka, T., Mitsumata, M., & Watada, H. (2018) · Biochemical and Biophysical Research Communications · doi:10.1016/j.bbrc.2018.09.192 · Cited by 31
Liang, X., Wang, C., Sun, Y., Song, W., Lin, J., Li, J., & Guan, X. (2019) · Biochemical and Biophysical Research Communications · doi:10.1016/j.bbrc.2019.04.134 · Cited by 31
Reprogramming Interferon Regulatory Factor Signaling in Cardiometabolic Diseases
Zhang, Y., & Li, H. (2017) · Physiology · doi:10.1152/physiol.00038.2016 · Cited by 32
“apoptosis, the balance of autophagy in VSMCs is essential for the homeostasis of blood vessels (26, 66, 77).”
Transcriptome Profiling in Systems Vascular Medicine
Xu, S. (2017) · Frontiers in Pharmacology · doi:10.3389/fphar.2017.00563 · Cited by 30
Advances in epigenetic regulation of vascular aging
Jin, J., Liu, Y., Huang, L., & Tan, H. (2019) · Reviews in Cardiovascular Medicine · doi:10.31083/j.rcm.2019.01.3189 · Cited by 31
“In addition, the NF-κB binding may increase the expression of adhesion-inducible nitric oxide synthase in coronary arteries and aorta (Cernadas et al., 1998), leading to atherosclerosis (Hajra et al., 2000).”
BackgroundMitophagy modulation for the treatment of cardiovascular diseases
Forte, M., D’Ambrosio, L., Schiattarella, G. G., Salerno, N., Perrone, M. A., Loffredo, F. S., Bertero, E., Pilichou, K., Manno, G., Valenti, V., et al. (2024) · European Journal of Clinical Investigation · doi:10.1111/eci.14199 · Cited by 29
“90 These results were also confirmed in another study performed in ApoE −/− mice carrying VSMC-specific deletion of Atg7.”
ResultA review on therapeutical potential of paeonol in atherosclerosis
Yu, W., Ilyas, I., Aktar, N., & Xu, S. (2022) · Frontiers in Pharmacology · doi:10.3389/fphar.2022.950337 · Cited by 29
“development or acceleration of atherosclerosis (Grootaert et al., 2015).”
Wang, S., Yuan, R., Liu, M., Zhang, Y., Jia, B., Ruan, J., Shen, J., Zhang, Y., Liu, M., & Wang, T. (2022) · Biomedicine & Pharmacotherapy · doi:10.1016/j.biopha.2022.113712 · Cited by 29
Trichoplein binds PCM1 and controls endothelial cell function by regulating autophagy
Martello, A., Lauriola, A., Mellis, D. J., Parish, E., Dawson, J. C., Imrie, L. H. J., Vidmar, M., Gammoh, N., Mitić, T., Brittan, M., et al. (2020) · EMBO Reports · doi:10.15252/embr.201948192 · Cited by 30
Role of ROS and autophagy in the pathological process of atherosclerosis
Zhu, L., Liao, Y., & Jiang, B. (2024) · Journal of Physiology and Biochemistry · doi:10.1007/s13105-024-01039-6 · Cited by 26
“Thus, the loss of SMC ATG-7 increases collagen deposition, promotes postinjury neointima formation and accelerates atherosclerotic plaque development [62].”
Wang, Y., Chen, J., Li, X., Umetani, M., Chen, Y., Li, P., & Zhang, Y. (2019) · American Journal of Physiology-Cell Physiology · doi:10.1152/ajpcell.00294.2019 · Cited by 26
Beyond Self-Recycling: Cell-Specific Role of Autophagy in Atherosclerosis
Henderson, J. M., Weber, C., & Santovito, D. (2021) · Cells · doi:10.3390/cells10030625 · Cited by 27
Kyriakakis, E., Frismantiene, A., Dasen, B., Pfaff, D., Rivero, O., Lesch, K., Erné, P., Resink, T. J., & Philippova, M. (2017) · Cellular Signalling · doi:10.1016/j.cellsig.2017.04.004 · Cited by 26
The mechanisms of vascular aging
Wang, S., Hu, S., & Mao, Y. (2021) · Aging Medicine · doi:10.1002/agm2.12151 · Cited by 25
Wang, G., Zhu, Y., Li, K., Liao, B., Wang, F., Shao, L., Huang, L., & Bai, D. (2021) · Journal of Cardiovascular Pharmacology · doi:10.1097/fjc.0000000000001069 · Cited by 26
Histone Lysine Methylation Modification and Its Role in Vascular Calcification
Cao, Y.-C., Shan, S., Guo, B., Li, C., Li, F., Zheng, M.-H., Xu, Q.-S., Wang, Y., Lei, L.-M., Tang, K.-X., et al. (2022) · Frontiers in Endocrinology · doi:10.3389/fendo.2022.863708 · Cited by 25
He, L., Chu, Y., Yang, J., He, J., Hua, Y., Chen, Y., Benavides, G. A., Rowe, G. C., Zhou, L., Ballinger, S. W., et al. (2022) · Cells · doi:10.3390/cells11132111 · Cited by 27
Unveiling the dual role of autophagy in vascular remodelling and its related diseases
Ren, H., Dai, R., Nabil, W. N. N., Xi, Z., Wang, F., & Xu, H. (2023) · Biomedicine & Pharmacotherapy · doi:10.1016/j.biopha.2023.115643 · Cited by 25
Zhu, Q., Ni, X.-Q., Lu, W., Zhang, J., Ren, J.-L., Wu, D., Chen, Y., Zhang, L., Yu, Y.-R., Tang, C., et al. (2017) · Atherosclerosis · doi:10.1016/j.atherosclerosis.2017.10.011 · Cited by 26
Autophagy-associated signal pathways of functional foods for chronic diseases
Xie, J., Liang, J., & Chen, N. (2019) · Food Science and Human Wellness · doi:10.1016/j.fshw.2019.03.002 · Cited by 26
Hendrickx, J. O., Martinet, W., Dam, D. V., & Meyer, G. R. Y. D. (2021) · Frontiers in Molecular Biosciences · doi:10.3389/fmolb.2021.651215 · Cited by 28
“In addition, autophagy deficiency in VSMCs triggers cellular hypertrophy and increases stress-induced premature cellular senescence (Grootaert et al., 2015).”
BackgroundSelf-citationAutophagy: a killer or guardian of vascular smooth muscle cells
Zhang, Y.-Y., Shi, Y.-N., Zhu, N., Wang, W., Deng, C.-F., Xie, X.-J., Liao, D.-F., & Qin, L. (2020) · Journal of Drug Targeting · doi:10.1080/1061186x.2019.1705312 · Cited by 24
“VSMCs-specific deletion of Atg7 accelerate stress-induced premature aging and promote atherosclerosis due to accumulation of SQSTM1/p62 [31].”
BackgroundLee, B., Shin, H., Oh, J., Park, J., Park, M., Yang, S. C., Jun, J. H., Hong, S., Song, H., & Lim, H. J. (2020) · Autophagy · doi:10.1080/15548627.2020.1778292 · Cited by 24
“In vascular smooth muscle cells (VSMCs), defective autophagy is linked to cell senescence and enhancement of neointimal stenosis and atherosclerosis [13].”
BackgroundMeng, Y., Wu, C., Yu, B., Li, H., Chen, M., & Qi, G. (2018) · Folia Biologica · doi:10.14712/fb2018064030103 · Cited by 23
“A recent study demonstrated that autophagy inhibition by gene deletion prevented oxidative stressinduced cell death in VSMCs (Grootaert et al., 2015).”
BackgroundInfluentialBazedoxifene inhibits PDGF-BB induced VSMC phenotypic switch via regulating the autophagy level
Song, W., Gao, K., Huang, P., Tang, Z., Nie, F., Jia, S., & Guo, R. (2020) · Life Sciences · doi:10.1016/j.lfs.2020.118397 · Cited by 22
Gorostieta-Salas, E., Moreno-Blas, D., Gerónimo‐Olvera, C., Cisneros, B., Court, F. A., & Castro‐Obregón, S. (2021) · Oxidative Medicine and Cellular Longevity · doi:10.1155/2021/6682336 · Cited by 20
“Increasing evidence indicates that a de fi cient autophagic degradation promotes cellular senescence in proliferating and postmitotic cells [10 – 13].”
Hypertension and cellular senescence
Afşar, B., & Afşar, R. E. (2023) · Biogerontology · doi:10.1007/s10522-023-10031-4 · Cited by 22
“Specific deletion of Atg7 in VSMC induces p62 accumulation and accelerates the development of stress-induced premature senescence (Grootaert et al. 2015).”
BackgroundGao, P. T., Wu, W., Ye, J., Lu, Y. W., Adam, A. P., Singer, H. A., & Long, X. (2018) · Cellular Signalling · doi:10.1016/j.cellsig.2018.07.002 · Cited by 22
Impaired autophagy mediates hyperhomocysteinemia-induced HA-VSMC phenotypic switching
Ni, T., Gao, F., Zhang, J., Lin, H., Luo, H., Chi, J., & Guo, H. (2019) · Journal of Molecular Histology · doi:10.1007/s10735-019-09827-x · Cited by 22
Chao, C., Kuo, F.-C., & Lin, S. (2022) · Seminars in Cell and Developmental Biology · doi:10.1016/j.semcdb.2022.09.012 · Cited by 22
Hu, G., Bao, L., Li, G., Chen, L., & Hong, F. F. (2023) · Carbohydrate Polymers · doi:10.1016/j.carbpol.2023.120572 · Cited by 21
Sun, X., Yang, Y., Zhao, W., Wang, M., Chen, Y., Wang, J., Yang, D., & Yang, Y. (2024) · Atherosclerosis · doi:10.1016/j.atherosclerosis.2024.117470 · Cited by 21
Portilla-Fernández, E., Ghanbari, M., van Meurs, J. B. J., Danser, A. H. J., Franco, O. H., Muka, T., Roks, A. J. M., & Dehghan, A. (2019) · PLoS ONE · doi:10.1371/journal.pone.0214137 · Cited by 21
Autophagy as an emerging therapeutic target for age-related vascular pathologies
Munck, D. G. D., Meyer, G. R. Y. D., & Martinet, W. (2020) · Expert Opinion on Therapeutic Targets · doi:10.1080/14728222.2020.1723079 · Cited by 20
Self-citationCellular Senescence in Cardiovascular Diseases: From Pathogenesis to Therapeutic Challenges
Li, D., Li, Y., Ding, H., Wang, Y., Xie, Y., & Zhang, X. (2023) · Journal of Cardiovascular Development and Disease · doi:10.3390/jcdd10100439 · Cited by 21
“CS can be triggered in VSMCs through various mechanisms, like telomeric shortening, DNA damage, oxidative stress, and dysfunction in autophagy [87].”
BackgroundYu, H., Xie, Y., Lan, L., Ma, S., Mok, S. W. F., Wong, I. N., Wang, Y., Zhong, G., Yuan, L., Zhao, H., et al. (2024) · Free Radical Biology and Medicine · doi:10.1016/j.freeradbiomed.2024.07.021 · Cited by 20
“In addition, the accumulated expression of p62 in VSMCs with Sirt7 depletion seen in this study may also contribute to accelerated cellular senescence, as suggested by a previous study showing that p62 accumulation mediates the induction of senescence in autophagy defective VSMCs [51].”
The impact of autophagy on the development of senescence in primary tubular epithelial cells
Baisantry, A., Bhayana, S., Wrede, C., Hegermann, J., Haller, H. G., Melk, A., & Schmitt, R. (2016) · Cell Cycle · doi:10.1080/15384101.2016.1234547 · Cited by 22
Park, H.-S., Han, J., Jung, S., Lee, D., Heo, K., & Myung, C. (2018) · Korean Journal of Physiology and Pharmacology · doi:10.4196/kjpp.2018.22.3.349 · Cited by 20
You, L., Chen, H., Xu, L., & Li, X. (2020) · BioMed Research International · doi:10.1155/2020/9627974 · Cited by 20
“MMPs can promote the degradation of the extracellular matrix (ECM) as well as migration of VSMCs [25].”
BackgroundZheng, H., Zhai, W., Zhong, C., Hong, Q., Li, H., Rui, B., Zhu, X., Que, D., Feng, L., Yu, B., et al. (2021) · Journal of Cellular Physiology · doi:10.1002/jcp.30400 · Cited by 21
Chen, Y., Zhang, H., Liu, H., Li, K., & Su, X. (2018) · Microvascular Research · doi:10.1016/j.mvr.2018.03.010 · Cited by 19
Munck, D. G. D., Leloup, A. J. A., Meyer, G. R. Y. D., Martinet, W., & Fransen, P. F. (2020) · Pflügers Archiv - European Journal of Physiology · doi:10.1007/s00424-020-02408-y · Cited by 19
Self-citationZhao, J., He, X., Zuo, M., Li, X., & Sun, Z. (2021) · Bioengineered · doi:10.1080/21655979.2021.1948289 · Cited by 19
“As the pathogenesis of atherosclerosis develops, vascular smooth muscle cells migrate to the tunica intima and accumulate around necrotic foam cells to form fibrous caps, which further contributes to the development of atherosclerotic plaques [4,5].”
BackgroundXu, H., Yu, M., Yu, Y., Li, Y., Yang, F., Liu, Y., Han, L., Xu, Z., & Wang, G. (2022) · European Journal of Clinical Investigation · doi:10.1111/eci.13804 · Cited by 20
Li, W., Chi, D., Ju, S., Zhao, X., Li, X., Zhao, J., Xie, H., Li, Y., Jin, J., Mang, G., et al. (2024) · Thrombosis Research · doi:10.1016/j.thromres.2024.03.005 · Cited by 19
Singh, B., Cui, K., Eisa-Beygi, S., Zhu, B., Cowan, D. B., Shi, J., Wang, D., Liu, Z., Bischoff, J. E., & Chen, H. (2024) · Vascular Pharmacology · doi:10.1016/j.vph.2024.107368 · Cited by 21
Ni, D., Cai, L., Liu, M., Peng, J., Yi, G., & Mo, Z. (2024) · Cell Cycle · doi:10.1080/15384101.2024.2344943 · Cited by 18
“The deletion of tissue-specific autophagy gene ATG7 in mouse vascular smooth muscle cells will inhibit autophagy, accelerate aging and promote the formation of atherosclerosis [125].”
BackgroundSong, S., Wu, S., Wang, Y., Wang, Z. P., Ye, C.-X., Song, R., Song, D., & Ruan, Y. (2018) · Experimental Gerontology · doi:10.1016/j.exger.2018.10.021 · Cited by 18
Chira, S., Ráduly, L., Braicu, C., Jurj, A. M., Cojocneanu, R., Pop, L., Pileczki, V., Ionescu, C., & Berindan‐Neagoe, I. (2018) · Experimental and Therapeutic Medicine · doi:10.3892/etm.2018.6324 · Cited by 17
Mitochondrial DNA in atherosclerosis: Mechanisms, biomarker potential, and therapeutic perspectives
Zhang, R., Jiang, Y., Zhang, G., Zeng, W., Suo, Y., Zhang, F., & Jiang, X. (2025) · International Immunopharmacology · doi:10.1016/j.intimp.2025.114449 · Cited by 16
Mechanisms of endothelial senescence and vascular aging
Qiao, L., Qian, Z., Huang, Y., Yang, X. F., Yang, J., Xiao, N., Liang, G., Zhang, H., Fu, Y., Yan, L., et al. (2025) · Biogerontology · doi:10.1007/s10522-025-10279-y · Cited by 21
“Autophagy protein Atg7 deficiency induced VSMCs senescence (Grootaert et al. 2015).”
Xu, J., Zhao, X., Jin, Z., Yu, J., Guan, S., Xu, X., & Mei, L. (2020) · Journal of Dental Sciences · doi:10.1016/j.jds.2020.02.005 · Cited by 16
PCSK9: A new participant in lipophagy in regulating atherosclerosis?
Xiao, J. H., Deng, Y., Liu, X.-R., Cao, J., Zhou, M., Tang, Y., Xiong, W., Jiang, Z., Tang, Z., & Liu, L. (2019) · Clinica Chimica Acta · doi:10.1016/j.cca.2019.05.005 · Cited by 18
The role of autophagy in abdominal aortic aneurysm: protective but dysfunctional
Wang, L., Liu, S., Pan, B., Cai, H., Zhou, H., Yang, P., & Wang, W. (2020) · Cell Cycle · doi:10.1080/15384101.2020.1823731 · Cited by 17
Zheng, L., Wang, Z., Li, Z., Wang, M., Wang, W., & Chang, G. (2021) · Journal of Cellular and Molecular Medicine · doi:10.1111/jcmm.16305 · Cited by 15
Mitophagy: Critical Role in Atherosclerosis Progression
Chen, Y., Qin, W., Lü, L., Wu, P., & Wei, D. (2022) · DNA and Cell Biology · doi:10.1089/dna.2022.0249 · Cited by 17
“The defective autophagy in VSMC accelerates cellular senescence by significantly increasing the expression of senescence-associated proteins and promotes neointima formation and diet-induced AS after vascular injury (Grootaert et al. , 2015).”
Pennington, S. M., Klutho, P. J., Xie, L., Broadhurst, K., Koval, O. M., McCormick, M. L., Spitz, D. R., & Grumbach, I. M. (2018) · Redox Biology · doi:10.1016/j.redox.2018.04.001 · Cited by 16
Shi, G., Zeng, L., Shi, J., & Chen, Y. (2023) · International Heart Journal · doi:10.1536/ihj.22-603 · Cited by 19
Altered Tregs Differentiation and Impaired Autophagy Correlate to Atherosclerotic Disease
Mandatori, S., Pacella, I., Marzolla, V., Mammi, C., Starace, D., Padula, F., Vitiello, L., Armani, A., Savoia, C., Taurino, M., et al. (2020) · Frontiers in Immunology · doi:10.3389/fimmu.2020.00350 · Cited by 14
Yu, H., Cheng, Y., Zhang, G., Wang, X., Gu, W., & Guo, X. (2020) · Life Sciences · doi:10.1016/j.lfs.2020.118884 · Cited by 16
Vascular Smooth Muscle Cells: A Therapeutic Target in Atherosclerosis
Zhao, L., Zhao, L., Liu, D., Huang, F., Peng, Q., Lu, J., Zhou, J., Zheng, S., & Liu, X. (2025) · Reviews in Cardiovascular Medicine · doi:10.31083/rcm28240 · Cited by 20
“The autophagy defect of VSMCs is the main cause of AS. Autophagy defects in VSMCs lead to the up-regulation of MMP9, TGFB, and CXCL12, thus accelerating aging and promoting post-injury neo-membrane formation and diet-induced AS formation [166].”
Yan, W., Cao, Y., Zhen, P., Ji, D., Chai, J., Xue, K., Dai, H., & Wang, W. (2020) · Clinical and Experimental Pharmacology and Physiology · doi:10.1111/1440-1681.13442 · Cited by 14
Hong, Q., Que, D., Zhong, C., Huang, G., Zhai, W., Chen, D., Yan, J., & Yang, P. (2022) · Biomedicine & Pharmacotherapy · doi:10.1016/j.biopha.2022.113639 · Cited by 15
Liu, R., Gao, Y., Huang, L., Shi, B., Yin, X., & Zou, S. (2023) · Journal Of Clinical Periodontology · doi:10.1111/jcpe.13784 · Cited by 15
Gwon, J. G., & Lee, S. M. (2024) · Vascular Specialist International · doi:10.5758/vsi.230116 · Cited by 14
SIRT-associated attenuation of cellular senescence in vascular wall
Sazdova, I., Hadzi‐Petrushev, N., Keremidarska‐Markova, M., Stojchevski, R., Sopi, R., Shileiko, S. A., Mitrokhin, V. M., Gagov, H., Avtanski, D. B., Lubomirov, L. T., et al. (2024) · Mechanisms of Ageing and Development · doi:10.1016/j.mad.2024.111943 · Cited by 16
From defense to dysfunction: Autophagy's dual role in disease pathophysiology
Malik, J. A., Zafar, M. A., Singh, S., Nanda, S., Bashir, H., Das, D. K., Lamba, T., Khan, M. A., Kaur, G., & Agrewala, J. N. (2024) · European Journal of Pharmacology · doi:10.1016/j.ejphar.2024.176856 · Cited by 14
Shu, Z., Li, X., Zhang, W., Huyan, Z., Cheng, D., Xie, S., Cheng, H., Wang, J., & Du, B. (2024) · Lipids in Health and Disease · doi:10.1186/s12944-024-02268-w · Cited by 13
“Recent studies have demonstrated a crucial correlation between senescence and autophagy in VSMCs, in which autophagy removes aged and damaged organelles, thereby attenuating the cellular senescence process [11].”
BackgroundA role for autophagy in carotid atherosclerosis
Alloza, I., Goikuria, H., Freijo, M. D. M., & Vandenbroeck, K. (2016) · European Stroke Journal · doi:10.1177/2396987316674085 · Cited by 14
Tan, Z., Ren, H., Liu, Y., Yang, H., Luo, Q., & Deng, X. (2022) · Experimental and Therapeutic Medicine · doi:10.3892/etm.2022.11673 · Cited by 13
Neutel, C. H. G., Wesley, C. D., Praet, M. V., Civati, C., Roth, L., Meyer, G. R. Y. D., Martinet, W., & Guns, P. (2023) · Vascular Pharmacology · doi:10.1016/j.vph.2023.107212 · Cited by 13
Self-citationLncRNA-modulated autophagy in plaque cells: a new paradigm of gene regulation in atherosclerosis?
Ren, K., Xu, X., Yu, X.-H., Li, M., Shi, M., Liu, Q.-X., Jiang, T., Zheng, X., Yin, K., & Zhao, G.-J. (2020) · Aging · doi:10.18632/aging.103786 · Cited by 12
Li, J., Wang, Y., Shrestha, S., Gewirtz, A. T., Ding, Y., & Zou, J. (2025) · Nutrients · doi:10.3390/nu17172887 · Cited by 12
Zheng, X., Yu, Q., Shang, D., Yin, C., Xie, D., Huang, T., Du, X., Wang, W., Yan, X., Zhang, C., et al. (2022) · Atherosclerosis · doi:10.1016/j.atherosclerosis.2022.01.009 · Cited by 12
Gao, W., Yang, T., Wang, B., Liu, Q., Li, Q., Zhou, X., Zheng, C., & Chen, P. (2024) · Clinical and Experimental Pharmacology and Physiology · doi:10.1111/1440-1681.13845 · Cited by 12
“12 Conversely, the stimulation of autophagy has been shown to diminish the formation of VSMC-derived foam cells, 9,10 thereby positioning the autophagy pathway as a viable target for ameliorating lipid accumulation and treating AS.”
BackgroundMochida, A., Mita, T., Azuma, K., Osonoi, Y., Masuyama, A., Nakajima, K., Goto, H., Nishida, Y., Miyatsuka, T., Mitsumata, M., et al. (2021) · Physiological Reports · doi:10.14814/phy2.15000 · Cited by 12
“Both Grootaert et al. and our group demonstrated that SMC- specific Atg7 deficiency increased the medial thickness and resulted in the development of advanced plaques with increased collagen content (Grootaert et al., 2015; Osonoi et al., 2018).”
BackgroundCellular senescence and abdominal aortic aneurysm: From pathogenesis to therapeutics
Wang, D., Hao, X., Jia, L., Jing, Y., Jiang, B., & Xin, S. (2022) · Frontiers in Cardiovascular Medicine · doi:10.3389/fcvm.2022.999465 · Cited by 14
“It was reported that a large amount of SQSTM1/p62 was accumulated in the VSMCs of ATG7 knockout mice, which accelerated the occurrence of SIPS, such as cell enlargement, nuclear hyperplasia, cell cycle arrest and increased SA-β-Gal activity (143).”
BackgroundProtoporphyrin IX-mediated sonodynamic therapy promotes autophagy in vascular smooth muscle cells
Li, Q., Kang, J., Xiong, X., Liu, Y., Cao, W., Liu, Y., & Li, Y. (2017) · Oncology Letters · doi:10.3892/ol.2017.6394 · Cited by 12
A potential role of autophagy-mediated vascular senescence in the pathophysiology of HFpEF
Sanhueza‐Olivares, F., Troncoso, M. F., la Fuente, F. P.-D., Martinez-Bilbao, J., Riquelme, J. A., Norambuena‐Soto, I., Villa, M., Lavandero, S., Castro, P., & Chiong, M. (2022) · Frontiers in Endocrinology · doi:10.3389/fendo.2022.1057349 · Cited by 13
Kang, S., Park, J.-W., Cho, E., Kim, D., Ye, S., Jeong, E. T., Jun, S., & Kang, N. G. (2025) · Biomedicines · doi:10.3390/biomedicines13102395 · Cited by 13
“Previous studies observed that a deficient autophagy accelerates senescence [49,50] and promotes the development of not only aging-related phenotypes but also diverse pathologic conditions such as Alzheimer’s disease, diabetes and obesity [50,51].”
Fuerlinger, A., Stockner, A., Sedej, S., & Abdellatif, M. (2025) · Cardiovascular Diabetology · doi:10.1186/s12933-024-02566-8 · Cited by 12
The multifaceted role of autophagy and mitophagy in cardiovascular health and disease
Nàger, M., Calvoli, M., Larsen, K. B., & Birgisdottir, Å. B. (2025) · Autophagy Reports · doi:10.1080/27694127.2025.2572511 · Cited by 11
“Specific deletion of Atg7 in VSMCs leads to accelerated senescence, neointima formation, and diet-induced atherogenesis in atheroprone ( apoe −/− ) mice [148] .”
Shen, X., Zou, J., Li, F., Zhang, T., & Guo, T. (2018) · Molecular Medicine Reports · doi:10.3892/mmr.2018.8937 · Cited by 11
Metformin protects against abdominal aortic aneurysm by Atg7-induced autophagy
Guo, J., Wang, Z., Xue, M., Mi, L., Zhao, M., Ma, C., Wu, J., & Han, X. (2021) · Advances in Clinical and Experimental Medicine · doi:10.17219/acem/142026 · Cited by 11
Defective Protein Catabolism in Atherosclerotic Vascular Inflammation
Miyazaki, T., & Miyazaki, A. (2017) · Frontiers in Cardiovascular Medicine · doi:10.3389/fcvm.2017.00079 · Cited by 11
“Interestingly, VSMC-specific deficiency of autophagy exacerbated high fat diet-induced atherosclerosis in Apoe−/− mice, which was accompanied by a thickening of the fibrous cap (64).”
BackgroundWang, B., Dong, G., Zhang, Q., Yan, F., Li, Z.-H., Li, C., Zhang, H., Ma, Q., Dai, J., Si, C., et al. (2019) · Experimental and Therapeutic Medicine · doi:10.3892/etm.2019.8317 · Cited by 12
Wang, Y., Zhang, X., Chen, W.-J., Gao, L., Li, J., Song, T., Chi, J., Zhang, X., Shi, Z., Dong, Y., et al. (2020) · Life Sciences · doi:10.1016/j.lfs.2020.117726 · Cited by 11
Chen, X., Cao, Y., Guo, Y., Liu, J., Ye, X., Li, H., Zhang, L., Feng, W., Xian, S., Yang, Z.-Q., et al. (2024) · Cellular Signalling · doi:10.1016/j.cellsig.2024.111136 · Cited by 12
Circadian misalignment promotes vascular smooth muscle cell apoptosis via defective autophagy
Guo, Z., Yu, B., Li, X., Yang, X., Wang, C., & Fan, L. (2021) · Journal of Molecular Histology · doi:10.1007/s10735-021-10000-6 · Cited by 10
Circular RNAs Involved in the Regulation of the Age-Related Pathways
Wang, S., Xiao, F., Li, J., Fan, X., He, Z., Yan, T., Yang, M., & Yang, D. (2022) · International Journal of Molecular Sciences · doi:10.3390/ijms231810443 · Cited by 10
The Potential Role of Connexins in the Pathogenesis of Atherosclerosis
Kiełbowski, K., Bakinowska, E., & Pawlik, A. (2023) · International Journal of Molecular Sciences · doi:10.3390/ijms24032600 · Cited by 10
Zhang, W., Cheng, Y., Xiao, Y., Sun, Y., Lin, Y., Li, Q., & Cai, W. (2023) · Frontiers in Bioengineering and Biotechnology · doi:10.3389/fbioe.2023.1199785 · Cited by 10
Chen, Y., Zhang, H., Liu, H., Li, K., Jia, M., & Su, X. (2018) · Annals of Vascular Surgery · doi:10.1016/j.avsg.2018.02.028 · Cited by 10
Munck, D. G. D., Moudt, S. D., Roth, L., Meyer, G. R. Y. D., Martinet, W., & Fransen, P. F. (2020) · Frontiers in Physiology · doi:10.3389/fphys.2020.548943 · Cited by 10
“Indeed, changes in peripheral vascular resistance due to structural and functional alterations in large elastic arteries and small resistance arteries are typical features of hypertension development (Harvey et al., 2015; Brown et al., 2018).”
BackgroundSelf-citationp62/SQSTM1: A potential molecular target for treatment of atherosclerosis
Liang, X., & Guan, X. (2017) · Frontiers in Laboratory Medicine · doi:10.1016/j.flm.2017.06.007 · Cited by 10
Hewedy, W. A., Abdulmalek, S. A., Ghareeb, D. A., & Habiba, E. S. (2023) · Naunyn-Schmiedeberg s Archives of Pharmacology · doi:10.1007/s00210-023-02627-x · Cited by 9
“Medial calcification occurs within elastic lamellae of affected arteries where the vascular smooth muscle cells (VSMCs) undergo a phenotypic transition from contractile cells into osteogenic cells that express key osteogenic markers and become capable of hydroxyapatite formation (Johnson et al. 2006) (Wu et al. 2013).”
BackgroundInfluentialThe Role of Hydrogen Sulfide in Plaque Stability
Lin, Q., & Geng, B. (2022) · Antioxidants · doi:10.3390/antiox11122356 · Cited by 9
“VSMC specific deletion human antigen R (HuR) or autophagy related 7 (ATG7) [85,86] caused autophagy defective, which promoted VSMC senescence and death, resulting in plaque instability.”
BackgroundUnbalanced Redox With Autophagy in Cardiovascular Disease
Jeong, S.-J., & Oh, G. (2023) · Journal of Lipid and Atherosclerosis · doi:10.12997/jla.2023.12.2.132 · Cited by 10
Chen, Y., Bao, M., Liu, J.-T., Bao, H., Zhang, S., Lou, Y., & Qi, Y. (2022) · Journal of Molecular and Cellular Cardiology · doi:10.1016/j.yjmcc.2022.10.001 · Cited by 10
Zuo, J., Guo, S., & Qin, X. (2023) · Naunyn-Schmiedeberg s Archives of Pharmacology · doi:10.1007/s00210-023-02558-7 · Cited by 9
“In animal models of AS, defects in autophagy have been shown to result in apoptosis, increased inflammation, and disrupted cholesterol metabolism (Grootaert et al. 2015).”
BackgroundResult
Metadata
- Authors
- Grootaert, M. O., da Costa Martins, P. A., Bitsch, N., Pintelon, I., De Meyer, G. R., Martinet, W., & Schrijvers, D. M.
- Affiliations
- University of Antwerp (BE)
- Department of Cardiology; Cardiovascular Research Institute Maastricht; Maastricht, The Netherlands
- Maastricht University (NL)
- Laboratory of Physiopharmacology; University of Antwerp; Antwerp, Belgium
- Corresponding author
- Schrijvers, Dorien M
- Venue
- Autophagy
- Publisher
- Informa UK Limited
- Published
- 2015-11-02
- Volume
- 11
- Issue
- 11
- Pages
- 2014-2032
- ISSN
- 1554-8627 (ISSN-L)
- 1554-8635
- PMC
- PMC4824610
- OpenAlex
- W2200751652
- Cited by
- 267
- References
- 73
- Citations by year
- 2026: 8 · 2025: 20 · 2024: 22 · 2023: 28 · 2022: 28 · 2021: 35 · 2020: 30 · 2019: 31 · 2018: 33 · 2017: 19 · 2016: 13
- FWCI
- 17.00
- Type
- journal article
- Language
- en
- Open access
- hybrid
- doi.org
- Licence
- cc-by-nc
- Locations
- Autophagy (publishedVersion, cc-by-nc)
- Europe PMC (PubMed Central) (publishedVersion, cc-by-nc)
- PubMed Central (publishedVersion, cc-by-nc)
- PubMed (publishedVersion)
- Research Publications (Maastricht University) (submittedVersion, other-oa)
- Digital Access to Libraries (submittedVersion, other-oa)
- Funders
- Fonds Wetenschappelijk Onderzoek (G044312N)
- Vlaamse regering
- Topics
- Life Sciences › Biochemistry, Genetics and Molecular Biology › Cell Biology › Autophagy in Disease and Therapy
- Life Sciences › Immunology and Microbiology › Immunology › Atherosclerosis and Cardiovascular Diseases
- Life Sciences › Biochemistry, Genetics and Molecular Biology › Cell Biology › Telomeres, Telomerase, and Senescence
- Keywords
- vascular smooth muscle cells, cellular senescence, neointima formation, atherosclerosis, ATG7, p62, stress-induced premature senescence, Nrf2, oxidative stress resistance, GLB1, MMP-9, CXCL12, collagen deposition
About these checks
Registry, retraction, Cites and statistics results are computed, not judged, with one exception: a printed reference that no index lists is read once by a model before it counts as a citation error. Claims are extracted by a model and kept only when their quote appears verbatim in the text; each cited source is then checked, with a model’s help, for whether it says what the claim relies on. Those verdicts can be wrong — read the claim’s quote and the cited source before relying on one.
Statistics and arithmetic are recomputed, not judged.
Confidence bands are shown only for fields calibrated on our annotated test set. None is calibrated yet, so no band is shown.
What counts as a claim ›How we measure confidence ›How we check this ›
Are you an author, or do you see a problem with this page? Request a review
