Cited by 64

The DOI matches its Crossref record; 12 of the 12 references it cites were found in a registry or an index.

Excess sphingomyelin disturbs ATG9A trafficking and autophagosome closure

Corcelle-Termeau, Elisabeth, Vindeløv, Signe Diness, Hämälistö, Saara, Mograbi, Baharia, Keldsbo, Anne, Bräsen, Jan Hinrich, Favaro, Elena, Adam, Dieter, Szyniarowski, Piotr, Hofman, Paul, Krautwald, Stefan, Farkas, Thomas, Petersen, Nikolaj H.T., Rohde, Mikkel, Linkermann, Andreas, Jäättelä, Marja·2016·Autophagy

Overview

The claims and statistics of this paper haven’t been checked yet.

Run the check — free, no account needed. It reads the open-access text and checks the sources it cites.

A few free checks a day · papers already verified open instantly · results are public

Integrity signals

Registry

Crossref · 10.1080/15548627.2016.1159378

Cites

12 of 12 references verified0 citation errors · 0 not checkable

Statistics

Figures

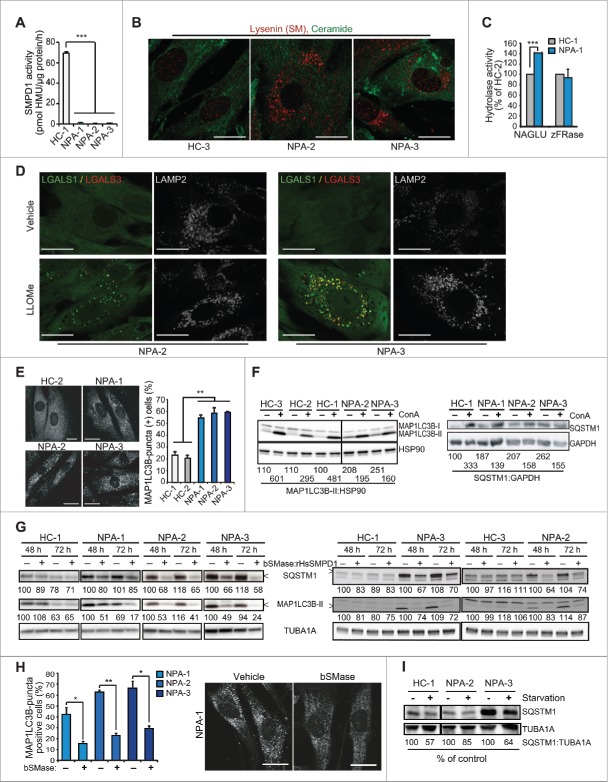
Figure 1 Sphingomyelinases and starvation revert autophagy defect in NPA patient fibroblasts. (A) SMPD1 hydrolytic activity in lysates of fibroblasts from a healthy controls (HC) and NPA patients (NPA). Bars, SD for a quadruplicate representative (n = 3) experiment. (B) Representative confocal images of the indicated fibroblasts permeabilized and stained with lysenin plus anti-lysenin and anti-ceramide antibodies to visualize intracellular SM and ceramide pools. (C) NAGLU and cysteine cathepsin (zFRase) activities in lysates of the indicated fibroblasts. Bars, SD for 3 triplicate experiments. (D) Representative confocal images of NPA-2 and NPA-3 fibroblasts stained for LGALS1 (green), LGALS3 (red) and LAMP2 (white, converted from blue). When indicated, cells were treated with 2 mM LLOMe for 2 h to induce lysosomal membrane permeabilization and LGALS1/3 puncta formation. (E) Representative confocal images of the indicated fibroblasts stained with anti-MAP1LC3B antibody (left) and the quantification of MAP1LC3B-puncta positive cells (≥10 puncta/cell) in these samples (right). Bars, SEM for ≥2 experiments with >50 cells analyzed/sample. (F) Representative immunoblots of MAP1LC3B-I and -II (LC3B-I and LC3B-II) and SQSTM1 from the indicated fibroblasts left untreated (−) or treated (+) for 16 h with 1 nM ConA. HSP90 and GAPDH served as loading controls. The values below represent MAP1LC3B-II:HSP90 and SQSTM1:GAPDH ratios as a percentage of the ratio in untreated HC-1 cells (upper row) or as a percentage of values in untreated cells from the same individual (lower row). (G) Representative immunoblots of MAP1LC3B-II and SQSTM1 from the indicated fibroblasts treated with vehicle (–) or 5 µg/ml of bSMase (left) or rHsSMPD1 (right) (+) every 24 h for the indicated times. TUBA1A served as a loading control. The values below the blots represent SQSTM1:TUBA1A (upper row) and MAP1LC3B-II:TUBA1A (lower row) ratios as a percentage of values in untreated cells from the same individual. (H) Quantification of LC3-puncta positive NPA fibroblasts (≥10 puncta/cell) after treatment with vehicle (−) or 5 µg/ml/24 h bSMase (+) for 48 h and staining with anti-MAP1LC3B antibody (left). Representative images of NPA-1 fibroblasts are shown (right). Bars, as in (C). (I) Representative SQSTM1 immunoblots of proteins from the indicated fibroblasts cultured in the normal growth medium (−) or in HBSS plus 1 g/L glucose (+) for 8 h. TUBA1A served as a loading control. All lanes originate from the same blot. The values represent SQSTM1:TUBA1A ratios as a percentage of values in untreated cells from the same individual. Scale bars: 20 μm. *, P < 0.05; **, P < 0.01; ***, P < 0.001.
Figure 1 Sphingomyelinases and starvation revert autophagy defect in NPA patient fibroblasts. (A) SMPD1 hydrolytic activity in lysates of fibroblasts from a healthy controls (HC) and NPA patients (NPA). Bars, SD for a quadruplicate representative (n = 3) experiment. (B) Representative confocal images of the indicated fibroblasts permeabilized and stained with lysenin plus anti-lysenin and anti-ceramide antibodies to visualize intracellular SM and ceramide pools. (C) NAGLU and cysteine cathepsin (zFRase) activities in lysates of the indicated fibroblasts. Bars, SD for 3 triplicate experiments. (D) Representative confocal images of NPA-2 and NPA-3 fibroblasts stained for LGALS1 (green), LGALS3 (red) and LAMP2 (white, converted from blue). When indicated, cells were treated with 2 mM LLOMe for 2 h to induce lysosomal membrane permeabilization and LGALS1/3 puncta formation. (E) Representative confocal images of the indicated fibroblasts stained with anti-MAP1LC3B antibody (left) and the quantification of MAP1LC3B-puncta positive cells (≥10 puncta/cell) in these samples (right). Bars, SEM for ≥2 experiments with >50 cells analyzed/sample. (F) Representative immunoblots of MAP1LC3B-I and -II (LC3B-I and LC3B-II) and SQSTM1 from the indicated fibroblasts left untreated (−) or treated (+) for 16 h with 1 nM ConA. HSP90 and GAPDH served as loading controls. The values below represent MAP1LC3B-II:HSP90 and SQSTM1:GAPDH ratios as a percentage of the ratio in untreated HC-1 cells (upper row) or as a percentage of values in untreated cells from the same individual (lower row). (G) Representative immunoblots of MAP1LC3B-II and SQSTM1 from the indicated fibroblasts treated with vehicle (–) or 5 µg/ml of bSMase (left) or rHsSMPD1 (right) (+) every 24 h for the indicated times. TUBA1A served as a loading control. The values below the blots represent SQSTM1:TUBA1A (upper row) and MAP1LC3B-II:TUBA1A (lower row) ratios as a percentage of values in untreated cells from the same individual. (H) Quantification of LC3-puncta positive NPA fibroblasts (≥10 puncta/cell) after treatment with vehicle (−) or 5 µg/ml/24 h bSMase (+) for 48 h and staining with anti-MAP1LC3B antibody (left). Representative images of NPA-1 fibroblasts are shown (right). Bars, as in (C). (I) Representative SQSTM1 immunoblots of proteins from the indicated fibroblasts cultured in the normal growth medium (−) or in HBSS plus 1 g/L glucose (+) for 8 h. TUBA1A served as a loading control. All lanes originate from the same blot. The values represent SQSTM1:TUBA1A ratios as a percentage of values in untreated cells from the same individual. Scale bars: 20 μm. *, P < 0.05; **, P < 0.01; ***, P < 0.001.CC BY-NC · PubMed Central
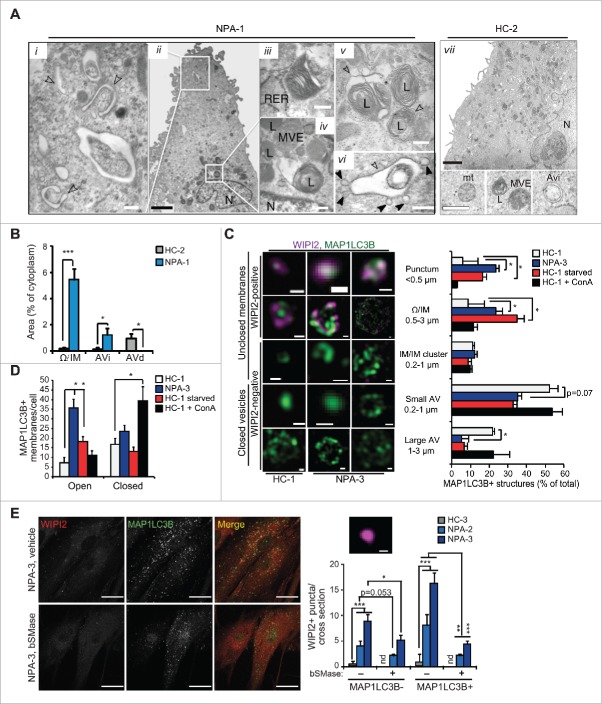
Figure 2. NPA fibroblasts accumulate unclosed autophagic membranes. (A) Representative TEM images of NPA-1 (i to vi) and HC-2 (vii) fibroblasts. Black arrowheads indicate small vesicles in contact with an outer membrane of AVi (vi). Insets in (vii) show representative images of a normal AVi, lysosome (L), multivesicular endososome (MVE) and mitochondrion (mt) in HC-2 fibroblasts. N, nucleus; RER, rough ER. White scale bars: 0.2 µm (i, iii to vi) or 0.5 µm (vii). Black scale bars: 2 µm. (B) Quantification of the cytoplasmic area covered by the indicated autophagic structures in TEM sections of HC-2 and NPA-1 fibroblasts. Bars, SD for 15 randomly chosen cross-sections from 2 independent blocks. Ω/IM, omegasomes and phagophores. (C and D) Representative super resolution SIM images of the indicated MAP1LC3B-positive autophagic membranes in HC-1 and NPA-3 fibroblasts stained for MAP1LC3B and WIPI2 (C, left) and their relative (C, right) and absolute (D) quantification. When indicated, cells were starved in HBSS plus 1 g/L glucose for 2 h or treated with 2 nM ConA for 4 h. Bars, SEM for 4 (HC-1), 10 (NPA-3) or 6 (HC-1, starved and ConA) randomly chosen stacks with 1 to 5 cells each. Scale bars: 0.2 µm. See also 3D reconstructions of a typical omegasome (Movie 1) and tubular phagophore (Movie 2) in starved HC-3 cells and compact (Movie 3) and diffuse (Movie 4) phagophores in NPA-3 cells. (E) Representative confocal images of NPA-3 fibroblasts treated with vehicle (−) or 5 µg/ml/24 h bSMase (+) for 48 h and stained for WIPI2 and MAP1LC3B (left), and quantification of puncta in similarly treated NPA-2 and NPA-3 fibroblasts (right). HC-3 control cells are shown as a negative control. Super resolution 3D-SIM image shows a typical WIPI2-positive puncta in NPA fibroblasts. Bars, SEM for a representative experiment with >20 cells/sample (n = 2). Scale bars: 20 µm (left) and 0.2 µm (right). *, P < 0.05; **, P < 0.01; ***, P < 0.001 by the Student t test.
Figure 2. NPA fibroblasts accumulate unclosed autophagic membranes. (A) Representative TEM images of NPA-1 (i to vi) and HC-2 (vii) fibroblasts. Black arrowheads indicate small vesicles in contact with an outer membrane of AVi (vi). Insets in (vii) show representative images of a normal AVi, lysosome (L), multivesicular endososome (MVE) and mitochondrion (mt) in HC-2 fibroblasts. N, nucleus; RER, rough ER. White scale bars: 0.2 µm (i, iii to vi) or 0.5 µm (vii). Black scale bars: 2 µm. (B) Quantification of the cytoplasmic area covered by the indicated autophagic structures in TEM sections of HC-2 and NPA-1 fibroblasts. Bars, SD for 15 randomly chosen cross-sections from 2 independent blocks. Ω/IM, omegasomes and phagophores. (C and D) Representative super resolution SIM images of the indicated MAP1LC3B-positive autophagic membranes in HC-1 and NPA-3 fibroblasts stained for MAP1LC3B and WIPI2 (C, left) and their relative (C, right) and absolute (D) quantification. When indicated, cells were starved in HBSS plus 1 g/L glucose for 2 h or treated with 2 nM ConA for 4 h. Bars, SEM for 4 (HC-1), 10 (NPA-3) or 6 (HC-1, starved and ConA) randomly chosen stacks with 1 to 5 cells each. Scale bars: 0.2 µm. See also 3D reconstructions of a typical omegasome (Movie 1) and tubular phagophore (Movie 2) in starved HC-3 cells and compact (Movie 3) and diffuse (Movie 4) phagophores in NPA-3 cells. (E) Representative confocal images of NPA-3 fibroblasts treated with vehicle (−) or 5 µg/ml/24 h bSMase (+) for 48 h and stained for WIPI2 and MAP1LC3B (left), and quantification of puncta in similarly treated NPA-2 and NPA-3 fibroblasts (right). HC-3 control cells are shown as a negative control. Super resolution 3D-SIM image shows a typical WIPI2-positive puncta in NPA fibroblasts. Bars, SEM for a representative experiment with >20 cells/sample (n = 2). Scale bars: 20 µm (left) and 0.2 µm (right). *, P < 0.05; **, P < 0.01; ***, P < 0.001 by the Student t test.CC BY-NC · PubMed Central
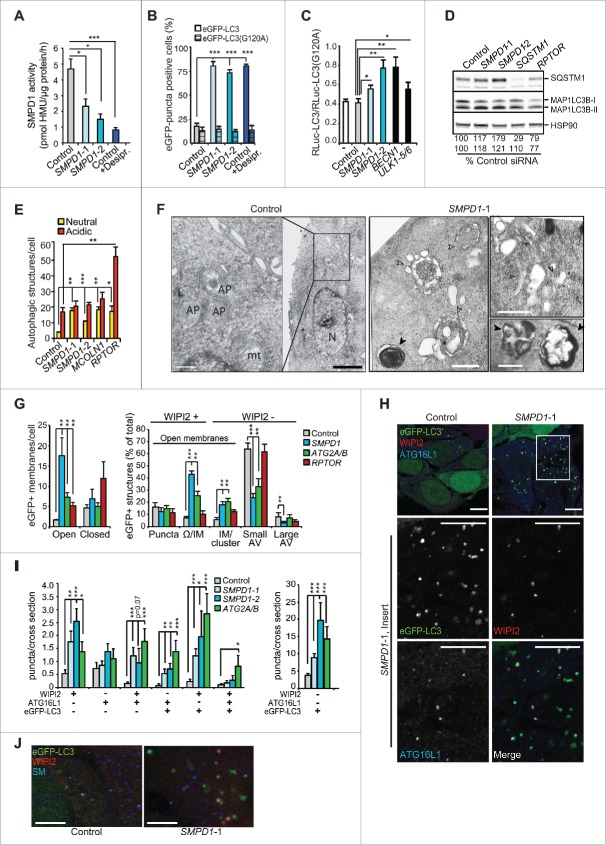
Figure 3 SMPD1 depletion impairs autophagosome closure in MCF7 cells. (A) SMPD1 activity in lysates of MCF7 cells transfected with the indicated siRNAs. Desipramine (25 µM for 1 h) served as a control for SMPD1 inhibition. (B) eGFP-puncta formation in MCF7-eGFP-LC3 cells transfected with the indicated siRNAs. Lipidation-defective mutant eGFP-LC3G120A served as a negative control. Quantification of cells with a minimum of 5 (eGFP-LC3) or one (LC3G120A) puncta are shown. Desipramine (25 µM for 6 h) served as a control. (C) Autophagic flux assessed by comparing the ratios of luciferase activities in lysates of MCF7-RLuc-LC3 and MCF7-RLuc-LC3G120A cells transfected with the indicated siRNAs. BECN1/Beclin 1 and ULK1 siRNAs served as positive controls for autophagy inhibition. (D) Representative immunoblots of the indicated proteins extracted from MCF7 cells transfected with the indicated siRNAs. RPTOR and SQSTM1 siRNAs served as positive controls for enhanced autophagic flux and SQSTM1 immunoblot, respectively, and HSP90 staining was used as a loading control. SQSTM1:HSP90 (upper row) and MAP1LCB3-II:HSP90 (lower row) ratios as a percentage of the ratio in control siRNA-treated cells are shown below. (E) Quantification of fluorescent puncta corresponding to neutral (yellow) and acidic (red) autophagic structures in MCF7-tfLC3 cells transfected with the indicated siRNAs. MCOLN1 (mucolipin 1) and RPTOR/raptor siRNAs served as controls for inhibited and enhanced autophagic flux, respectively.54,63 (F) Representative TEM images of MCF7 cells transfected with the indicated siRNAs. Arrowheads indicate elongated phagophores and swollen autophagosomes (open) and lamellar lysosomes (closed). AP, autophagosome; mt, mitochondria; N, nucleus. (G) Quantification of the indicated eGFP-positive membranes in MCF7-eGFP-LC3 cells transfected as indicated, stained for WIPI2 and analyzed by super resolution 3D-SIM. ATG2A/B and RPTOR siRNAs served as controls for disturbed and normal autophagy, respectively. (H and I) Representative confocal images (H) and quantification (I) of autophagic puncta in MCF7-eGFP-LC3 cells transfected with the indicated siRNAs and stained for WIPI2 and ATG16L1. Insert in the SMPD1-1 panel is enlarged and individual channels are shown in black and white, and the merged image in color. ATG2A/B siRNA served as a positive control for disturbed maturation of autophagic membranes. (J) Representative confocal images of MCF7 cells transfected with the indicated siRNAs and stained with LC3, WIPI2 and SM. Scale bars: 0.5 µm (F, white), 2 µm (F, black), or 10 µm (H and J). Bars, SD for 3 independent experiments (b,c,e), or a representative (n = 3) quadruplicate experiment (A), or SEM for 5–7 randomly chosen stacks with 2 to 10 cells/stack (G) or for ≥ 18 randomly chosen cells (H). *, P < 0.05; **, P < 0.01; ***, P < 0.001 by the Student t test. See also Fig. S1.
Figure 3 SMPD1 depletion impairs autophagosome closure in MCF7 cells. (A) SMPD1 activity in lysates of MCF7 cells transfected with the indicated siRNAs. Desipramine (25 µM for 1 h) served as a control for SMPD1 inhibition. (B) eGFP-puncta formation in MCF7-eGFP-LC3 cells transfected with the indicated siRNAs. Lipidation-defective mutant eGFP-LC3G120A served as a negative control. Quantification of cells with a minimum of 5 (eGFP-LC3) or one (LC3G120A) puncta are shown. Desipramine (25 µM for 6 h) served as a control. (C) Autophagic flux assessed by comparing the ratios of luciferase activities in lysates of MCF7-RLuc-LC3 and MCF7-RLuc-LC3G120A cells transfected with the indicated siRNAs. BECN1/Beclin 1 and ULK1 siRNAs served as positive controls for autophagy inhibition. (D) Representative immunoblots of the indicated proteins extracted from MCF7 cells transfected with the indicated siRNAs. RPTOR and SQSTM1 siRNAs served as positive controls for enhanced autophagic flux and SQSTM1 immunoblot, respectively, and HSP90 staining was used as a loading control. SQSTM1:HSP90 (upper row) and MAP1LCB3-II:HSP90 (lower row) ratios as a percentage of the ratio in control siRNA-treated cells are shown below. (E) Quantification of fluorescent puncta corresponding to neutral (yellow) and acidic (red) autophagic structures in MCF7-tfLC3 cells transfected with the indicated siRNAs. MCOLN1 (mucolipin 1) and RPTOR/raptor siRNAs served as controls for inhibited and enhanced autophagic flux, respectively.54,63 (F) Representative TEM images of MCF7 cells transfected with the indicated siRNAs. Arrowheads indicate elongated phagophores and swollen autophagosomes (open) and lamellar lysosomes (closed). AP, autophagosome; mt, mitochondria; N, nucleus. (G) Quantification of the indicated eGFP-positive membranes in MCF7-eGFP-LC3 cells transfected as indicated, stained for WIPI2 and analyzed by super resolution 3D-SIM. ATG2A/B and RPTOR siRNAs served as controls for disturbed and normal autophagy, respectively. (H and I) Representative confocal images (H) and quantification (I) of autophagic puncta in MCF7-eGFP-LC3 cells transfected with the indicated siRNAs and stained for WIPI2 and ATG16L1. Insert in the SMPD1-1 panel is enlarged and individual channels are shown in black and white, and the merged image in color. ATG2A/B siRNA served as a positive control for disturbed maturation of autophagic membranes. (J) Representative confocal images of MCF7 cells transfected with the indicated siRNAs and stained with LC3, WIPI2 and SM. Scale bars: 0.5 µm (F, white), 2 µm (F, black), or 10 µm (H and J). Bars, SD for 3 independent experiments (b,c,e), or a representative (n = 3) quadruplicate experiment (A), or SEM for 5–7 randomly chosen stacks with 2 to 10 cells/stack (G) or for ≥ 18 randomly chosen cells (H). *, P < 0.05; **, P < 0.01; ***, P < 0.001 by the Student t test. See also Fig. S1.CC BY-NC · PubMed Central
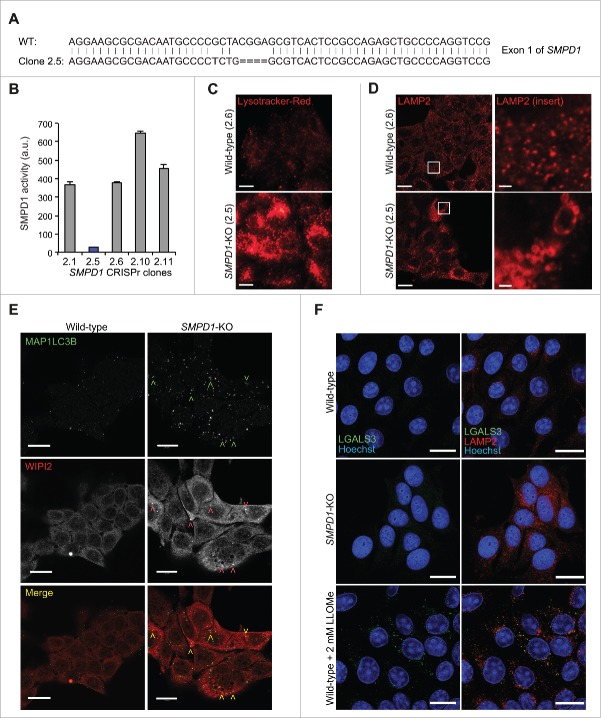
Figure 4. SMPD1-deficient MCF7 cells accumulate early autophagic membranes. (A) Sequence of SMPD1 exon1 in wild-type (WT) MCF7 cells and CRISPr-Cas9 clone 2.5. (B) Total SMPD1 activity in lysates of single cell clones of MCF7 cells transfected with SMPD1 guide-RNA. Bars, SD for a representative triplicate experiment. (C) Representative images of clones 2.6 (wild type) and 2.5 (SMPD1-KO) stained with 50 nM LysoTracker Red for 5 min were acquired by an epifluorescence microscope using Cellˆp software (Olympus). (D to F) Representative images of wild-type and SMPD1-KO MCF7 cells stained for LAMP2 (D), MAP1LC3B (green) and WIPI2 (red) (E), or LGALS3 (green) and LAMP2 (red) (F) were acquired by confocal laser scanning microscope 510 using Zen2009 software (Zeiss). When indicated, cells were treated with 2 mM LLOMe as a positive control for lysosomal membrane permeabilization and LGALS3 puncta formation (F). Scale bars: 20 µm ((C)to F) and 2 µm for inserts in (D).
Figure 4. SMPD1-deficient MCF7 cells accumulate early autophagic membranes. (A) Sequence of SMPD1 exon1 in wild-type (WT) MCF7 cells and CRISPr-Cas9 clone 2.5. (B) Total SMPD1 activity in lysates of single cell clones of MCF7 cells transfected with SMPD1 guide-RNA. Bars, SD for a representative triplicate experiment. (C) Representative images of clones 2.6 (wild type) and 2.5 (SMPD1-KO) stained with 50 nM LysoTracker Red for 5 min were acquired by an epifluorescence microscope using Cellˆp software (Olympus). (D to F) Representative images of wild-type and SMPD1-KO MCF7 cells stained for LAMP2 (D), MAP1LC3B (green) and WIPI2 (red) (E), or LGALS3 (green) and LAMP2 (red) (F) were acquired by confocal laser scanning microscope 510 using Zen2009 software (Zeiss). When indicated, cells were treated with 2 mM LLOMe as a positive control for lysosomal membrane permeabilization and LGALS3 puncta formation (F). Scale bars: 20 µm ((C)to F) and 2 µm for inserts in (D).CC BY-NC · PubMed Central
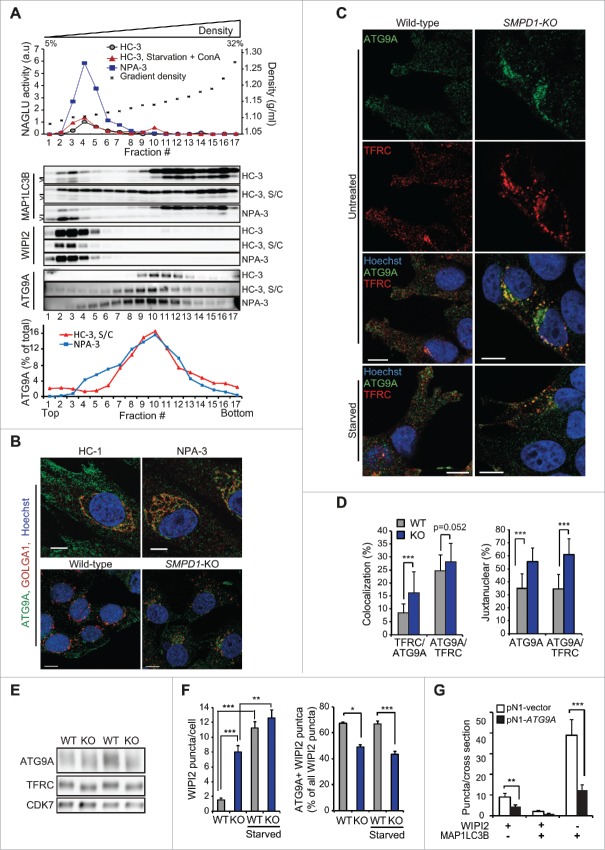
Figure 5 Altered trafficking of ATG9A in SMPD1-deficient cells. (A) NAGLU activities (top), indicated immunoblots (middle) and ATG9A distribution profiles of density gradient fractions of postnuclear supernatant fractions from HC-3 and NPA-3 fibroblasts (bottom). When indicated, HC-3 fibroblasts were starved in HBSS plus 1 g/L glucose and treated with 2 nM ConA for 2 h (S/C). The migration of MAP1LC3B-I and MAP1LC3B-II are marked with a line and greater-than symbol, respectively. ATG9A distribution in fractions is expressed as percentage of the total ATG9A in all fractions as quantified by densitometry and ImageJ software. See figures S2A and B for additional data. (B and C) Representative confocal images of HC-1 and NPA-3 fibroblasts and CRISPr-Cas-9 wild-type (WT) and SMPD1-KO (KO) MCF7 cells stained as indicated. When indicated, cells were starved in HBSS plus 1 g/L glucose for 2 h. Step size, 300 nm. See figures S2C and D for additional staining. (D) Manders coefficients for colocalization of TFRC with ATG9A and vice versa (left), and percentages of ATG9A and colocalized ATG9A-TFRC in the juxtanuclear area (4 µm from nucleus) in WT and KO cells. Bars, SEM for 20 randomly chosen cells. (E) Representative immunoblots of the indicated proteins in lysates of WT and KO cells. (F) Quantification of the number of WIPI2 puncta/cell (top) and the percentage of ATG9A-positive WIPI2 puncta of all WIPI2 puncta (bottom) in WT and KO cells. Bars, SEM for 20 randomly chosen cells (top) or 4–10 randomly chosen stacks with 2 to 9 cells/stack (bottom). Representative confocal images are shown in Fig. S2E. (G) Quantification of the number of WIPI2 and MAP1LCB3 puncta in MCF7 SMPD1-KO (KO) cells successfully transfected (green) with pN1 vector or pN1-ATG9A plasmids and stained 48 h later for WIPI2 and LC3. Bars, SEM 4 to 8 randomly chosen stacks with 2 to 9 cells/stack. Representative confocal images are shown in Fig. S2F. Scale bars: 10 µm. *, P < 0.05; **, P < 0.01; ***, P < 0.001 by the Student t test.
Figure 5 Altered trafficking of ATG9A in SMPD1-deficient cells. (A) NAGLU activities (top), indicated immunoblots (middle) and ATG9A distribution profiles of density gradient fractions of postnuclear supernatant fractions from HC-3 and NPA-3 fibroblasts (bottom). When indicated, HC-3 fibroblasts were starved in HBSS plus 1 g/L glucose and treated with 2 nM ConA for 2 h (S/C). The migration of MAP1LC3B-I and MAP1LC3B-II are marked with a line and greater-than symbol, respectively. ATG9A distribution in fractions is expressed as percentage of the total ATG9A in all fractions as quantified by densitometry and ImageJ software. See figures S2A and B for additional data. (B and C) Representative confocal images of HC-1 and NPA-3 fibroblasts and CRISPr-Cas-9 wild-type (WT) and SMPD1-KO (KO) MCF7 cells stained as indicated. When indicated, cells were starved in HBSS plus 1 g/L glucose for 2 h. Step size, 300 nm. See figures S2C and D for additional staining. (D) Manders coefficients for colocalization of TFRC with ATG9A and vice versa (left), and percentages of ATG9A and colocalized ATG9A-TFRC in the juxtanuclear area (4 µm from nucleus) in WT and KO cells. Bars, SEM for 20 randomly chosen cells. (E) Representative immunoblots of the indicated proteins in lysates of WT and KO cells. (F) Quantification of the number of WIPI2 puncta/cell (top) and the percentage of ATG9A-positive WIPI2 puncta of all WIPI2 puncta (bottom) in WT and KO cells. Bars, SEM for 20 randomly chosen cells (top) or 4–10 randomly chosen stacks with 2 to 9 cells/stack (bottom). Representative confocal images are shown in Fig. S2E. (G) Quantification of the number of WIPI2 and MAP1LCB3 puncta in MCF7 SMPD1-KO (KO) cells successfully transfected (green) with pN1 vector or pN1-ATG9A plasmids and stained 48 h later for WIPI2 and LC3. Bars, SEM 4 to 8 randomly chosen stacks with 2 to 9 cells/stack. Representative confocal images are shown in Fig. S2F. Scale bars: 10 µm. *, P < 0.05; **, P < 0.01; ***, P < 0.001 by the Student t test.CC BY-NC · PubMed Central
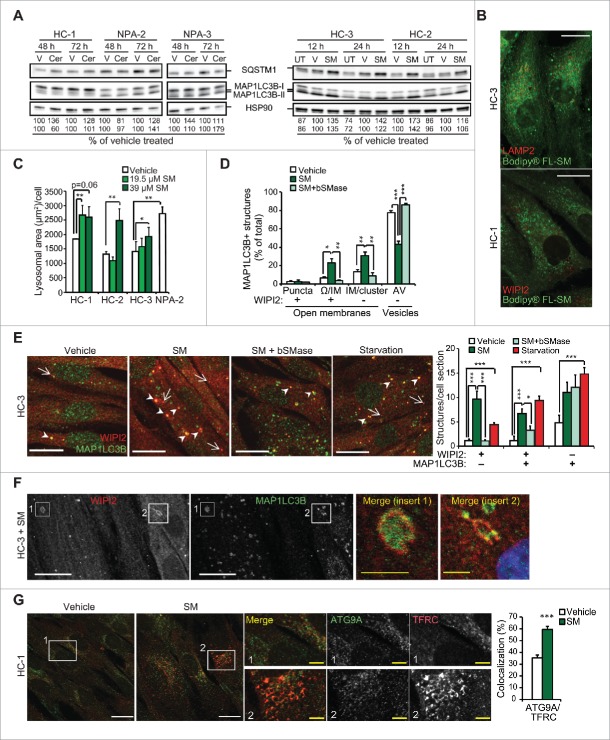
Figure 6. Exogenous SM phenocopies NPA-associated lysosomal and autophagic pathologies. (A) Representative SQSTM1, MAP1LCB3-I and MAP1LCB3-II immunoblots of protein lysates from the indicated fibroblasts left untreated (UT) or treated with DMSO vehicle (V), 3 µM C16-ceramide (Cer) or 39 µM C12-SM (SM) for the indicated times. HSP90 served as a loading control. SQSTM1:HSP90 (upper row) and MAP1LCB3-II:HSP90 (lower row) ratios as a percentage of the ratio in vehicle-treated cells from the same individual are shown below. (B) Representative confocal images of the HC-3 (top) and HC-1 (bottom) fibroblasts treated with 39 µM of BODIPY® C12-SM (green) for 12 h and stained for LAMP2 and WIPI2 (red), respectively. Note juxtanuclear mainly accumulation of BODIPY-FL® C12-SM and lack of colocalization with either LAMP2 or WIPI2. Step size, 1 µm. (C) Lysosomal areas in the indicated fibroblasts treated for 12 h with vehicle (V) or 19.5 or 39 µM C12-SM (SM) were measured with Celigo® adherent cell cytometer after staining with LysoTracker®Red and Hoechst. Bars, SEM for a representative duplicate experiment (n = 3). (D) Quantification of the indicated autophagic membranes in HC-1 cells treated with vehicle or 39 µM C12-SM for 24 h with or without 10 µg/ml bSMase for the last 12 h, stained for WIPI2 and LC3, and analyzed by super resolution 3D-SIM. Bars, SEM for a representative experiment with 4 fields analyzed (n = 3). (E) Representative confocal images of HC-3 control fibroblasts treated and stained as in (D) (left), and quantification of WIPI2 and MAP1LC3B puncta (right; n ≥ 20). HC-3 fibroblasts starved for amino acids by 2 h treatment with HBSS plus 1 g/L glucose served as a positive control. White arrows and arrowheads indicate WIPI2-positive/MAP1LC3B-negative (red) and double-positive (yellow) structures, respectively. Similar data were obtained with fibroblasts from another healthy individual. (F) Representative confocal images of HC-3 fibroblasts treated with 39 µM C12-SM for 24 h and stained for WIPI2 and MAP1LC3B. Close-ups show a typical omegasome- (1) and phagophore membrane (2). (G) Representative confocal images of HC-1 fibroblasts treated with vehicle or 39 µM C12-SM for 12 h and stained for ATG9A and TFRC. Close-ups demonstrate the perinuclear colocalization of ATG9A and TFRC and the histogram shows Manders coefficients for the colocalization. Bars, SEM for minimum 20 randomly chosen cells. C16-SM induced a similar increase in the colocalization of ATG9A and TFRC (Fig. S3). Scale bars: 20 µm (white) or 2 µm (yellow). *, P < 0.05; **, P < 0.01; ***, P < 0.001 by the Student t test.
Figure 6. Exogenous SM phenocopies NPA-associated lysosomal and autophagic pathologies. (A) Representative SQSTM1, MAP1LCB3-I and MAP1LCB3-II immunoblots of protein lysates from the indicated fibroblasts left untreated (UT) or treated with DMSO vehicle (V), 3 µM C16-ceramide (Cer) or 39 µM C12-SM (SM) for the indicated times. HSP90 served as a loading control. SQSTM1:HSP90 (upper row) and MAP1LCB3-II:HSP90 (lower row) ratios as a percentage of the ratio in vehicle-treated cells from the same individual are shown below. (B) Representative confocal images of the HC-3 (top) and HC-1 (bottom) fibroblasts treated with 39 µM of BODIPY® C12-SM (green) for 12 h and stained for LAMP2 and WIPI2 (red), respectively. Note juxtanuclear mainly accumulation of BODIPY-FL® C12-SM and lack of colocalization with either LAMP2 or WIPI2. Step size, 1 µm. (C) Lysosomal areas in the indicated fibroblasts treated for 12 h with vehicle (V) or 19.5 or 39 µM C12-SM (SM) were measured with Celigo® adherent cell cytometer after staining with LysoTracker®Red and Hoechst. Bars, SEM for a representative duplicate experiment (n = 3). (D) Quantification of the indicated autophagic membranes in HC-1 cells treated with vehicle or 39 µM C12-SM for 24 h with or without 10 µg/ml bSMase for the last 12 h, stained for WIPI2 and LC3, and analyzed by super resolution 3D-SIM. Bars, SEM for a representative experiment with 4 fields analyzed (n = 3). (E) Representative confocal images of HC-3 control fibroblasts treated and stained as in (D) (left), and quantification of WIPI2 and MAP1LC3B puncta (right; n ≥ 20). HC-3 fibroblasts starved for amino acids by 2 h treatment with HBSS plus 1 g/L glucose served as a positive control. White arrows and arrowheads indicate WIPI2-positive/MAP1LC3B-negative (red) and double-positive (yellow) structures, respectively. Similar data were obtained with fibroblasts from another healthy individual. (F) Representative confocal images of HC-3 fibroblasts treated with 39 µM C12-SM for 24 h and stained for WIPI2 and MAP1LC3B. Close-ups show a typical omegasome- (1) and phagophore membrane (2). (G) Representative confocal images of HC-1 fibroblasts treated with vehicle or 39 µM C12-SM for 12 h and stained for ATG9A and TFRC. Close-ups demonstrate the perinuclear colocalization of ATG9A and TFRC and the histogram shows Manders coefficients for the colocalization. Bars, SEM for minimum 20 randomly chosen cells. C16-SM induced a similar increase in the colocalization of ATG9A and TFRC (Fig. S3). Scale bars: 20 µm (white) or 2 µm (yellow). *, P < 0.05; **, P < 0.01; ***, P < 0.001 by the Student t test.CC BY-NC · PubMed Central
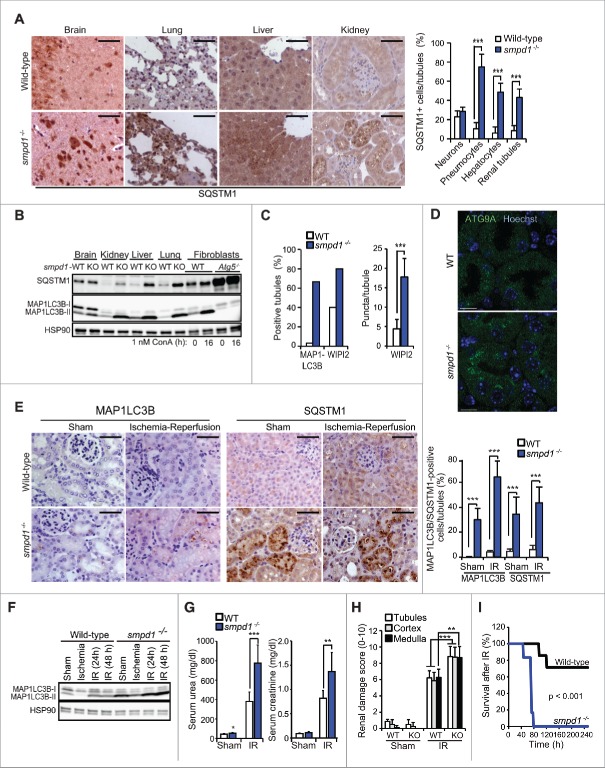
Figure 7. smpd1−/− mice have defective autophagic flux and increased sensitivity to renal IR injury. (A) Representative images (left) and quantification (right) of SQSTM1 staining in tissues from wild-type (WT) and smpd1−/− mice. (B) Representative SQSTM1 and MAP1LC3B immunoblots of extracts from the tissues in (A). Extracts of WT and atg5−/− murine embryonic fibroblasts left untreated or treated with ConA served as controls. HSP90 served as a loading control. (C) Quantification of MAP1LC3B- and WIPI2-puncta positive tubules (>5 puncta/tubule) and WIPI2 puncta/tubule in kidneys from the indicated mice stained for MAP1LC3B and WIPI2 and analyzed by confocal microscopy. Confocal images of MAP1LC3B- and WIPI2-stained kidney sections are shown in Fig. S4. (D) Representative confocal projections of 5-µm thick areas of kidney sections from the indicated mice stained for ATG9A and DNA (Hoechst). (E) Representative images (left) and quantifications (right) of cells with punctuate MAP1LC3B staining and high intensity SQSTM1 immunostainings of paraffin sections of kidneys of the indicated mice exposed to a sham operation or 30 min ischemia followed by a 48 h reperfusion period. (F) Representative MAP1LC3B immunoblot of protein extracts from kidneys of wild-type (WT) and smpd1−/− mice exposed to a sham operation or 30 min ischemia followed by a 24 or 48 h reperfusion period (IR). HSP90 served as a loading control. (G) Serum urea (left) and creatinine (right) levels in the indicated mice treated as in (F). (H) Quantification of renal damage scores (right) of paraffin sections of kidneys from mice treated as in (E) and stained with periodic acid-Schiff (PAS) reagent. (I) Kaplan-Meyer survival plots for WT (n=7) and KO (n=6) mice exposed to a sham operation or 35 min renal ischemia followed by a 240-h reperfusion period. Scale bars: 10 µm (D) or 100 µm (A, E). Bars, SD for 4 independent sections (A), SEM for 52 wild-type and 45 smpd1−/− kidney tubules (C), or SD for 4 sham-operated mice and 8 (E) or 7 (G, H) IR-treated mice/group. *, P < 0.05; **, P < 0.01; ***, P < 0.001 by the Student t test.
Figure 7. smpd1−/− mice have defective autophagic flux and increased sensitivity to renal IR injury. (A) Representative images (left) and quantification (right) of SQSTM1 staining in tissues from wild-type (WT) and smpd1−/− mice. (B) Representative SQSTM1 and MAP1LC3B immunoblots of extracts from the tissues in (A). Extracts of WT and atg5−/− murine embryonic fibroblasts left untreated or treated with ConA served as controls. HSP90 served as a loading control. (C) Quantification of MAP1LC3B- and WIPI2-puncta positive tubules (>5 puncta/tubule) and WIPI2 puncta/tubule in kidneys from the indicated mice stained for MAP1LC3B and WIPI2 and analyzed by confocal microscopy. Confocal images of MAP1LC3B- and WIPI2-stained kidney sections are shown in Fig. S4. (D) Representative confocal projections of 5-µm thick areas of kidney sections from the indicated mice stained for ATG9A and DNA (Hoechst). (E) Representative images (left) and quantifications (right) of cells with punctuate MAP1LC3B staining and high intensity SQSTM1 immunostainings of paraffin sections of kidneys of the indicated mice exposed to a sham operation or 30 min ischemia followed by a 48 h reperfusion period. (F) Representative MAP1LC3B immunoblot of protein extracts from kidneys of wild-type (WT) and smpd1−/− mice exposed to a sham operation or 30 min ischemia followed by a 24 or 48 h reperfusion period (IR). HSP90 served as a loading control. (G) Serum urea (left) and creatinine (right) levels in the indicated mice treated as in (F). (H) Quantification of renal damage scores (right) of paraffin sections of kidneys from mice treated as in (E) and stained with periodic acid-Schiff (PAS) reagent. (I) Kaplan-Meyer survival plots for WT (n=7) and KO (n=6) mice exposed to a sham operation or 35 min renal ischemia followed by a 240-h reperfusion period. Scale bars: 10 µm (D) or 100 µm (A, E). Bars, SD for 4 independent sections (A), SEM for 52 wild-type and 45 smpd1−/− kidney tubules (C), or SD for 4 sham-operated mice and 8 (E) or 7 (G, H) IR-treated mice/group. *, P < 0.05; **, P < 0.01; ***, P < 0.001 by the Student t test.CC BY-NC · PubMed Central

Verification

Claims the paper makes

The claims and statistics of this paper haven’t been checked yet.

Run the check — free, no account needed. It reads the open-access text and checks the sources it cites.

A few free checks a day · papers already verified open instantly · results are public

Claims other papers make about this one

Each is checked against this paper’s own text: does it say what the citing paper says it does?

Self-check

Percentages, sums and reported differences re-computed from the paper’s own numbers.

The self-check needs the paper’s full text.

Citations

Cites

Show all 12 references

Research works printed but not linked: 51

  1. 10.1038/nrm3696 · DOI
  2. 10.1016/j.molcel.2014.05.021 · DOI
  3. 10.1083/jcb.201111079 · DOI
  4. 10.1016/j.cell.2013.08.044 · DOI
  5. 10.1091/mbc.E11-09-0785 · DOI
  6. 10.1016/j.plipres.2013.05.001 · DOI
  7. 10.1038/42408 · DOI · Paper page
  8. 10.1074/jbc.M111.228593 · DOI
  9. 10.1038/emboj.2012.317 · DOI
  10. 10.1111/j.1600-0854.2006.00456.x · DOI
  11. 10.1073/pnas.1115484108 · DOI
  12. 10.1016/j.ccr.2013.08.003 · DOI
  13. Schuchman EH, 2009, Int J Clin Pharmacol Ther, 47, S48
  14. 10.1007/s00109-014-1120-y · DOI
  15. 10.1038/cdd.2014.4 · DOI
  16. 10.4161/auto.5774 · DOI · Paper page
  17. 10.1038/sj.cdd.4400775 · DOI
  18. May WS, 1987, J Biol Chem, 262, 16710, 10.1016/S0021-9258(18)49313-1 · DOI
  19. 10.1128/MCB.00740-14 · DOI
  20. 10.2353/ajpath.2010.090594 · DOI
  21. 10.1681/ASN.2010070705 · DOI · Paper page
  22. 10.1091/mbc.E11-09-0746 · DOI
  23. 10.1101/gr.082214.108 · DOI
  24. 10.1111/cmi.12329 · DOI
  25. 10.1091/mbc.11.8.2775 · DOI
  26. 10.1159/000315101 · DOI
  27. Hunt RC, 1986, J Biol Chem, 261, 3681, 10.1016/S0021-9258(17)35701-0 · DOI
  28. 10.1080/15548627.2015.1063871 · DOI
  29. 10.1038/nature06639 · DOI · Paper page
  30. 10.1016/S0344-0338(97)80025-8 · DOI
  31. 10.1002/hep.21285 · DOI
  32. 10.4161/auto.5.3.7650 · DOI
  33. 10.1111/j.1582-4934.2004.tb00469.x · DOI
  34. 10.1038/nm1539 · DOI
  35. 10.1194/jlr.M022384 · DOI
  36. Jäättelä M, 1995, Oncogene, 10, 2297
  37. 10.1016/j.molcel.2006.12.009 · DOI · Paper page
  38. 10.4161/auto.7.8.15770 · DOI · Paper page
  39. 10.4161/auto.5.7.9443 · DOI
  40. 10.1126/science.1232033 · DOI · Paper page
  41. 10.1100/tsw.2002.285 · DOI
  42. 10.4161/auto.22831 · DOI
  43. 10.1093/hmg/ddn174 · DOI
  44. 10.1101/gad.305405 · DOI
  45. 10.1074/jbc.M413957200 · DOI
  46. Changou CA, 2013, J Vis Exp, e50047
  47. Beneduci A, 2005, Anticancer Res, 25, 1009
  48. 10.1038/ng0795-288 · DOI
  49. 10.1038/ki.2011.450 · DOI
  50. 10.1038/ki.2010.317 · DOI
  51. 10.4161/auto.7.8.15770 · DOI · Paper page

Cited by

Sorted by citations

See all 64

Metadata

Authors
Corcelle-Termeau, E., Vindeløv, S. D., Hämälistö, S., Mograbi, B., Keldsbo, A., Bräsen, J. H., Favaro, E., Adam, D., Szyniarowski, P., Hofman, P., Krautwald, S., Farkas, T., Petersen, N. H. T., Rohde, M., Linkermann, A., & Jäättelä, M.
Venue
Autophagy
Published
2016-04-12
Volume
12
Issue
5
Pages
833-849
ISSN
  • 1554-8627
  • 1554-8635
Cited by
64
References
12
Language
en

About these checks

Registry, retraction, Cites and statistics results are computed, not judged, with one exception: a printed reference that no index lists is read once by a model before it counts as a citation error. Claims are extracted by a model and kept only when their quote appears verbatim in the text; each cited source is then checked, with a model’s help, for whether it says what the claim relies on. Those verdicts can be wrong — read the claim’s quote and the cited source before relying on one.

Statistics and arithmetic are recomputed, not judged.

Confidence bands are shown only for fields calibrated on our annotated test set. None is calibrated yet, so no band is shown.

What counts as a claim ›How we measure confidence ›How we check this ›

Are you an author, or do you see a problem with this page? Request a review

How to cite

Cite CoChat for the checks on this page, and the paper for its own findings.

This page
CoChat. (2026). Citation check: Excess sphingomyelin disturbs ATG9A trafficking and autophagosome closure. https://app.cochat.ai/papers/10.1080/15548627.2016.1159378
The paper
Corcelle-Termeau, E., Vindeløv, S. D., Hämälistö, S., Mograbi, B., Keldsbo, A., Bräsen, J. H., Favaro, E., Adam, D., Szyniarowski, P., Hofman, P., Krautwald, S., Farkas, T., Petersen, N. H. T., Rohde, M., Linkermann, A., & Jäättelä, M. (2016). Excess sphingomyelin disturbs ATG9A trafficking and autophagosome closure. Autophagy. https://doi.org/10.1080/15548627.2016.1159378