

The DOI matches its Crossref record; 6 of the 6 references it cites were found in a registry or an index.
Preferential amplification of repetitive DNA during whole genome sequencing library creation from historic samples
Overview
The claims and statistics of this paper haven’t been checked yet.
Run the check — free, no account needed. It reads the open-access text and checks the sources it cites.
Integrity signals
Registry
Cites
Statistics
Figures


Verification
Claims the paper makes
The claims and statistics of this paper haven’t been checked yet.
Run the check — free, no account needed. It reads the open-access text and checks the sources it cites.
Claims other papers make about this one
Each is checked against this paper’s own text: does it say what the citing paper says it does?
In the citing paper
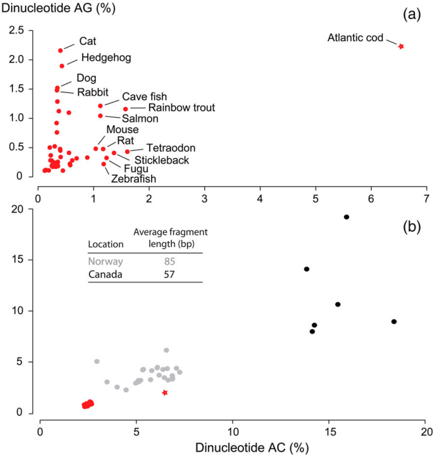
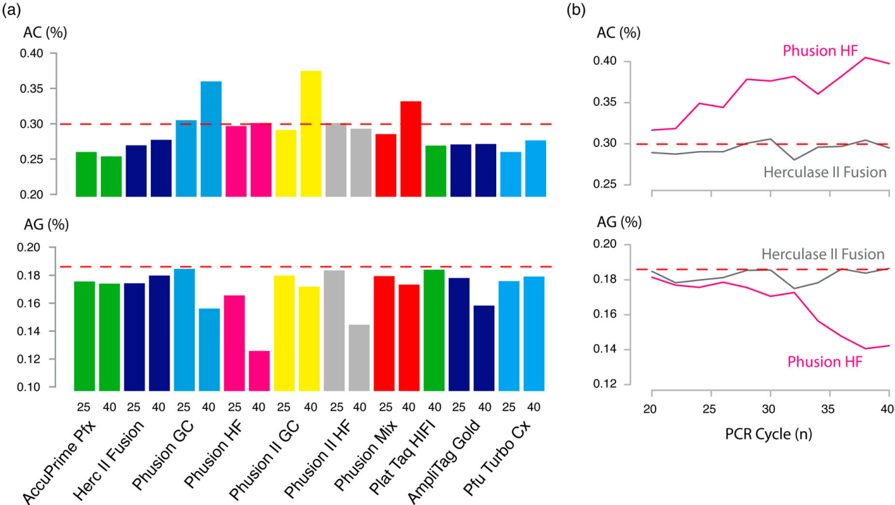
“Atlantic cod (Gadus morhua) has been identified as a vertebrate species with an exceptionally high occurrence of STRs (63,64), in particular AC dinucleotide repeats (62,65).”
From Tandem repeats lead to sequence assembly errors and impose multi-level challenges for genome and protein databases (2019) · cites this paper as [65]
In the citing paper
“Ancient DNA (aDNA) sequencing data from historic Atlantic cod specimens contained inflated STR abundances (up to 35%), which is far beyond the naturally observed levels (65).”
From Tandem repeats lead to sequence assembly errors and impose multi-level challenges for genome and protein databases (2019) · cites this paper as [65]
In the citing paper
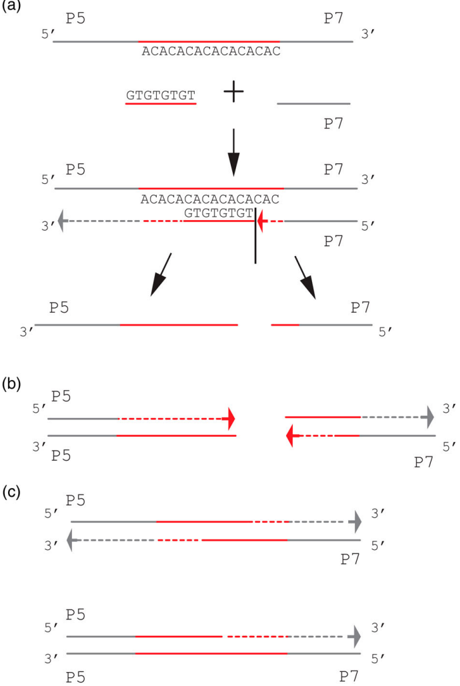
“Although this self-priming appears to be particularly problematic in cod—likely due to its high content of repeats with relatively low sequence complexity (65)—this process also explains the typical PCR fragmentation patterns observed when using transcript-activator like effector (TALE) technology (69).”
From Tandem repeats lead to sequence assembly errors and impose multi-level challenges for genome and protein databases (2019) · cites this paper as [65]
In the citing paper
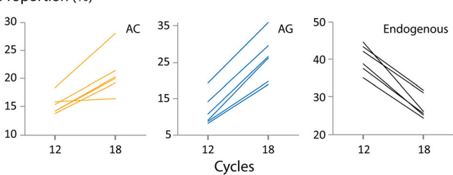
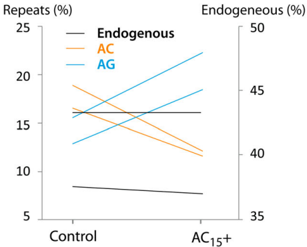
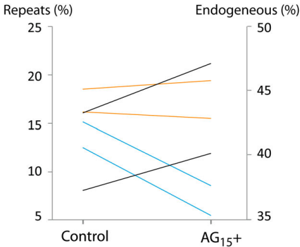
“This inflation can be suppressed by a reduced number of amplification cycles and by the inclusion of synthesized dinucleotide repeat oligonucleotides during amplification.”
From Tandem repeats lead to sequence assembly errors and impose multi-level challenges for genome and protein databases (2019) · cites this paper as [65]
Self-check
Percentages, sums and reported differences re-computed from the paper’s own numbers.
The self-check needs the paper’s full text.
Citations
Cites
A high-coverage genome sequence from an archaic denisovan individual
Meyer, M., Kircher, M., Gansauge, M.-T., Li, H., Racimo, F., Mallick, S., Schraiber, J. G., Jay, F., Prüfer, K., de Filippo, C., et al. (2012) · Science · doi:10.1126/science.1224344 · Cited by 1,967
Ancient human genome sequence of an extinct Palaeo-Eskimo
Rasmussen, M., Li, Y., Lindgreen, S., Pedersen, J. S., Albrechtsen, A., Moltke, I., Metspalu, M., Metspalu, E., Kivisild, T., Gupta, R., et al. (2010) · Nature · doi:10.1038/nature08835 · Cited by 849
An aboriginal Australian genome reveals separate human dispersals into Asia
Rasmussen, M., Guo, X., Wang, Y., Lohmueller, K. E., Rasmussen, S., Albrechtsen, A., Skotte, L., Lindgreen, S., Metspalu, M., Jombart, T., et al. (2011) · Science · doi:10.1126/science.1211177 · Cited by 787
Genome flux and stasis in a five millennium transect of European prehistory
Gamba, C., Jones, E. R., Teasdale, M. D., McLaughlin, R. L., Gonzalez-Fortes, G., Mattiangeli, V., Domboróczki, L., Kővári, I., Pap, I., Anders, A., et al. (2014) · Nature Communications · doi:10.1038/ncomms6257 · Cited by 667
mapDamage: testing for damage patterns in ancient DNA sequences
Ginolhac, A., Rasmussen, M., Gilbert, M. T. P., Willerslev, E., & Orlando, L. (2011) · Bioinformatics · doi:10.1093/bioinformatics/btr347 · Cited by 363
Improving ancient DNA read mapping against modern reference genomes
Schubert, M., Ginolhac, A., Lindgreen, S., Thompson, J. F., AL-Rasheid, K. A., Willerslev, E., Krogh, A., & Orlando, L. (2012) · BMC Genomics · doi:10.1186/1471-2164-13-178 · Cited by 325
Research works printed but not linked: 43
- 10.1186/gb-2011-12-2-r18 · DOI · Paper page
- 10.1098/rsbl.2008.0209 · DOI
- 10.1038/ncomms4657 · DOI
- 10.1007/s12033-009-9230-4 · DOI
- 10.1126/science.1174462 · DOI
- 10.1073/pnas.0704665104 · DOI · Paper page
- 10.1002/bies.20470 · DOI
- 10.1016/S0305-0491(00)00233-9 · DOI
- 10.2144/000113809 · DOI · Paper page
- 10.1111/j.1095-8649.2000.tb00748.x · DOI
- Ellegren Hans, 2004, Nature Reviews Genetics
- 10.1038/emboj.2009.222 · DOI · Paper page
- 10.1016/j.cell.2008.06.021 · DOI
- Grover Atul, 2011, Curr Sci, 100, 859
- 10.1101/gr.135780.111 · DOI
- 10.1038/srep05052 · DOI · Paper page
- 10.1534/genetics.112.144758 · DOI
- 10.1007/s10126-014-9580-1 · DOI · Paper page
- 10.1186/1471-2164-9-612 · DOI
- 10.1038/nature08976 · DOI
- 10.1073/pnas.95.18.10774 · DOI
- 10.1093/bioinformatics/btp324 · DOI · Paper page
- 10.1186/1756-0500-5-337 · DOI
- 10.1093/bib/bbn028 · DOI
- 10.1101/pdb.prot5448 · DOI
- 10.1111/j.0014-3820.2001.tb00822.x · DOI
- 10.1016/j.tibtech.2012.03.007 · DOI
- 10.1146/annurev.genet.37.110801.143214 · DOI · Paper page
- 10.1093/molbev/mss070 · DOI
- 10.1101/gr.163592.113 · DOI · Paper page
- Putman Alexander I., 2014, Ecology and Evolution, 4, 4399, 10.1002/ece3.1305 · DOI
- 10.1093/nar/gks726 · DOI · Paper page
- 10.1093/bioinformatics/btr026 · DOI
- 10.1371/journal.pone.0078575 · DOI · Paper page
- 10.1126/science.1236573 · DOI · Paper page
- 10.1371/journal.pone.0089676 · DOI
- 10.1038/nature10342 · DOI · Paper page
- 10.1093/nar/17.16.6463 · DOI
- 10.1093/nar/12.10.4127 · DOI
- 10.1126/science.1243650 · DOI
- Whittaker John C., 2003, Genetics, 164, 781, 10.1093/genetics/164.2.781 · DOI
- Wierdl Monika, 1997, Genetics, 146, 769, 10.1093/genetics/146.3.769 · DOI
- Witt Kelsey E., 2014, Journal of Human Evolution, 105
Cited by
Sorted by citations
Tørresen, O. K., Star, B., Mier, P., Andrade-Navarro, M. A., Bateman, A., Jarnot, P., Gruca, A., Grynberg, M., Kajava, A. V., Promponas, V. J., et al. (2019) · Nucleic Acids Research · doi:10.1093/nar/gkz841 · Cited by 347
Self-citation
Metadata
- Authors
- Star, B., Hansen, M. H., Skage, M., Bradbury, I. R., Godiksen, J. A., Kjesbu, O. S., & Jentoft, S.
- Venue
- STAR: Science & Technology of Archaeological Research
- Publisher
- Informa UK Limited
- Published
- 2016-01
- Volume
- 2
- Issue
- 1
- Pages
- 36-45
- ISSN
- 2054-8923
- Cited by
- 8
- References
- 6
- Language
- en
About these checks
Registry, retraction, Cites and statistics results are computed, not judged, with one exception: a printed reference that no index lists is read once by a model before it counts as a citation error. Claims are extracted by a model and kept only when their quote appears verbatim in the text; each cited source is then checked, with a model’s help, for whether it says what the claim relies on. Those verdicts can be wrong — read the claim’s quote and the cited source before relying on one.
Statistics and arithmetic are recomputed, not judged.
Confidence bands are shown only for fields calibrated on our annotated test set. None is calibrated yet, so no band is shown.
What counts as a claim ›How we measure confidence ›How we check this ›
Are you an author, or do you see a problem with this page? Request a review
