Cited by 23

The DOI matches its Crossref record; 2 of the 2 references it cites were found in a registry or an index.

Study on tumour cell-derived hybrid exosomes as dasatinib nanocarriers for pancreatic cancer therapy

Zhou, Xiaofei, Zhuang, Yuetang, Liu, Xiaohong, Gu, Yaowen, Wang, Junting, Shi, Yuchen, Zhang, Li, Li, Rui, Zhao, Yelin, Chen, Hebing, Li, Jiao, Yao, Hongjuan, Li, Liang·2023·Artificial Cells, Nanomedicine, and Biotechnology

Overview

The claims and statistics of this paper haven’t been checked yet.

Run the check — free, no account needed. It reads the open-access text and checks the sources it cites.

A few free checks a day · papers already verified open instantly · results are public

Integrity signals

Registry

Crossref · 10.1080/21691401.2023.2264358

Cites

2 of 2 references verified0 citation errors · 0 not checkable

Statistics

Figures

Image 1
CC-BY-NC · From the PDF
Image 2
CC-BY-NC · From the PDF
Image 3
CC-BY-NC · From the PDF
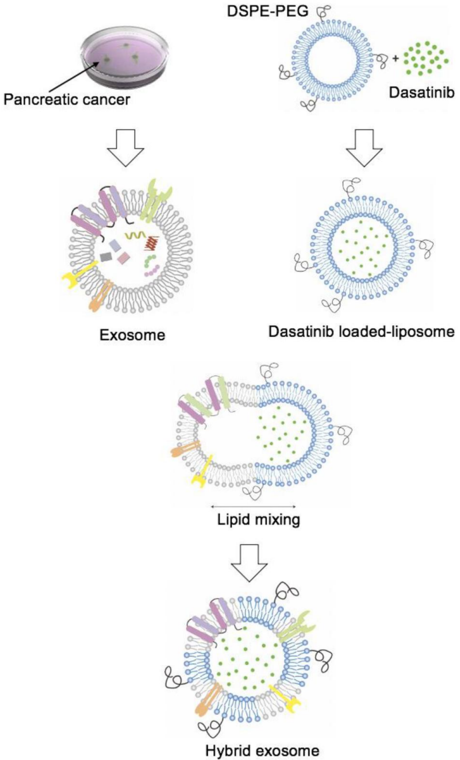
Figure 1 Schematic representation of dasatinib-loaded hybrid exosome con­ struction. Exosomes were collected from cell culture supernatant after 48 h by combination ultracentrifugation with ExoQuick precipitation method. Dasatinib liposomes were prepared by thin film lipid hydration followed by sonication and extrusion. Exosomes were fused with dasatinib-liposomes via 10 freezethaw cycles.
Figure 1 Schematic representation of dasatinib-loaded hybrid exosome con­ struction. Exosomes were collected from cell culture supernatant after 48 h by combination ultracentrifugation with ExoQuick precipitation method. Dasatinib liposomes were prepared by thin film lipid hydration followed by sonication and extrusion. Exosomes were fused with dasatinib-liposomes via 10 freezethaw cycles.CC-BY-NC · From the PDF
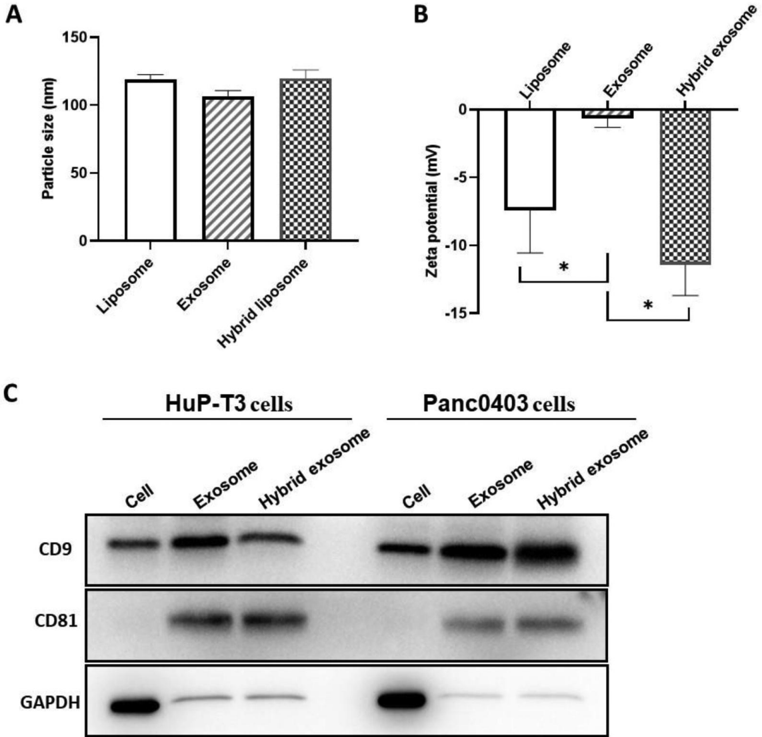
Figure 2 Characterisation of hybrid exosomes. The particle sizes (A) and zeta potentials (B) of liposomes, exosomes, and hybrid exosomes. Data were expressed as the mean ± SD ( n ¼ 3), � p < .05. (C) Protein expressions of CD9, C81 and GAPDH in cells, exosomes and hybrid exosomes derived either from Panc0403 or HuP-T3 in Western blot analysis. Images are representative of three independent experiments.
Figure 2 Characterisation of hybrid exosomes. The particle sizes (A) and zeta potentials (B) of liposomes, exosomes, and hybrid exosomes. Data were expressed as the mean ± SD ( n ¼ 3), � p < .05. (C) Protein expressions of CD9, C81 and GAPDH in cells, exosomes and hybrid exosomes derived either from Panc0403 or HuP-T3 in Western blot analysis. Images are representative of three independent experiments.CC-BY-NC · From the PDF
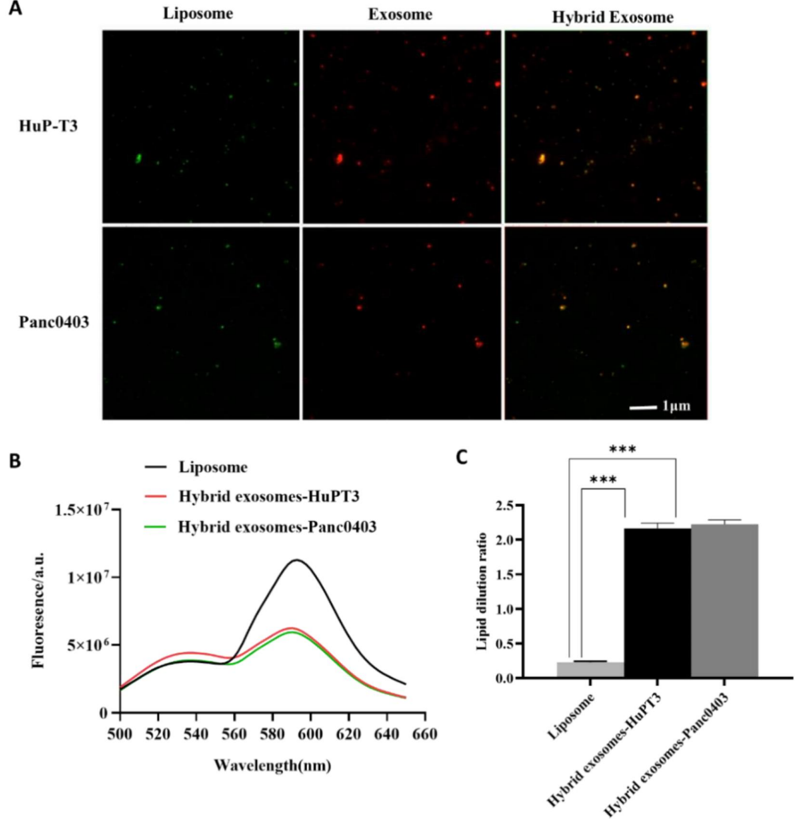
Figure 3 Evaluation of membrane fusion of exosomes with liposomes. (A) Colocalization of cancer-derived exosomes and liposomes in hybrid exosomes by total internal reflection fluorescence microscopy (TIRFM). The green fluorescence indicates coumarin 6-labelled liposomes, red fluorescence indicates DiD-labelled exo­ somes extracted from HuP-T3 and Panc0403 cells respectively, and orange merged fluorescence indicates colocalization of exosomes and liposomes. Images are rep­ resentative of three independent experiments. Scale bar, 1 l m. (B) The fusion curve of hybrid exosomes derived from HuP-T3 cells and Panc0403 cells by fluorescence resonance energy transfer (FRET) assays followed with (C) Quantitative analysis of FRET efficiency for the blank liposome and hybrid exosomes. Lipid dilution ratio is used to define the membrane fusion efficiency. The lipid dilution ratio of labelled liposomes is calculated through standard curve created by plotting FRET efficiency (E FD ) vs lipid dilution ratio. Liposomes labelled with 1 mol % NBD-DMPE and rho-DMPE (1:1 v/v) was fused with exosomes though freeze-thaw method, and the fluorescence intensities of the mixture were analysed at 530 and 588 nm. Data were expressed as the mean ± SD ( n ¼ 3), ��� p < .001.
Figure 3 Evaluation of membrane fusion of exosomes with liposomes. (A) Colocalization of cancer-derived exosomes and liposomes in hybrid exosomes by total internal reflection fluorescence microscopy (TIRFM). The green fluorescence indicates coumarin 6-labelled liposomes, red fluorescence indicates DiD-labelled exo­ somes extracted from HuP-T3 and Panc0403 cells respectively, and orange merged fluorescence indicates colocalization of exosomes and liposomes. Images are rep­ resentative of three independent experiments. Scale bar, 1 l m. (B) The fusion curve of hybrid exosomes derived from HuP-T3 cells and Panc0403 cells by fluorescence resonance energy transfer (FRET) assays followed with (C) Quantitative analysis of FRET efficiency for the blank liposome and hybrid exosomes. Lipid dilution ratio is used to define the membrane fusion efficiency. The lipid dilution ratio of labelled liposomes is calculated through standard curve created by plotting FRET efficiency (E FD ) vs lipid dilution ratio. Liposomes labelled with 1 mol % NBD-DMPE and rho-DMPE (1:1 v/v) was fused with exosomes though freeze-thaw method, and the fluorescence intensities of the mixture were analysed at 530 and 588 nm. Data were expressed as the mean ± SD ( n ¼ 3), ��� p < .001.CC-BY-NC · From the PDF
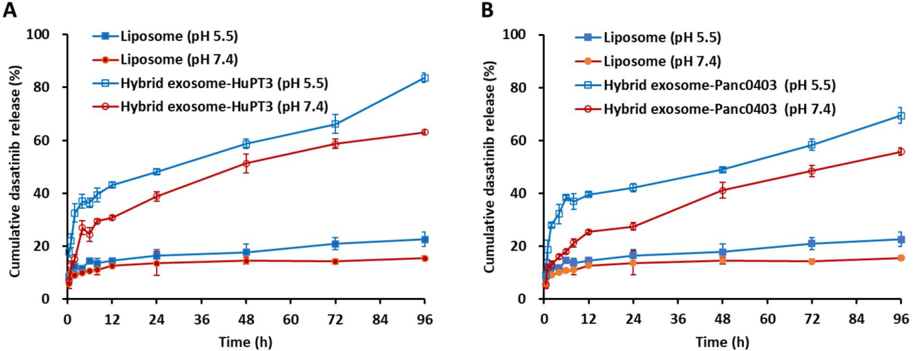
Figure 4 In vitro release kinetics of dasatinib from liposome, HuPT3-derived hybrid exosomes (A) and Panc0403-derived hybrid exosomes (B) in PBS buffer with pH 5.5 and pH 7.4 at 37 � C. At each predetermined interval, 200 l l of each sample was determined for absorbance detection at 322 nm and replaced with equal volume of respective buffers. The absorbance was translated to dasatinib concentration using a standard curve prepared through serial dilutions of dasatinib, followed by quantification of cumulative dasatinib release rate. Each experiment was repeated for triplicate.
Figure 4 In vitro release kinetics of dasatinib from liposome, HuPT3-derived hybrid exosomes (A) and Panc0403-derived hybrid exosomes (B) in PBS buffer with pH 5.5 and pH 7.4 at 37 � C. At each predetermined interval, 200 l l of each sample was determined for absorbance detection at 322 nm and replaced with equal volume of respective buffers. The absorbance was translated to dasatinib concentration using a standard curve prepared through serial dilutions of dasatinib, followed by quantification of cumulative dasatinib release rate. Each experiment was repeated for triplicate.CC-BY-NC · From the PDF
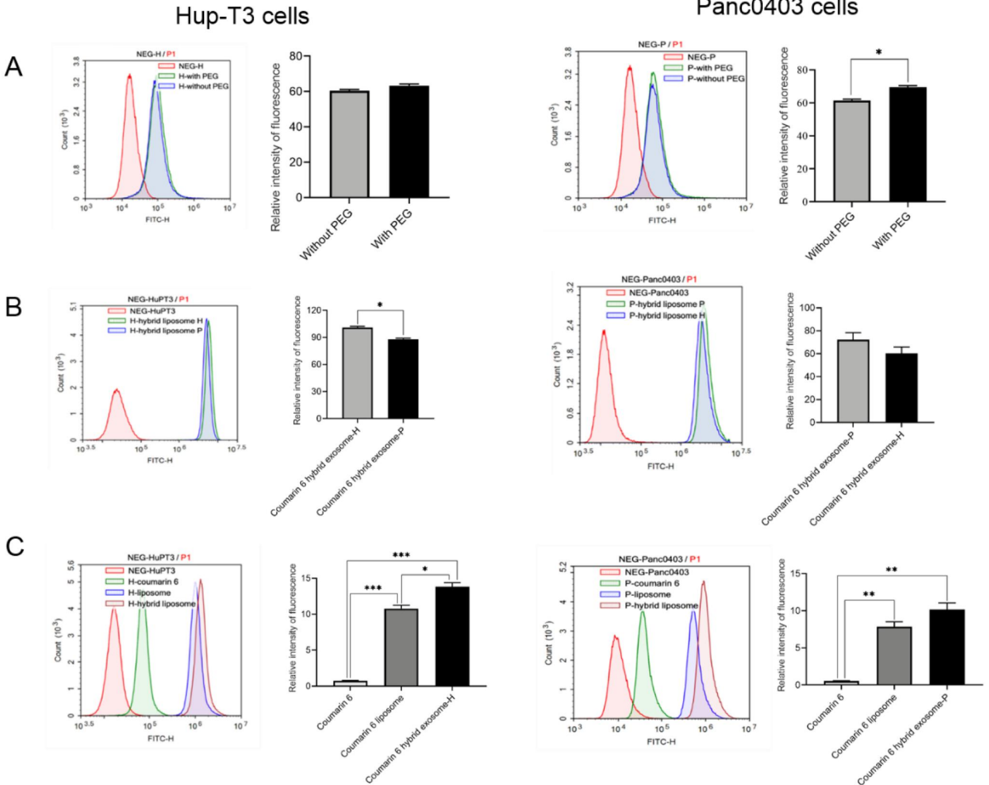
Figure 5 Analysis cellular uptake of hybrid exosomes in HuP-T3 cells (left panels) and Panc0403 cells (right panels) by flow cytometry. Coumarin 6 is used as fluorescence probe to determine uptake ratio. Treated with different types of formulations for 4 h, two cell lines were collected for FITC detection. The influences of PEG modification and cellular heterogeneity on cellular uptake after incubated different types of hybrid exosomes in HuP-T3 (Left panels of Figure 5(A,B)) and Panc0403 (Right panels of Figure 5(A,B)) cells. The cellular uptake efficiency of various coumarin 6 formulations in HuP-T3 (Left panel of Figure 5(C)) and Panc0403 (Right panel of Figure 5(C)) cells. NEG means negative control, H means HuP-T3 cells, P means Panc0403 cells. Data were expressed as the mean ± SD ( n ¼ 3). � p < .05, �� p < .01, ��� p < .001.
Figure 5 Analysis cellular uptake of hybrid exosomes in HuP-T3 cells (left panels) and Panc0403 cells (right panels) by flow cytometry. Coumarin 6 is used as fluorescence probe to determine uptake ratio. Treated with different types of formulations for 4 h, two cell lines were collected for FITC detection. The influences of PEG modification and cellular heterogeneity on cellular uptake after incubated different types of hybrid exosomes in HuP-T3 (Left panels of Figure 5(A,B)) and Panc0403 (Right panels of Figure 5(A,B)) cells. The cellular uptake efficiency of various coumarin 6 formulations in HuP-T3 (Left panel of Figure 5(C)) and Panc0403 (Right panel of Figure 5(C)) cells. NEG means negative control, H means HuP-T3 cells, P means Panc0403 cells. Data were expressed as the mean ± SD ( n ¼ 3). � p < .05, �� p < .01, ��� p < .001.CC-BY-NC · From the PDF
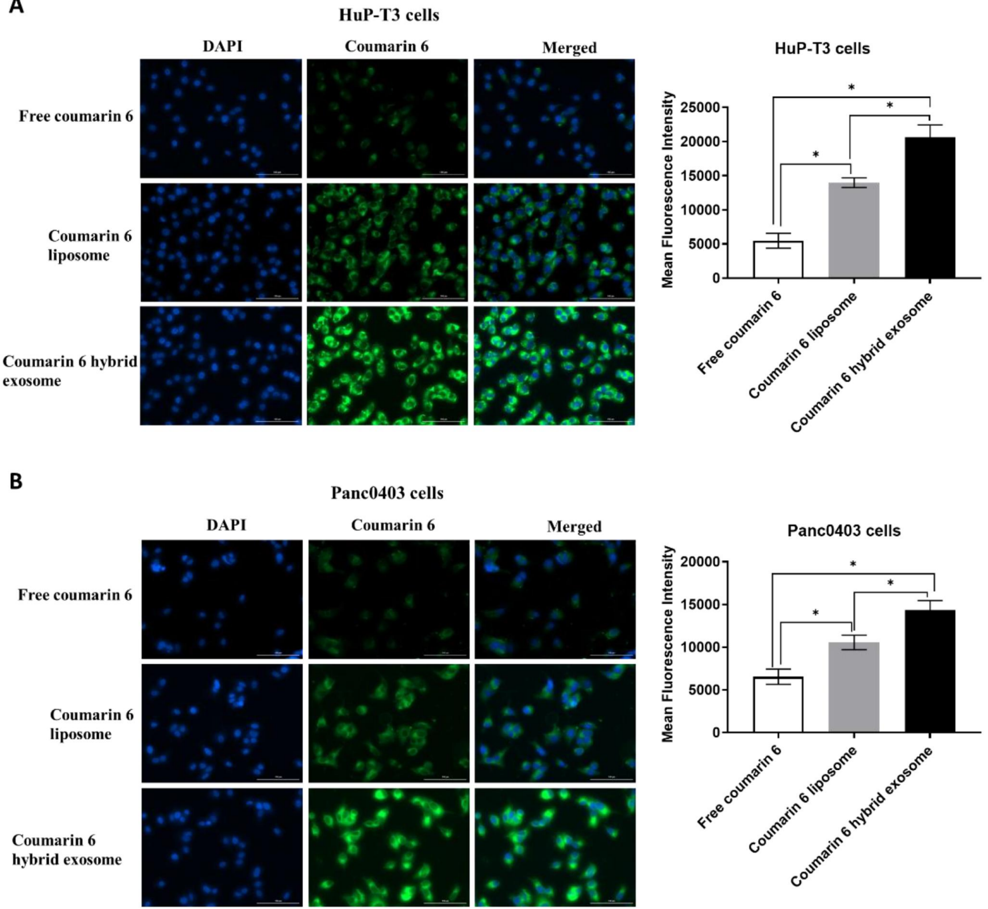
Figure 6 Representative images of HuP-T3 cells (A) and Panc0403 cells (B) treated with free coumarin 6, coumarin 6 liposomes and coumarin 6 hybrid exosomes, respectively. After incubation with the various coumarin 6 formulations for 4 h, the cells were stained with DAPI and imaged by Cytation 1 automatic microplate reader. Blue colour indicates the nucleus of cells stained with DAPI. Green colour shows the drug in HuP-T3 cells or Panc0403 cells after applying various coumarin 6 formulations. The fluorescence intensity of the coumarin 6 in the HuP-T3 and Panc0403 cells was quantified using ImageJ software. Scale bar: 100 l m. Data were expressed as the mean ± SD ( n ¼ 3). � p < .05.
Figure 6 Representative images of HuP-T3 cells (A) and Panc0403 cells (B) treated with free coumarin 6, coumarin 6 liposomes and coumarin 6 hybrid exosomes, respectively. After incubation with the various coumarin 6 formulations for 4 h, the cells were stained with DAPI and imaged by Cytation 1 automatic microplate reader. Blue colour indicates the nucleus of cells stained with DAPI. Green colour shows the drug in HuP-T3 cells or Panc0403 cells after applying various coumarin 6 formulations. The fluorescence intensity of the coumarin 6 in the HuP-T3 and Panc0403 cells was quantified using ImageJ software. Scale bar: 100 l m. Data were expressed as the mean ± SD ( n ¼ 3). � p < .05.CC-BY-NC · From the PDF
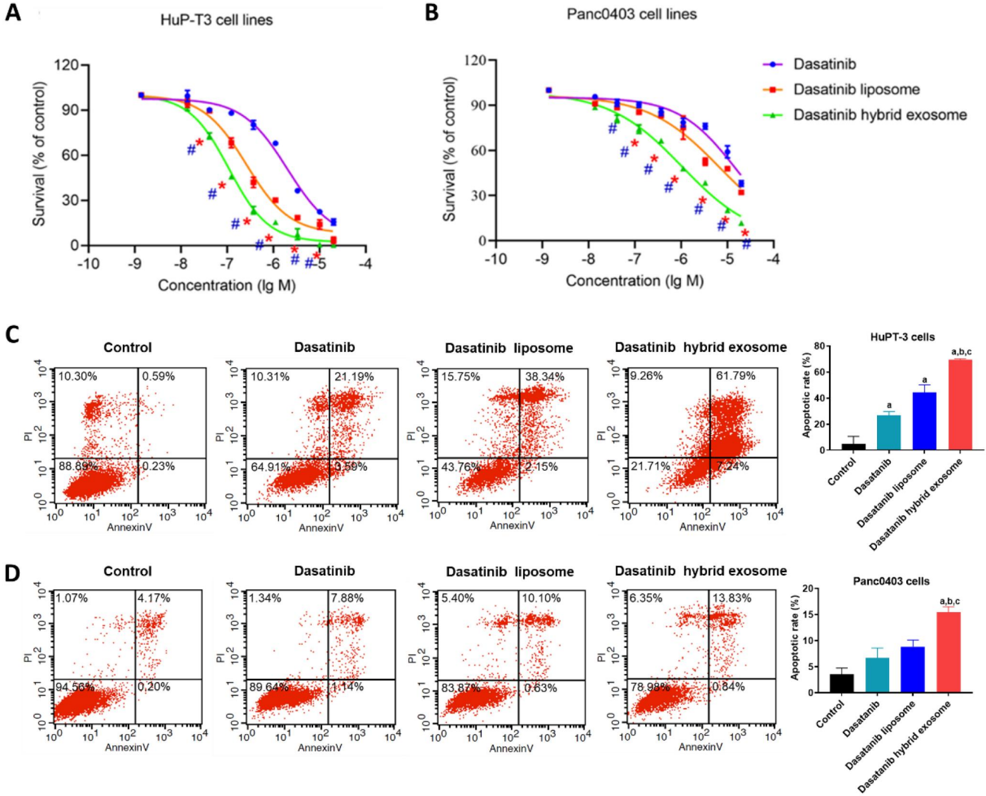
Figure 7 Effects on PDAC cell proliferation and apoptosis treated with different dasatinib formulations in vitro by MTS assay and flow cytometry analysis, respect­ ively. Inhibitory proliferation detection of HuP-T3 cells (A) and Panc0403 cells (B) treated with different dasatinib formulations by MTS assay. These two types of cell lines were treated with free dasatinib, dasatinib liposomes and dasatinib hybrid exosomes at the concentration of 0.00137, 0.0137, 0.0412, 0.123, 0.37, 1.11, 3.3, 10 and 20 l mol/L dasatinib for 72 h, followed by incubating MTS agent for 2 h, respectively. The absorbance was determined at 490 nm. Data expressed as means ± SD ( n ¼ 3). � p < .05, indicates the comparison of dasatinib hybrid exosomes to dasatinib liposomes; # p < .05, indicates the comparison of dasatinib hybrid exosomes to dasatinib. Apoptosis assessment of HuP-T3 cells (C) and Panc0403 cells (D) treated with varying dasatinib samples at 1 l mol/L of dasatinib concentration for 24h by flow cytometry analysis. Data are shown as the mean ± SD. a, p < .05, compared with control; b, p < .05, compared with dasatinib group; c, p < .05, compared with dasatinib liposome group.
Figure 7 Effects on PDAC cell proliferation and apoptosis treated with different dasatinib formulations in vitro by MTS assay and flow cytometry analysis, respect­ ively. Inhibitory proliferation detection of HuP-T3 cells (A) and Panc0403 cells (B) treated with different dasatinib formulations by MTS assay. These two types of cell lines were treated with free dasatinib, dasatinib liposomes and dasatinib hybrid exosomes at the concentration of 0.00137, 0.0137, 0.0412, 0.123, 0.37, 1.11, 3.3, 10 and 20 l mol/L dasatinib for 72 h, followed by incubating MTS agent for 2 h, respectively. The absorbance was determined at 490 nm. Data expressed as means ± SD ( n ¼ 3). � p < .05, indicates the comparison of dasatinib hybrid exosomes to dasatinib liposomes; # p < .05, indicates the comparison of dasatinib hybrid exosomes to dasatinib. Apoptosis assessment of HuP-T3 cells (C) and Panc0403 cells (D) treated with varying dasatinib samples at 1 l mol/L of dasatinib concentration for 24h by flow cytometry analysis. Data are shown as the mean ± SD. a, p < .05, compared with control; b, p < .05, compared with dasatinib group; c, p < .05, compared with dasatinib liposome group.CC-BY-NC · From the PDF
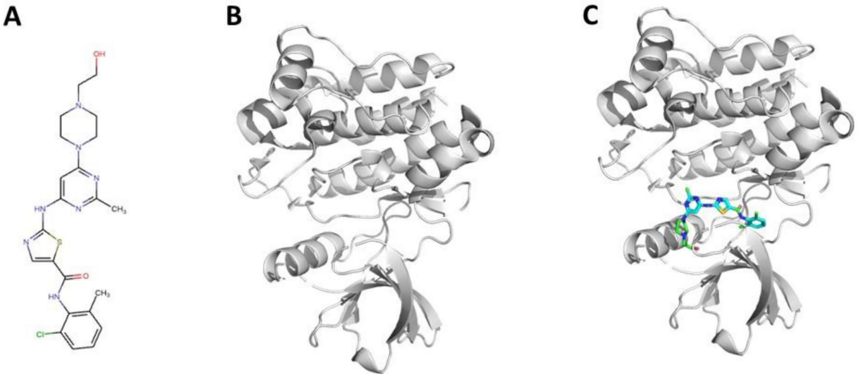
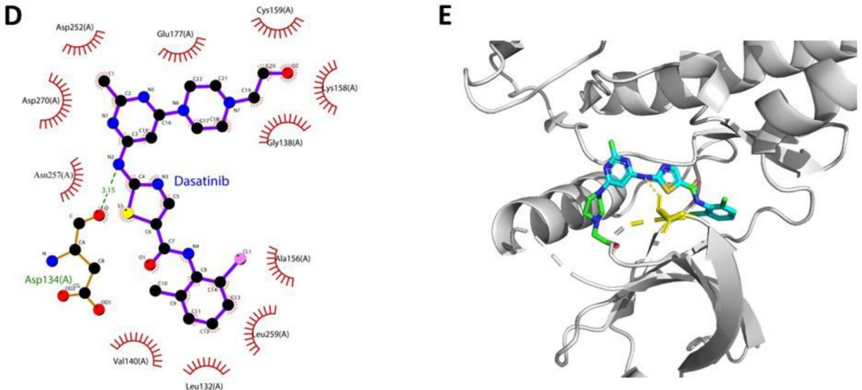
Figure 8 Interaction mode between dasatinib and ACK1 proposed by molecular docking analysis. (A) Chemical structure of dasatinib. (B) Chemical structure of ACK1 (PDB ID: 4HZR). (C) Binding pose of dasatinib - ACK1 complex. (D) Interaction profile of dasatinib - ACK1 complex. (E) Representative structure of dasatinib in the binding site of ACK1 kinase.
Figure 8 Interaction mode between dasatinib and ACK1 proposed by molecular docking analysis. (A) Chemical structure of dasatinib. (B) Chemical structure of ACK1 (PDB ID: 4HZR). (C) Binding pose of dasatinib - ACK1 complex. (D) Interaction profile of dasatinib - ACK1 complex. (E) Representative structure of dasatinib in the binding site of ACK1 kinase.CC-BY-NC · From the PDF
Image 12
CC-BY-NC · From the PDF

Verification

Claims the paper makes

The claims and statistics of this paper haven’t been checked yet.

Run the check — free, no account needed. It reads the open-access text and checks the sources it cites.

A few free checks a day · papers already verified open instantly · results are public

Claims other papers make about this one

Each is checked against this paper’s own text: does it say what the citing paper says it does?

Self-check

Percentages, sums and reported differences re-computed from the paper’s own numbers.

The self-check needs the paper’s full text.

Citations

Cites

Show all 2 references

Research works printed but not linked: 65

  1. 10.3322/caac.21708 · DOI · Paper page
  2. 10.1002/cncr.34273 · DOI
  3. 10.3390/cancers9090122 · DOI
  4. 10.1016/j.bbcan.2020.188461 · DOI
  5. 10.1016/j.tcb.2011.12.001 · DOI · Paper page
  6. 10.18632/oncotarget.2462 · DOI
  7. 10.1007/s10930-015-9616-z · DOI
  8. 10.1016/j.ajpath.2013.09.027 · DOI
  9. 10.1038/s41598-019-44569-6 · DOI
  10. 10.1016/j.biomaterials.2021.121056 · DOI
  11. 10.1038/s41467-019-11718-4 · DOI · Paper page
  12. 10.1186/s12951-022-01675-4 · DOI
  13. 10.1155/2022/4234116 · DOI
  14. 10.1016/j.biomaterials.2021.120964 · DOI
  15. 10.1002/advs.201700611 · DOI · Paper page
  16. 10.1016/j.actbio.2019.05.054 · DOI · Paper page
  17. 10.1016/j.biomaterials.2021.120761 · DOI
  18. 10.1021/acsnano.8b02053 · DOI
  19. 10.1006/bbrc.1997.8043 · DOI
  20. 10.1016/j.ajpath.2011.12.028 · DOI
  21. 10.3892/ijo.2014.2357 · DOI
  22. 10.1053/j.gastro.2010.03.034 · DOI · Paper page
  23. 10.1080/15384047.2019.1579956 · DOI
  24. 10.1080/10717544.2021.1905751 · DOI
  25. 10.18632/oncotarget.10435 · DOI
  26. 10.1159/000480737 · DOI
  27. 10.1155/2023/2336536 · DOI
  28. 10.1016/j.biomaterials.2020.120369 · DOI
  29. 10.1016/j.actbio.2018.05.031 · DOI
  30. 10.1016/j.ejps.2022.106199 · DOI
  31. 10.1093/nar/gkab255 · DOI
  32. 10.1016/s0169-409x(00)00129-0 · DOI · Paper page
  33. 10.1002/jcc.21334 · DOI · Paper page
  34. 10.1007/978-1-4939-7000-1_26 · DOI · Paper page
  35. Landrum G. RDKit: a software suite for cheminformatics, computational chemistry, and predictive modeling. Greg Landrum. 2013;8:31.
  36. DeLano WL. Pymol: an open-source molecular graphics tool. CCP4 Newslett Pro Crystallogr. 2002;40(1):82–92.
  37. 10.1021/ci200227u · DOI
  38. 10.1634/theoncologist.2013-0255 · DOI
  39. 10.3390/genes11080835 · DOI
  40. 10.1016/0011-2240(85)90184-1 · DOI
  41. 10.1007/s11095-013-1135-z · DOI
  42. 10.1016/j.cryobiol.2007.08.002 · DOI
  43. 10.1016/S0006-3495(96)79452-3 · DOI
  44. 10.1080/096876899294508 · DOI
  45. 10.1088/1367-2630/aabb96 · DOI
  46. 10.1186/s12964-021-00730-1 · DOI
  47. 10.1038/nrm.2017.125 · DOI · Paper page
  48. 10.1111/tra.12803 · DOI
  49. 10.1016/j.bbrc.2014.12.015 · DOI
  50. 10.1002/mabi.202100042 · DOI
  51. 10.1016/j.bbamem.2014.07.026 · DOI
  52. 10.3402/jev.v3.24641 · DOI · Paper page
  53. 10.1186/1471-2407-11-108 · DOI
  54. 10.1016/j.biocel.2012.06.018 · DOI
  55. 10.1186/s12885-017-3958-1 · DOI
  56. 10.1074/jbc.M109.041152 · DOI
  57. 10.1038/s41467-021-23946-8 · DOI
  58. 10.1007/s13346-013-0176-5 · DOI
  59. Hong RL, Huang CJ, Tseng YL, et al. Direct comparison of liposomal doxorubicin with or without polyethylene glycol coating in C-26 tumor-bearing mice: is surface coating with polyethylene glycol beneficial? Clin Cancer Res. 1999;5(11):3645–3652.
  60. 10.1081/lpr-120020318 · DOI
  61. 10.1042/BJ20031594 · DOI
  62. 10.1002/advs.202000515 · DOI
  63. 10.1126/sciadv.abc3013 · DOI
  64. 10.1200/CCI.19.00144 · DOI
  65. 10.1126/science.aav1741 · DOI

Cited by

Sorted by citations

Metadata

Authors
Zhou, X., Zhuang, Y., Liu, X., Gu, Y., Wang, J., Shi, Y., Zhang, L., Li, R., Zhao, Y., Chen, H., Li, J., Yao, H., & Li, L.
Venue
Artificial Cells, Nanomedicine, and Biotechnology
Published
2023-10-05
Volume
51
Issue
1
Pages
532-546
ISSN
  • 2169-1401
  • 2169-141X
Cited by
23
References
2
Language
en
Funders
  • National Natural Science Foundation of China (NSFC 81773671, 81828010)
  • CAMS Innovation Fund for Medical Sciences (CIFMS 2021-1-I2M-026)
  • Drug Innovation Major Project of China (2018ZX09711001-007-002)
  • Innovation Team and Talents Cultivation Program of the National Administration of Traditional Chinese Medicine (ZYYCXTD-C-202205)

About these checks

Registry, retraction, Cites and statistics results are computed, not judged, with one exception: a printed reference that no index lists is read once by a model before it counts as a citation error. Claims are extracted by a model and kept only when their quote appears verbatim in the text; each cited source is then checked, with a model’s help, for whether it says what the claim relies on. Those verdicts can be wrong — read the claim’s quote and the cited source before relying on one.

Statistics and arithmetic are recomputed, not judged.

Confidence bands are shown only for fields calibrated on our annotated test set. None is calibrated yet, so no band is shown.

What counts as a claim ›How we measure confidence ›How we check this ›

Are you an author, or do you see a problem with this page? Request a review