

The DOI matches its Crossref record; 2 of the 2 references it cites were found in a registry or an index.
Toll-like receptor 8 functions as a negative regulator of neurite outgrowth and inducer of neuronal apoptosis
Abstract
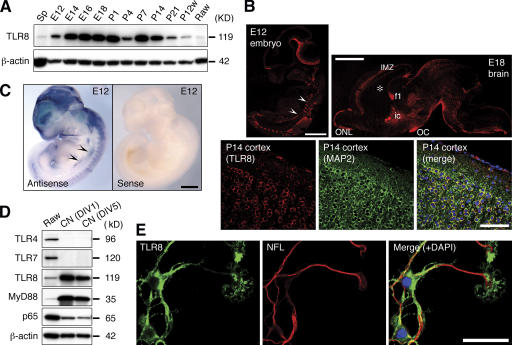
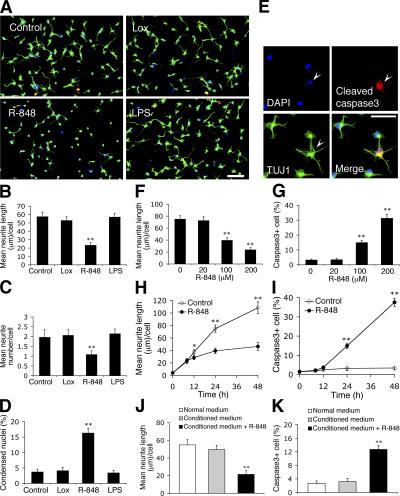
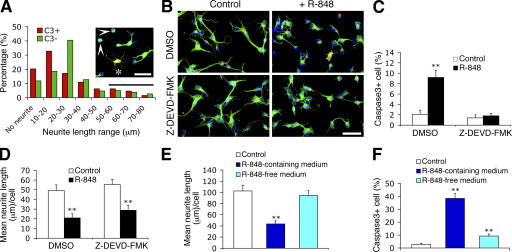
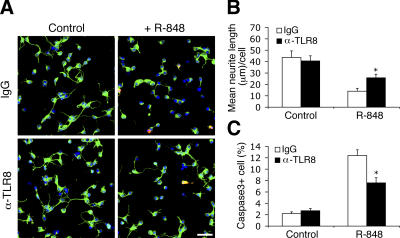
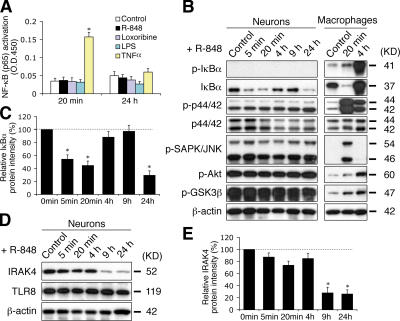
Toll receptors in Drosophila melanogaster function in morphogenesis and host defense. Mammalian orthologues of Toll, the Toll-like receptors (TLRs), have been studied extensively for their essential functions in controlling innate and adaptive immune responses. We report that TLR8 is dynamically expressed during mouse brain development and localizes to neurons and axons. Agonist stimulation of TLR8 in cultured cortical neurons causes inhibition of neurite outgrowth and induces apoptosis in a dissociable manner. Our evidence indicates that such TLR8-mediated neuronal responses do not involve the canonical TLR–NF-κB signaling pathway. These findings reveal novel functions for TLR8 in the mammalian nervous system that are distinct from the classical role of TLRs in immunity.
Overview
The claims and statistics of this paper haven’t been checked yet.
Run the check — free, no account needed. It reads the open-access text and checks the sources it cites.
Integrity signals
Registry
Cites
Statistics
Figures
Verification
Claims the paper makes
The claims and statistics of this paper haven’t been checked yet.
Run the check — free, no account needed. It reads the open-access text and checks the sources it cites.
Claims other papers make about this one
Each is checked against this paper’s own text: does it say what the citing paper says it does?
The cited source says what the claim attributes to it.
In the citing paper
“Accordingly, the dual TLR7/8 agonist resiquimod was reported to inhibit neurite outgrowth [65, 66].”
From Neurodegenerative disease-associated microRNAs acting as signaling molecules modulate CNS neuron structure and viability (2025) · cites this paper as [66]
Self-check
Percentages, sums and reported differences re-computed from the paper’s own numbers.
The self-check needs the paper’s full text.
Citations
Cites
Akira, S., & Takeda, K. (2004) · Nature reviews. Immunology · doi:10.1038/nri1391 · Cited by 8,312
A CONSERVED SIGNALING PATHWAY: The Drosophila Toll-Dorsal Pathway
Belvin, M. P., & Anderson, K. V. (1996) · Annual Review of Cell and Developmental Biology · doi:10.1146/annurev.cellbio.12.1.393 · Cited by 836 · cited 1×
“In addition to a well-described role in immunity (Hoffmann, 2003), Toll, which is the Drosophila melanogaster orthologue of the TLRs, plays crucial roles in establishing the dorsoventral axis polarity during embryogenesis (Belvin and Anderson, 1996), in synaptogenesis, and in axon pathfi nding (Rose et al.”
Research works printed but not linked: 19
- 2004, Nat. Rev. Neurosci., 5, 521, 10.1038/nrn1428 · DOI · Paper page
- 2002, J. Biol. Chem., 277, 1991, 10.1074/jbc.M107992200 · DOI
- 2000, Eur. Cytokine Netw., 11, 362
- 2000, J. Neurosci., 20, 7556, 10.1523/JNEUROSCI.20-20-07556.2000 · DOI
- 2004, J. Leukoc. Biol., 76, 904, 10.1189/jlb.0504277 · DOI
- 2003, Eur. J. Immunol., 33, 2987, 10.1002/eji.200324238 · DOI
- 2003, Nature., 426, 33, 10.1038/nature02021 · DOI · Paper page
- 1999, Science., 284, 1313, 10.1126/science.284.5418.1313 · DOI
- 2002, Nat. Immunol., 3, 499, 10.1038/ni0602-499 · DOI · Paper page
- 2006, Nature., 440, 233, 10.1038/nature04517 · DOI
- 2006, J. Neurosci. Res., 83, 711, 10.1002/jnr.20767 · DOI
- 2003, Proc. Natl. Acad. Sci. USA., 100, 8514, 10.1073/pnas.1432609100 · DOI · Paper page
- 2005, Exp. Cell Res., 307, 15, 10.1016/j.yexcr.2005.02.015 · DOI
- 2005, J. Virol., 79, 12893, 10.1128/JVI.79.20.12893-12904.2005 · DOI
- 2005, Proc. Natl. Acad. Sci. USA., 102, 9577, 10.1073/pnas.0502272102 · DOI
- 1997, Development., 124, 1561, 10.1242/dev.124.8.1561 · DOI
- 2006, J. Immunol., 176, 4894, 10.4049/jimmunol.176.8.4894 · DOI
- 2003, J. Biol. Chem., 278, 46541, 10.1074/jbc.M306381200 · DOI
- 2006, J. Dent. Res., 85, 49, 10.1177/154405910608500108 · DOI
Cited by
Sorted by citations
Regulation of innate immune responses in the brain
Rivest, S. (2009) · Nature Reviews Immunology · doi:10.1038/nri2565 · Cited by 843
Microglia activation triggers astrocyte-mediated modulation of excitatory neurotransmission
Pascual, O., Ben Achour, S., Rostaing, P., Triller, A., & Bessis, A. (2012) · Proceedings of the National Academy of Sciences · doi:10.1073/pnas.1111098109 · Cited by 693
Toll-like receptors — taking an evolutionary approach
Leulier, F., & Lemaitre, B. (2008) · Nature Reviews Genetics · doi:10.1038/nrg2303 · Cited by 581
Pattern recognition receptors and central nervous system repair
Kigerl, K. A., de Rivero Vaccari, J. P., Dietrich, W. D., Popovich, P. G., & Keane, R. W. (2014) · Experimental Neurology · doi:10.1016/j.expneurol.2014.01.001 · Cited by 490
Gut microbial molecules in behavioural and neurodegenerative conditions
Needham, B. D., Kaddurah-Daouk, R., & Mazmanian, S. K. (2020) · Nature Reviews Neuroscience · doi:10.1038/s41583-020-00381-0 · Cited by 379
The bacterial peptidoglycan-sensing molecule Pglyrp2 modulates brain development and behavior
Arentsen, T., Qian, Y., Gkotzis, S., Femenia, T., Wang, T., Udekwu, K., Forssberg, H., & Diaz Heijtz, R. (2017) · Molecular Psychiatry · doi:10.1038/mp.2016.182 · Cited by 280
Toll-like Receptors in Defense and Damage of the Central Nervous System
Aravalli, R. N., Peterson, P. K., & Lokensgard, J. R. (2007) · Journal of Neuroimmune Pharmacology · doi:10.1007/s11481-007-9071-5 · Cited by 173
Toll-like receptors in the depressed and suicide brain
Pandey, G. N., Rizavi, H. S., Ren, X., Bhaumik, R., & Dwivedi, Y. (2014) · Journal of Psychiatric Research · doi:10.1016/j.jpsychires.2014.01.021 · Cited by 164
Crowley, T., Cryan, J. F., Downer, E. J., & O’Leary, O. F. (2016) · Brain, Behavior, and Immunity · doi:10.1016/j.bbi.2016.02.001 · Cited by 150
Toll-like receptors and their therapeutic potential in Parkinson’s disease and α-synucleinopathies
Kouli, A., Horne, C. B., & Williams-Gray, C. H. (2019) · Brain Behavior and Immunity · doi:10.1016/j.bbi.2019.06.042 · Cited by 143
Expression of Toll-Like Receptors in the Developing Brain
Kaul, D., Habbel, P., Derkow, K., Krüger, C., Franzoni, E., Wulczyn, F. G., Bereswill, S., Nitsch, R., Schott, E., Veh, R., et al. (2012) · PLoS ONE · doi:10.1371/journal.pone.0037767 · Cited by 141
Human endogenous retrovirus HERV-K(HML-2) RNA causes neurodegeneration through Toll-like receptors
Dembny, P., Newman, A. G., Singh, M., Hinz, M., Szczepek, M., Krüger, C., Adalbert, R., Dzaye, O., Trimbuch, T., Wallach, T., et al. (2020) · JCI Insight · doi:10.1172/jci.insight.131093 · Cited by 134
Bacterial Peptidoglycans from Microbiota in Neurodevelopment and Behavior
Gonzalez-Santana, A., & Diaz Heijtz, R. (2020) · Trends in Molecular Medicine · doi:10.1016/j.molmed.2020.05.003 · Cited by 118
Butchi, N. B., Du, M., & Peterson, K. E. (2010) · Glia · doi:10.1002/glia.20952 · Cited by 109
Association between toll-like receptors expression and major depressive disorder
Hung, Y.-Y., Kang, H.-Y., Huang, K.-W., & Huang, T.-L. (2014) · Psychiatry Research · doi:10.1016/j.psychres.2014.07.074 · Cited by 103
Hung, Y.-F., Chen, C.-Y., Shih, Y.-C., Liu, H.-Y., Huang, C.-M., & Hsueh, Y.-P. (2018) · Journal of Cell Biology · doi:10.1083/jcb.201712113 · Cited by 86
Targeting HMGB1 TLR4 signaling as a novel approach to treatment of cerebral ischemia
Yang, Q.-W. (2010) · Frontiers in Bioscience · doi:10.2741/s119 · Cited by 55
Kumbol, V., Ivanov, A., McGurran, H., Schüler, J., Zhai, Y., Ludwik, K., Hinkelmann, L., Brehm, M., Krüger, C., Küchler, J., et al. (2025) · Cell Communication and Signaling · doi:10.1186/s12964-025-02199-8 · Cited by 8
Klammer, M. G., Dzaye, O., Wallach, T., Krüger, C., Gaessler, D., Buonfiglioli, A., Derkow, K., Kettenmann, H., Brinkmann, M. M., & Lehnardt, S. (2021) · Frontiers in Immunology · doi:10.3389/fimmu.2021.715774 · Cited by 6
Metadata
- Authors
- Ma, Y., Li, J., Chiu, I., Wang, Y., Sloane, J. A., Lü, J., Kosaras, B., Sidman, R. L., Volpe, J. J., & Vartanian, T.
- Affiliations
- 1Department of Neurology, Beth Israel Deaconess Medical Center, Boston, MA 02115
- 4Center for Blood Research, Graduate Program in Immunology, Harvard Medical School, Boston, MA 02115
- 5Pulmonary Center, Boston University School of Medicine, Boston, MA 02118
- 2Program in Neuroscience
- Venue
- The Journal of Cell Biology
- Publisher
- Rockefeller University Press
- Published
- 2006-10-23
- Volume
- 175
- Issue
- 2
- Pages
- 209-215
- ISSN
- 1540-8140
- 0021-9525
- PMC
- PMC2064562
- Cited by
- 237
- References
- 2
- Language
- en
About these checks
Registry, retraction, Cites and statistics results are computed, not judged, with one exception: a printed reference that no index lists is read once by a model before it counts as a citation error. Claims are extracted by a model and kept only when their quote appears verbatim in the text; each cited source is then checked, with a model’s help, for whether it says what the claim relies on. Those verdicts can be wrong — read the claim’s quote and the cited source before relying on one.
Statistics and arithmetic are recomputed, not judged.
Confidence bands are shown only for fields calibrated on our annotated test set. None is calibrated yet, so no band is shown.
What counts as a claim ›How we measure confidence ›How we check this ›
Are you an author, or do you see a problem with this page? Request a review
