

The DOI matches its Crossref record; 46 of the 46 references it cites were found in a registry or an index.
Imaging analysis reveals mechanistic differences between first- and second-phase insulin exocytosis
Open accessAbstract
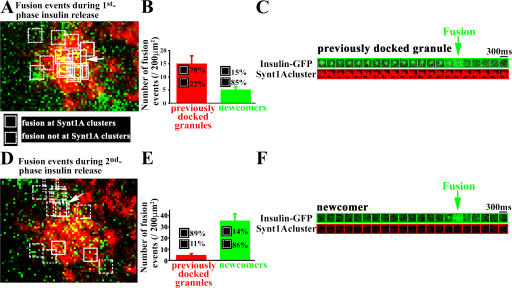
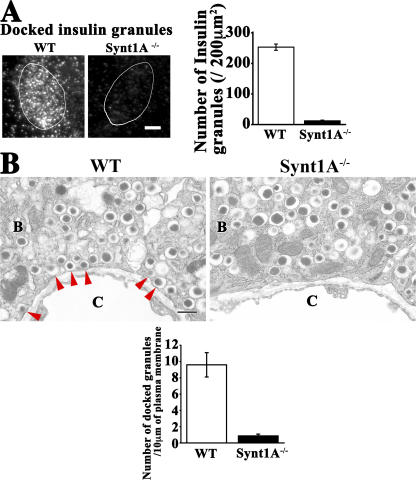
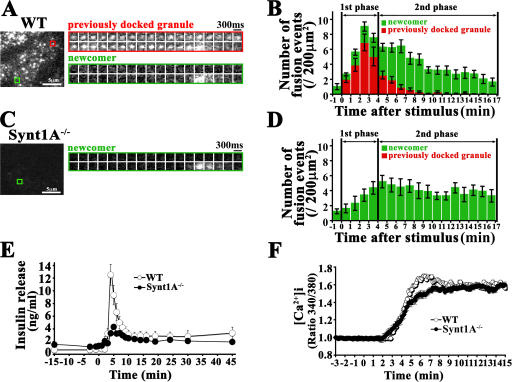
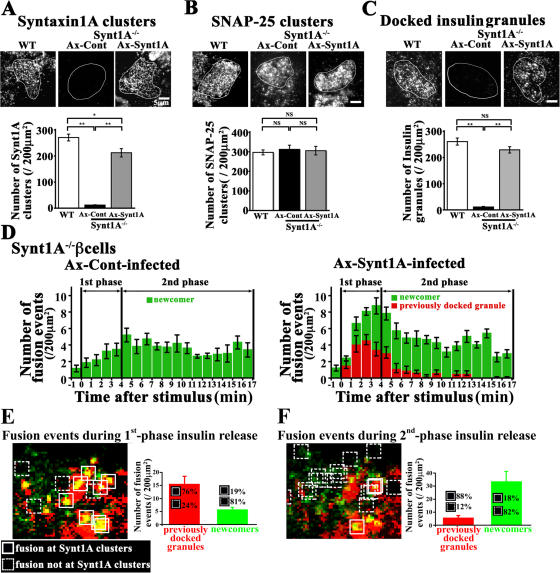
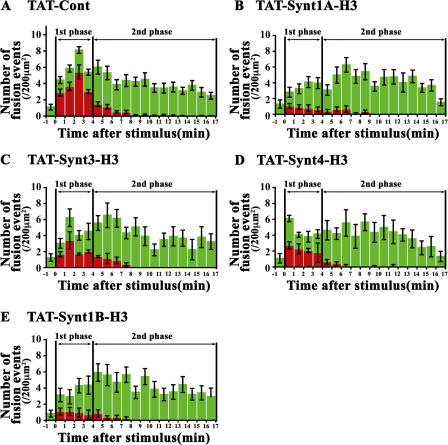
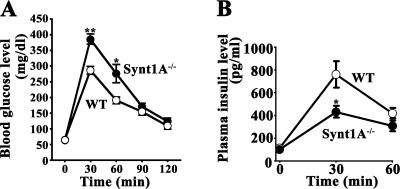
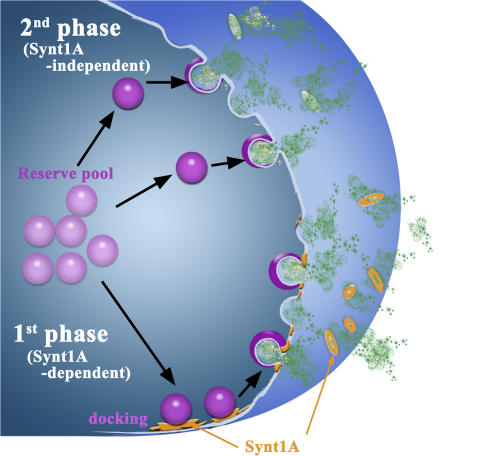
The mechanism of glucose-induced biphasic insulin release is unknown. We used total internal reflection fluorescence (TIRF) imaging analysis to reveal the process of first- and second-phase insulin exocytosis in pancreatic β cells. This analysis showed that previously docked insulin granules fused at the site of syntaxin (Synt)1A clusters during the first phase; however, the newcomers fused during the second phase external to the Synt1A clusters. To reveal the function of Synt1A in phasic insulin exocytosis, we generated Synt1A-knockout (Synt1A−/−) mice. Synt1A−/− β cells showed fewer previously docked granules with no fusion during the first phase; second-phase fusion from newcomers was preserved. Rescue experiments restoring Synt1A expression demonstrated restoration of granule docking status and fusion events. Inhibition of other syntaxins, Synt3 and Synt4, did not affect second-phase insulin exocytosis. We conclude that the first phase is Synt1A dependent but the second phase is not. This indicates that the two phases of insulin exocytosis differ spatially and mechanistically.
Overview
The claims and statistics of this paper haven’t been checked yet.
Run the check — free, no account needed. It reads the open-access text and checks the sources it cites.
Integrity signals
Registry
Cites
Statistics
Figures
Verification
Claims the paper makes
The claims and statistics of this paper haven’t been checked yet.
Run the check — free, no account needed. It reads the open-access text and checks the sources it cites.
Claims other papers make about this one
Each is checked against this paper’s own text: does it say what the citing paper says it does?
The source backs part of the claim, not all of it — or backs it for a different population, condition or comparison.
In the citing paper
“There is general agreement that many docked granules are released in response to membrane depolarization produced by sulfonylureas or high [K+]o (288, 446, 487, 617).”
From Pancreatic β-Cell Electrical Activity and Insulin Secretion: Of Mice and Men (2018) · cites this paper as [487]
Experimental — accuracy not yet measuredThe cited source says what the claim attributes to it.
In the citing paper
“In one study where TIRF microscopy was used to monitor granule exocytosis, Stx1a deficiency resulted in a marked reduction of docked granules and strong suppression of 1st phase insulin secretion (487). However, 2nd phase secretion was unaffected.”
From Pancreatic β-Cell Electrical Activity and Insulin Secretion: Of Mice and Men (2018) · cites this paper as [487]
Self-check
Percentages, sums and reported differences re-computed from the paper’s own numbers.
The self-check needs the paper’s full text.
Citations
Cites
Südhof, T. C. (2004) · Annual Review of Neuroscience · doi:10.1146/annurev.neuro.26.041002.131412 · Cited by 2,491
Wilschut, J. (1990) · Cited by 2,407
Jahn, R., Lang, T., & Südhof, T. C. (2003) · Cell · doi:10.1016/s0092-8674(03)00112-0 · Cited by 1,364
Syntaxin: A Synaptic Protein Implicated in Docking of Synaptic Vesicles at Presynaptic Active Zones
Bennett, M. K., Calakos, N., & Scheller, R. H. (1992) · Science · doi:10.1126/science.1321498 · Cited by 1,263
Membrane fusion and exocytosis.
Jahn, R., & Südhof, T. (1999) · Annual Review of Biochemistry · doi:10.1146/annurev.biochem.68.1.863 · Cited by 1,253
Triggering and amplifying pathways of regulation of insulin secretion by glucose.
Henquin, J. C. (2000) · Diabetes · doi:10.2337/diabetes.49.11.1751 · Cited by 1,201
Hemizygosity at the elastin locus in a developmental disorder, Williams syndrome
Ewart, A. K., Morris, C. A., Atkinson, D., Jin, W., Sternes, K., Spallone, P., Stock, A. D., Leppert, M., & Keating, M. T. (1993) · Nature Genetics · doi:10.1038/ng0993-11 · Cited by 1,138
Insulin granule dynamics in pancreatic beta cells
Rorsman, P., & Renstr�m, E. (2003) · Diabetologia · doi:10.1007/s00125-003-1153-1 · Cited by 844
Natural history of Williams syndrome: Physical characteristics
Morris, C. A., Demsey, S. A., Leonard, C. O., Dilts, C., & Blackburn, B. L. (1988) · The Journal of Pediatrics · doi:10.1016/s0022-3476(88)80272-5 · Cited by 670
SNARE Function Analyzed in Synaptobrevin/VAMP Knockout Mice
Schoch, S., Deák, F., Königstorfer, A., Mozhayeva, M. G., Sara, Y., Südhof, T. C., & Kavalali, E. T. (2001) · Science · doi:10.1126/science.1064335 · Cited by 664
Research works printed but not linked: 4
- 2004, Am. J. Med. Genet. A., 131, 255
- 1986, Lancet., 2, 360
- 1997, Am. J. Hum. Genet., 61, 449
- 2000, News Physiol. Sci., 15, 72
Cited by
Sorted by citations
Pancreatic β-Cell Electrical Activity and Insulin Secretion: Of Mice and Men
Rorsman, P., & Ashcroft, F. M. (2018) · Physiological Reviews · doi:10.1152/physrev.00008.2017 · Cited by 793
Regulation of insulin secretion: a matter of phase control and amplitude modulation
Henquin, J. C. (2009) · Diabetologia · doi:10.1007/s00125-009-1314-y · Cited by 513
Wang, Z., & Thurmond, D. C. (2009) · Journal of Cell Science · doi:10.1242/jcs.034355 · Cited by 386
TNFα Controls Glutamatergic Gliotransmission in the Hippocampal Dentate Gyrus
Santello, M., Bezzi, P., & Volterra, A. (2011) · Neuron · doi:10.1016/j.neuron.2011.02.003 · Cited by 384
Dynamics of insulin secretion and the clinical implications for obesity and diabetes
Seino, S., Shibasaki, T., & Minami, K. (2011) · Journal of Clinical Investigation · doi:10.1172/jci45680 · Cited by 364
The genomic basis of the Williams – Beuren syndrome
Schubert, C. (2008) · Cellular and Molecular Life Sciences · doi:10.1007/s00018-008-8401-y · Cited by 245
Regulation of calcium in pancreatic α- and β-cells in health and disease
Rorsman, P., Braun, M., & Zhang, Q. (2012) · Cell Calcium · doi:10.1016/j.ceca.2011.11.006 · Cited by 220
Vesicle Docking in Regulated Exocytosis
Verhage, M., & Sørensen, J. B. (2008) · Traffic · doi:10.1111/j.1600-0854.2008.00759.x · Cited by 213
Munc18-1 in secretion: lonely Munc joins SNARE team and takes control.
Toonen, R., & Verhage, M. (2007) · Trends in Neurosciences · doi:10.1016/j.tins.2007.08.008 · Cited by 231
Novel aspects of the molecular mechanisms controlling insulin secretion
Eliasson, L., Abdulkader, F., Braun, M., Galvanovskis, J., Hoppa, M. B., & Rorsman, P. (2008) · The Journal of Physiology · doi:10.1113/jphysiol.2008.155317 · Cited by 198
Henquin, J. (2011) · Diabetes Research and Clinical Practice · doi:10.1016/s0168-8227(11)70010-9 · Cited by 191
Serotonin regulates glucose-stimulated insulin secretion from pancreatic β cells during pregnancy
Ohara‐Imaizumi, M., Kim, H., Yoshida, M., Fujiwara, T., Aoyagi, K., Toyofuku, Y., Nakamichi, Y., Nishiwaki, C., Okamura, T., Uchida, T., et al. (2013) · Proceedings of the National Academy of Sciences · doi:10.1073/pnas.1310953110 · Cited by 176
Self-citationSignaling mechanisms of glucose-induced F-actin remodeling in pancreatic islet β cells
Kalwat, M. A., & Thurmond, D. C. (2013) · Experimental & Molecular Medicine · doi:10.1038/emm.2013.73 · Cited by 158
Hoppa, M. B., Collins, S., Ramracheya, R., Hodson, L., Amisten, S., Zhang, Q., Johnson, P., Ashcroft, F. M., & Rorsman, P. (2009) · Cell Metabolism · doi:10.1016/j.cmet.2009.09.011 · Cited by 152
Distinct Initial SNARE Configurations Underlying the Diversity of Exocytosis
Kasai, H., Takahashi, N., & Tokumaru, H. (2012) · Physiological Reviews · doi:10.1152/physrev.00007.2012 · Cited by 150
Mechanisms of the amplifying pathway of insulin secretion in the β cell
Kalwat, M. A., & Cobb, M. H. (2017) · Pharmacology & Therapeutics · doi:10.1016/j.pharmthera.2017.05.003 · Cited by 151
Jewell, J. L., Oh, E., & Thurmond, D. C. (2010) · American Journal of Physiology-Regulatory, Integrative and Comparative Physiology · doi:10.1152/ajpregu.00597.2009 · Cited by 127
Contact-induced clustering of syntaxin and munc18 docks secretory granules at the exocytosis site
Gandasi, N. R., & Barg, S. (2014) · Nature Communications · doi:10.1038/ncomms4914 · Cited by 130
Insulin granule biogenesis and exocytosis
Omar‐Hmeadi, M., & Idevall‐Hagren, O. (2020) · Cellular and Molecular Life Sciences · doi:10.1007/s00018-020-03688-4 · Cited by 137
Andersson, S. A., Olsson, A. H., Esguerra, J. L. S., Heimann, E., Ladenvall, C., Edlund, A., Salehi, A., Taneera, J., Degerman, E., Groop, L., et al. (2012) · Molecular and Cellular Endocrinology · doi:10.1016/j.mce.2012.08.009 · Cited by 122
Glucose-Dependent Granule Docking Limits Insulin Secretion and Is Decreased in Human Type 2 Diabetes
Gandasi, N. R., Yin, P., Omar-Hmeadi, M., Ottosson Laakso, E., Vikman, P., & Barg, S. (2018) · Cell Metabolism · doi:10.1016/j.cmet.2017.12.017 · Cited by 115
CAPS and syntaxin dock dense core vesicles to the plasma membrane in neurons
Hammarlund, M., Watanabe, S., Schuske, K. R., & Jørgensen, E. M. (2008) · The Journal of Cell Biology · doi:10.1083/jcb.200708018 · Cited by 106
Filamentous Actin Regulates Insulin Exocytosis through Direct Interaction with Syntaxin 4
Jewell, J. L., Luo, W. F., Oh, E., Wang, Z., & Thurmond, D. C. (2008) · Journal of Biological Chemistry · doi:10.1074/jbc.m709876200 · Cited by 108
Newcomer insulin secretory granules as a highly calcium-sensitive pool
Pedersen, M. G., & Sherman, A. (2009) · Proceedings of the National Academy of Sciences · doi:10.1073/pnas.0901202106 · Cited by 107
Leung, Y. M., Kwan, E. P., Ng, B., Kang, Y., & Gaisano, H. Y. (2007) · Endocrine Reviews · doi:10.1210/er.2007-0010 · Cited by 106
A dual role for IQGAP1 in regulating exocytosis
Rittmeyer, E. N., Daniel, S., Hsu, S.-C., & Osman, M. A. (2008) · Journal of Cell Science · doi:10.1242/jcs.016881 · Cited by 98
Insulin secretion from beta cells in intact mouse islets is targeted towards the vasculature
Low, J. T., Zavortink, M., Mitchell, J. M., Gan, W. J., Do, O. H., Schwiening, C. J., Gaisano, H. Y., & Thorn, P. (2014) · Diabetologia · doi:10.1007/s00125-014-3252-6 · Cited by 89
Zhou, K.-M., Dong, Y., Ge, Q., Zhu, D. Y., Zhou, W., Lin, X., Liang, T., Wu, Z., & Xu, T. (2007) · Neuron · doi:10.1016/j.neuron.2007.09.015 · Cited by 88
Kitaguchi, T., Oya, M., Wada, Y., Tsuboi, T., & Miyawaki, A. (2013) · Biochemical Journal · doi:10.1042/bj20121022 · Cited by 88
Dual Role of VAMP8 in Regulating Insulin Exocytosis and Islet β Cell Growth
Zhu, D., Zhang, Y., Lam, P. P. L., Dolai, S., Liu, Y., Cai, E. P., Choi, D., Schroer, S. A., Kang, Y., Allister, E. M., et al. (2012) · Cell Metabolism · doi:10.1016/j.cmet.2012.07.001 · Cited by 87
Zhu, D., Koo, E., Kwan, E., Kang, Y., Park, S., Xie, H., Sugita, S., & Gaisano, H. Y. (2013) · Diabetologia · doi:10.1007/s00125-012-2757-0 · Cited by 81
Oh, E., Kalwat, M. A., Kim, M.-J., Verhage, M., & Thurmond, D. C. (2012) · Journal of Biological Chemistry · doi:10.1074/jbc.m112.361501 · Cited by 80
Hoboth, P., Müller, A., Ivanova, A., Mziaut, H., Dehghany, J., Sönmez, A., Lachnit, M., Meyer‐Hermann, M., Kalaidzidis, Y. L., & Solimena, M. (2015) · Proceedings of the National Academy of Sciences · doi:10.1073/pnas.1409542112 · Cited by 77
Straub, S. G., & Sharp, G. W. G. (2012) · American Journal of Physiology-Cell Physiology · doi:10.1152/ajpcell.00282.2011 · Cited by 78
Cheng, K. K. Y., Lam, K. S. L., Wu, D., Wang, Y., Sweeney, G., Hoo, R. L. C., Zhang, J., & Xu, A. (2012) · Proceedings of the National Academy of Sciences · doi:10.1073/pnas.1202435109 · Cited by 77
Recent new insights into the role of SNARE and associated proteins in insulin granule exocytosis
Gaisano, H. Y. (2017) · Diabetes Obesity and Metabolism · doi:10.1111/dom.13001 · Cited by 75
CAPS1 and CAPS2 Regulate Stability and Recruitment of Insulin Granules in Mouse Pancreatic β Cells
Speidel, D., Salehi, A., Obermueller, S., Lundquist, I., Brose, N., Renström, E., & Rorsman, P. (2008) · Cell Metabolism · doi:10.1016/j.cmet.2007.11.009 · Cited by 75
Deletion of CDKAL1 Affects Mitochondrial ATP Generation and First-Phase Insulin Exocytosis
Ohara‐Imaizumi, M., Yoshida, M., Aoyagi, K., Saito, T., Okamura, T., Takenaka, H., Akimoto, Y., Nakamichi, Y., Yanobu‐Takanashi, R., Nishiwaki, C., et al. (2010) · PLoS ONE · doi:10.1371/journal.pone.0015553 · Cited by 74
Self-citationAnimal models of Williams syndrome
Osborne, L. R. (2010) · American Journal of Medical Genetics Part C Seminars in Medical Genetics · doi:10.1002/ajmg.c.30257 · Cited by 72
SNARE Conformational Changes that Prepare Vesicles for Exocytosis
Takahashi, N., Hatakeyama, H., Okado, H., Noguchi, J., Ohno, M., & Kasai, H. (2010) · Cell Metabolism · doi:10.1016/j.cmet.2010.05.013 · Cited by 70
Aoyagi, K., Ohara‐Imaizumi, M., Nishiwaki, C., Nakamichi, Y., & Nagamatsu, S. (2010) · Biochemical Journal · doi:10.1042/bj20100864 · Cited by 69
Self-citationExocytotic Vesicle Behaviour Assessed by Total Internal Reflection Fluorescence Microscopy
Burchfield, J. G., Lopez, J. A., Mele, K., Vallotton, P., & Hughes, W. E. (2010) · Traffic · doi:10.1111/j.1600-0854.2010.01039.x · Cited by 67
Chen, M., Hook, M. J. V., Zenisek, D., & Thoreson, W. B. (2013) · Journal of Neuroscience · doi:10.1523/jneurosci.3426-12.2013 · Cited by 66
TDP-43 regulates early-phase insulin secretion via CaV1.2-mediated exocytosis in islets
Araki, K., Araki, A., Honda, D., Izumoto, T., Hashizume, A., Hijikata, Y., Yamada, S., Iguchi, Y., Hara, A., Ikumi, K., et al. (2019) · Journal of Clinical Investigation · doi:10.1172/jci124481 · Cited by 64
Self-citationMunc18c Depletion Selectively Impairs the Sustained Phase of Insulin Release
Oh, E., & Thurmond, D. C. (2009) · Diabetes · doi:10.2337/db08-1059 · Cited by 64
Munc 18‐1 and Granuphilin Collaborate During Insulin Granule Exocytosis
Tomás, A., Meda, P., Regazzi, R., Pessin, J. E., & Halban, P. A. (2008) · Traffic · doi:10.1111/j.1600-0854.2008.00709.x · Cited by 61
Exocytotic Properties of Human Pancreatic β‐cells
Braun, M., Ramracheya, R., Johnson, P. R., & Rorsman, P. (2009) · Annals of the New York Academy of Sciences · doi:10.1111/j.1749-6632.2008.03992.x · Cited by 60
Mourad, N. I., Nenquin, M., & Henquin, J. (2010) · American Journal of Physiology-Cell Physiology · doi:10.1152/ajpcell.00138.2010 · Cited by 59
Recent Insights into Beta-cell Exocytosis in Type 2 Diabetes
Thurmond, D. C., & Gaisano, H. Y. (2019) · Journal of Molecular Biology · doi:10.1016/j.jmb.2019.12.012 · Cited by 53
Here come the newcomer granules, better late than never
Gaisano, H. Y. (2014) · Trends in Endocrinology & Metabolism · doi:10.1016/j.tem.2014.03.005 · Cited by 53
Mitochondria mediated cell death in diabetes
Szabadkai, G., & Duchen, M. R. (2009) · APOPTOSIS · doi:10.1007/s10495-009-0363-5 · Cited by 54
Tsuboi, T., Kitaguchi, T., Karasawa, S., Fukuda, M., & Miyawaki, A. (2009) · Molecular Biology of the Cell · doi:10.1091/mbc.e09-08-0722 · Cited by 51
Doc2b Is a Key Effector of Insulin Secretion and Skeletal Muscle Insulin Sensitivity
Ramalingam, L., Oh, E., Yoder, S. M., Brozinick, J. T., Kalwat, M. A., Groffen, A. J. A., Verhage, M., & Thurmond, D. C. (2012) · Diabetes · doi:10.2337/db11-1525 · Cited by 50
Survey of Red Fluorescence Proteins as Markers for Secretory Granule Exocytosis
Gandasi, N. R., Vestö, K., Helou, M., Yin, P., Saras, J., & Barg, S. (2015) · PLoS ONE · doi:10.1371/journal.pone.0127801 · Cited by 48
High prevalence of diabetes and pre‐diabetes in adults with Williams syndrome
Pober, B. R., Wang, E., Caprio, S., Petersen, K. F., Brandt, C., Stanley, T. L., Osborne, L. R., Dzuria, J., & Gulanski, B. (2010) · American Journal of Medical Genetics Part C Seminars in Medical Genetics · doi:10.1002/ajmg.c.30261 · Cited by 47
Exocytosis proteins as novel targets for diabetes prevention and/or remediation?
Aslamy, A., & Thurmond, D. C. (2017) · American Journal of Physiology-Regulatory, Integrative and Comparative Physiology · doi:10.1152/ajpregu.00002.2017 · Cited by 46
A fluorescent timer reporter enables sorting of insulin secretory granules by age
Yau, B., Hays, L. B., Liang, C., Laybutt, D. R., Thomas, H. E., Gunton, J. E., Williams, L. J., Hawthorne, W. J., Thorn, P., Rhodes, C. J., et al. (2020) · Journal of Biological Chemistry · doi:10.1074/jbc.ra120.012432 · Cited by 47
Munc18b Is a Major Mediator of Insulin Exocytosis in Rat Pancreatic β-Cells
Lam, P. P. L., Ohno, M., Dolai, S., He, Y., Qin, T., Liang, T., Zhu, D., Kang, Y., Liu, Y., Kauppi, M., et al. (2013) · Diabetes · doi:10.2337/db12-1380 · Cited by 44
“In contrast, Syn-1A coimmunoprecipitated endogenous Munc18a and remained able to form complexes with SNAP25 and VAMP2 (Fig.”
BackgroundInfluentialWheeler, S. E., Stacey, H. M., Nahaei, Y., Hale, S. J., Hardy, A. B., Reimann, F. M., Gribble, F. M., Larraufie, P., Gaisano, H. Y., & Brubaker, P. L. (2017) · Diabetes · doi:10.2337/db16-1403 · Cited by 43
Gelsolin Associates with the N Terminus of Syntaxin 4 to Regulate Insulin Granule Exocytosis
Kalwat, M. A., Wiseman, D. A., Luo, W. F., Wang, Z., & Thurmond, D. C. (2011) · Molecular Endocrinology · doi:10.1210/me.2011-1112 · Cited by 44
Trus, M., Corkey, R. F., Nesher, R., Richard, A.-M. T., Deeney, J. T., Corkey, B. E., & Atlas, D. (2007) · Biochemistry · doi:10.1021/bi7016816 · Cited by 44
Low, J. T., Mitchell, J. M., Do, O. H., Bax, J., Rawlings, A., Zavortink, M., Morgan, G., Parton, R. G., Gaisano, H. Y., & Thorn, P. (2013) · Diabetologia · doi:10.1007/s00125-013-3019-5 · Cited by 43
Oh, E., Stull, N. D., Mirmira, R. G., & Thurmond, D. C. (2014) · The Journal of Clinical Endocrinology & Metabolism · doi:10.1210/jc.2013-2221 · Cited by 43
Insulin Biosynthetic Interaction Network Component, TMEM24, Facilitates Insulin Reserve Pool Release
Pottekat, A., Becker, S. A., Spencer, K. R., Yates, J. R., Manning, G., Itkin‐Ansari, P., & Balch, W. E. (2013) · Cell Reports · doi:10.1016/j.celrep.2013.07.050 · Cited by 40
Hara, H., Aizaki, H., Matsuda, M., Shinkai‐Ouchi, F., Inoue, Y., Murakami, K., Shoji, I., Kawakami, H., Matsuura, Y., Lai, M. M. C., et al. (2009) · Journal of Virology · doi:10.1128/jvi.02179-08 · Cited by 43
Self-citationMultivesicular exocytosis in rat pancreatic beta cells
Hoppa, M. B., Jones, E., Karanauskaite, J., Ramracheya, R., Braun, M., Collins, S., Zhang, Q., Clark, A., Eliasson, L., Genoud, C., et al. (2011) · Diabetologia · doi:10.1007/s00125-011-2400-5 · Cited by 41
Spatial and temporal coordination of insulin granule exocytosis in intact human pancreatic islets
Almaça, J., Liang, T., Gaisano, H. Y., Nam, H. G., Berggren, P., & Caicedo, A. (2015) · Diabetologia · doi:10.1007/s00125-015-3747-9 · Cited by 44
MiR‐335 overexpression impairs insulin secretion through defective priming of insulin vesicles
Salunkhe, V. A., Ofori, J. K., Gandasi, N. R., Salö, S., Hansson, S., Andersson, M. E., Wendt, A., Barg, S., Esguerra, J. L. S., & Eliasson, L. (2017) · Physiological Reports · doi:10.14814/phy2.13493 · Cited by 41
New Roles of Syntaxin-1A in Insulin Granule Exocytosis and Replenishment
Liang, T., Qin, T., Xie, L., Dolai, S., Zhu, D. Y., Prentice, K. J., Wheeler, M. B., Kang, Y., Osborne, L. R., & Gaisano, H. Y. (2016) · Journal of Biological Chemistry · doi:10.1074/jbc.m116.769885 · Cited by 39
Metabolic abnormalities in Williams–Beuren syndrome
Palacios-Verdú, M. G., Puimedon, M. S., Borralleras, C., Flores, R., Campo, M. D., Campuzano, V., & Jurado, L. A. P. (2015) · Journal of Medical Genetics · doi:10.1136/jmedgenet-2014-102713 · Cited by 40
The Pancreatic β-Cell: The Perfect Redox System
Ježek, P., Holendová, B., Jabůrek, M., Tauber, J. A., Dlasková, A., & Plecitá‐Hlavatá, L. (2021) · Antioxidants · doi:10.3390/antiox10020197 · Cited by 38
Tsuyama, T., Sato, Y., Yoshizawa, T., Matsuoka, T., & Yamagata, K. (2023) · EMBO Reports · doi:10.15252/embr.202256227 · Cited by 42
Xie, L., Zhu, D., Dolai, S., Liang, T., Qin, T.-R., Kang, Y., Xie, H., Huang, Y.-C., & Gaisano, H. (2015) · Diabetologia · doi:10.1007/s00125-015-3545-4 · Cited by 40
Distinct Actions of Rab3 and Rab27 GTPases on Late Stages of Exocytosis of Insulin
Cazares, V. A., Subramani, A., Saldate, J. J., Hoerauf, W. W., & Stuenkel, E. L. (2014) · Traffic · doi:10.1111/tra.12182 · Cited by 38
Gαo Represses Insulin Secretion by Reducing Vesicular Docking in Pancreatic β-Cells
Zhao, A., Ohara‐Imaizumi, M., Brissova, M., Benninger, R. K. P., Xu, Y., Hao, Y., Abramowitz, J., Boulay, G., Powers, A. C., Piston, D. W., et al. (2010) · Diabetes · doi:10.2337/db09-1719 · Cited by 36
Self-citationAoyagi, K., Ohara‐Imaizumi, M., Itakura, M., Torii, S., Akimoto, Y., Nishiwaki, C., Nakamichi, Y., Kishimoto, T., Kawakami, H., Harada, A., et al. (2016) · Diabetes · doi:10.2337/db15-1207 · Cited by 36
Self-citationLi, S. K., Zhu, D. Y., Gaisano, H. Y., & Brubaker, P. L. (2013) · Diabetologia · doi:10.1007/s00125-013-3143-2 · Cited by 36
Kasai, H., Hatakeyama, H., Ohno, M., & Takahashi, N. K. (2010) · Advances in experimental medicine and biology · doi:10.1007/978-90-481-3271-3_14 · Cited by 34
Wiseman, D. A., & Thurmond, D. C. (2012) · Current Diabetes Reviews · doi:10.2174/157339912800840514 · Cited by 34
Nan, H., Han, L., Ma, J., Yang, C., Su, R., & He, J. (2018) · Biochimica et Biophysica Acta (BBA) - Molecular Basis of Disease · doi:10.1016/j.bbadis.2018.01.031 · Cited by 33
Ramalingam, L., Oh, E., & Thurmond, D. C. (2014) · Diabetologia · doi:10.1007/s00125-014-3227-7 · Cited by 33
Oberkofler, H., Hafner, M., Felder, T. K., Krempler, F., & Patsch, W. (2008) · Journal of Molecular Medicine · doi:10.1007/s00109-008-0425-0 · Cited by 33
Aoyagi, K., Ohara‐Imaizumi, M., Nishiwaki, C., Nakamichi, Y., Ueki, K., Kadowaki, T., & Nagamatsu, S. (2012) · PLoS ONE · doi:10.1371/journal.pone.0047381 · Cited by 33
Self-citationOhara‐Imaizumi, M., Aoyagi, K., Yamauchi, H., Yoshida, M., Mori, M. X., Hida, Y., Tran, H. N., Ohkura, M., Abe, M., Akimoto, Y., et al. (2019) · Cell Reports · doi:10.1016/j.celrep.2018.12.106 · Cited by 33
Self-citationSyntaxin 1A regulates surface expression of β-cell ATP-sensitive potassium channels
Chen, P., Bruederle, C. E., Gaisano, H. Y., & Shyng, S. (2011) · American Journal of Physiology-Cell Physiology · doi:10.1152/ajpcell.00429.2010 · Cited by 31
Xie, L., Zhu, D., & Gaisano, H. Y. (2012) · Diabetologia · doi:10.1007/s00125-012-2640-z · Cited by 31
Liu, S., Promes, J. A., Harata, M., Mishra, A., Stephens, S. B., Taylor, E. B., Burand, A. J., Sivitz, W. I., Fink, B. D., Ankrum, J. A., et al. (2020) · Diabetes · doi:10.2337/db19-0951 · Cited by 33
Fujihira, H., Masahara-Negishi, Y., Akimoto, Y., Hirayama, H., Lee, H., Story, B. A., Mueller, W. F., Jakob, P., Clauder‐Münster, S., Steinmetz, L. M., et al. (2019) · Biochimica et Biophysica Acta (BBA) - Molecular Basis of Disease · doi:10.1016/j.bbadis.2019.165588 · Cited by 30
Self-citationTrogden, K. P., Lee, J., Bracey, K. M., Ho, K.-H., McKinney, H., Zhu, X.-D., Arpağ, G., Folland, T., Osipovich, A. B., Magnuson, M. A., et al. (2021) · eLife · doi:10.7554/elife.59912 · Cited by 20
Mishima, T., Fujiwara, T., Kofuji, T., & Akagawa, K. (2012) · Journal of Neuroscience · doi:10.1523/jneurosci.2911-11.2012 · Cited by 29
Self-citationOpposing roles for SNAP23 in secretion in exocrine and endocrine pancreatic cells
Kunii, M., Ohara‐Imaizumi, M., Takahashi, N. K., Kobayashi, M., Kawakami, R., Kondoh, Y., Shimizu, T., Simizu, S., Lin, B., Nunomura, K., et al. (2016) · The Journal of Cell Biology · doi:10.1083/jcb.201604030 · Cited by 29
Self-citationYu, H., Rathore, S. S., Gulbranson, D. R., & Shen, J. (2014) · Journal of Biological Chemistry · doi:10.1074/jbc.m114.591487 · Cited by 28
Zhu, D., Xie, L., Karimian, N., Liang, T., Kang, Y., Huang, Y.-C., & Gaisano, H. (2015) · Molecular Metabolism · doi:10.1016/j.molmet.2015.02.004 · Cited by 32
Ohara‐Imaizumi, M., Aoyagi, K., Nakamichi, Y., Nishiwaki, C., Sakurai, T., & Nagamatsu, S. (2009) · Biochemical and Biophysical Research Communications · doi:10.1016/j.bbrc.2009.04.155 · Cited by 26
Self-citationMourad, N., Nenquin, M., & Henquin, J. (2012) · Endocrinology · doi:10.1210/en.2012-1450 · Cited by 30
DOC2b is a SNARE regulator of glucose-stimulated delayed insulin secretion
Miyazaki, M., Emoto, M., Fukuda, N., Hatanaka, M., Taguchi, A., Miyamoto, S., & Tanizawa, Y. (2009) · Biochemical and Biophysical Research Communications · doi:10.1016/j.bbrc.2009.04.133 · Cited by 26
Suckow, A. T., Zhang, C., Egodage, S., Comoletti, D., Taylor, P., Miller, M. T., Sweet, I. R., & Chessler, S. D. (2012) · Journal of Biological Chemistry · doi:10.1074/jbc.m111.280537 · Cited by 26
Wang, H., Ishizaki, R., Kobayashi, E., Fujiwara, T., Akagawa, K., & Izumi, T. (2011) · Journal of Biological Chemistry · doi:10.1074/jbc.m111.268631 · Cited by 25
Self-citationA 4D view on insulin secretory granule turnover in the β‐cell
Müller, A., Mziaut, H., Neukam, M., Knoch, K.-P., & Solimena, M. (2017) · Diabetes Obesity and Metabolism · doi:10.1111/dom.13015 · Cited by 23
Yang, R.-G., Xi, N., Lai, K., Patterson, K. C., Chen, H.-Z., Song, B., Qu, C., Zhong, B., & Wang, D. H. (2012) · Nanomedicine: Nanotechnology, Biology and Medicine · doi:10.1016/j.nano.2012.10.011 · Cited by 25
Metadata
- Authors
- Ohara-Imaizumi, M., Fujiwara, T., Nakamichi, Y., Okamura, T., Akimoto, Y., Kawai, J., Matsushima, S., Kawakami, H., Watanabe, T., Akagawa, K., & Nagamatsu, S.
- Affiliations
- 1Department of Biochemistry
- 2Department of Cell Physiology
- 5Division of Animal Models, Department of Infectious Diseases, Research Institute, International Medical Center of Japan, Tokyo 162-8655, Japan
- 3Department of Anatomy,
- Juntendo University (JP)
- Kyorin University (JP)
- Corresponding author
- Nagamatsu, Shinya
- Venue
- The Journal of Cell Biology
- Publisher
- Rockefeller University Press
- Published
- 2007-05-14
- Volume
- 177
- Issue
- 4
- Pages
- 695-705
- ISSN
- 0021-9525 (ISSN-L)
- 1540-8140
- PMC
- PMC2064214
- OpenAlex
- W2124167615
- Cited by
- 211
- References
- 46
- Citations by year
- 2026: 2 · 2025: 6 · 2024: 4 · 2023: 9 · 2022: 7 · 2021: 10 · 2020: 6 · 2019: 7 · 2018: 6 · 2017: 13 · 2016: 5 · 2015: 11 · 2014: 16 · 2013: 10 · 2012: 23
- FWCI
- 18.64
- Type
- journal article
- Language
- en
- Open access
- green
- www.ncbi.nlm.nih.gov
- Licence
- cc-by-nc-sa
- Locations
- The Journal of Cell Biology (publishedVersion)
- PubMed Central (publishedVersion, cc-by-nc-sa)
- PubMed (publishedVersion)
- Topics
- Health Sciences › Medicine › Endocrinology, Diabetes and Metabolism › Pancreatic function and diabetes
- Life Sciences › Biochemistry, Genetics and Molecular Biology › Cell Biology › Cellular transport and secretion
- Life Sciences › Biochemistry, Genetics and Molecular Biology › Physiology › Calcium signaling and nucleotide metabolism
- Keywords
- insulin exocytosis, first-phase insulin secretion, second-phase insulin secretion, syntaxin 1A, syntaxin 3, syntaxin 4, granule fusion, pancreatic beta cells, glucose-induced insulin release
- MeSH terms
- Insulin Secretion, Animals, Cells, Cultured, Exocytosis, Insulin, Islets of Langerhans, Male, Microscopy, Fluorescence, Mice, Knockout, Mice
About these checks
Registry, retraction, Cites and statistics results are computed, not judged, with one exception: a printed reference that no index lists is read once by a model before it counts as a citation error. Claims are extracted by a model and kept only when their quote appears verbatim in the text; each cited source is then checked, with a model’s help, for whether it says what the claim relies on. Those verdicts can be wrong — read the claim’s quote and the cited source before relying on one.
Statistics and arithmetic are recomputed, not judged.
Confidence bands are shown only for fields calibrated on our annotated test set. None is calibrated yet, so no band is shown.
What counts as a claim ›How we measure confidence ›How we check this ›
Are you an author, or do you see a problem with this page? Request a review
