

The DOI matches its Crossref record; 84 of the 84 references it cites were found in a registry or an index.
Phospholipase C-γ2 and Vav cooperate within signaling microclusters to propagate B cell spreading in response to membrane-bound antigen
Open accessAbstract
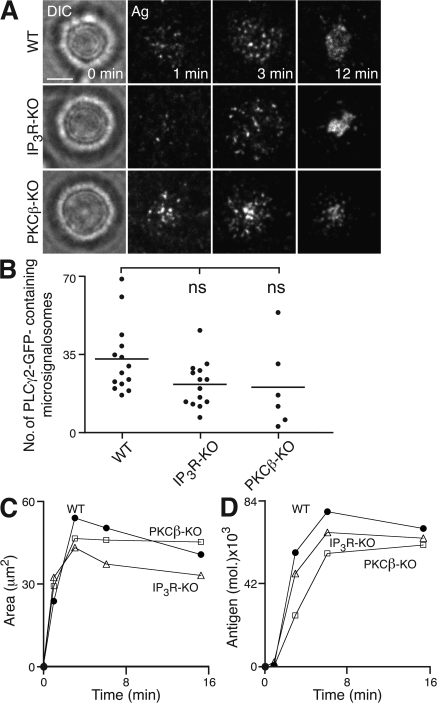
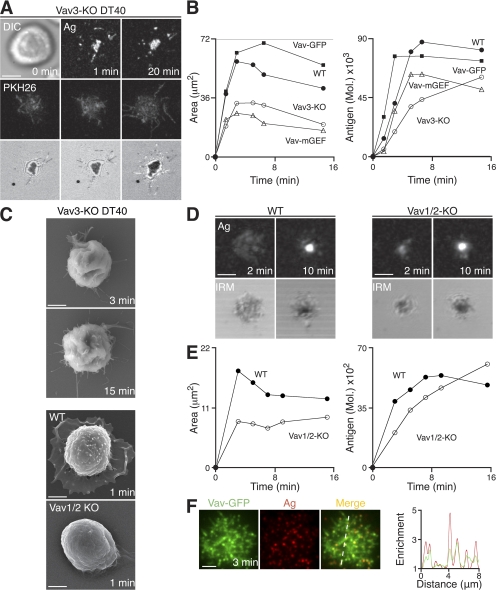
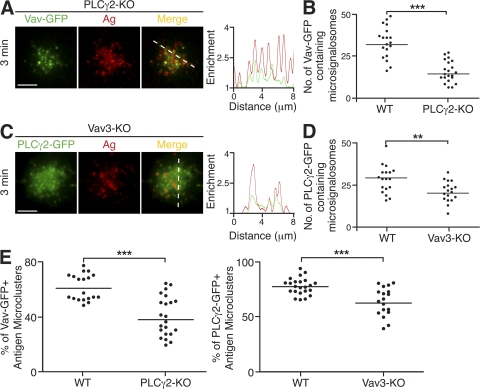
B cell receptor (BCR) recognition of membrane-bound antigen initiates a spreading and contraction response, the extent of which is controlled through the formation of signaling-active BCR-antigen microclusters and ultimately affects the outcome of B cell activation. We followed a genetic approach to define the molecular requirements of BCR-induced spreading and microcluster formation. We identify a key role for phospholipase C-γ2 (PLCγ2), Vav, B cell linker, and Bruton's tyrosine kinase in the formation of highly coordinated “microsignalosomes,” the efficient assembly of which is absolutely dependent on Lyn and Syk. Using total internal reflection fluorescence microscopy, we examine at high resolution the recruitment of PLCγ2 and Vav to microsignalosomes, establishing a novel synergistic relationship between the two. Thus, we demonstrate the importance of cooperation between components of the microsignalosome in the amplification of signaling and propagation of B cell spreading, which is critical for appropriate B cell activation.
Overview
The claims and statistics of this paper haven’t been checked yet.
Run the check — free, no account needed. It reads the open-access text and checks the sources it cites.
Integrity signals
Registry
Cites
Statistics
Figures
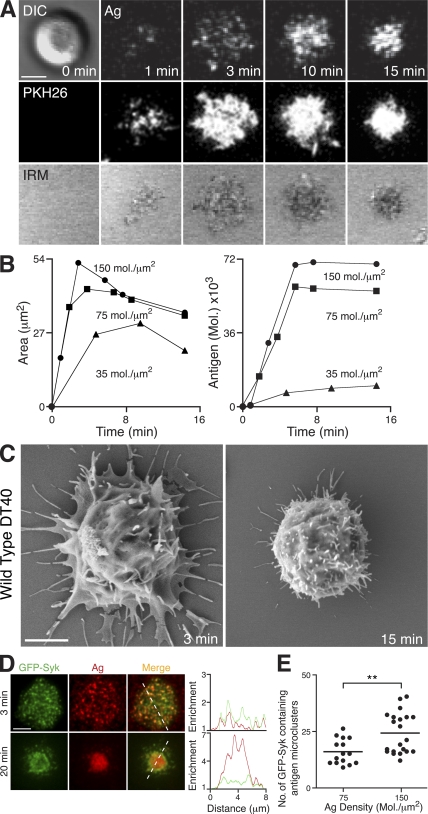
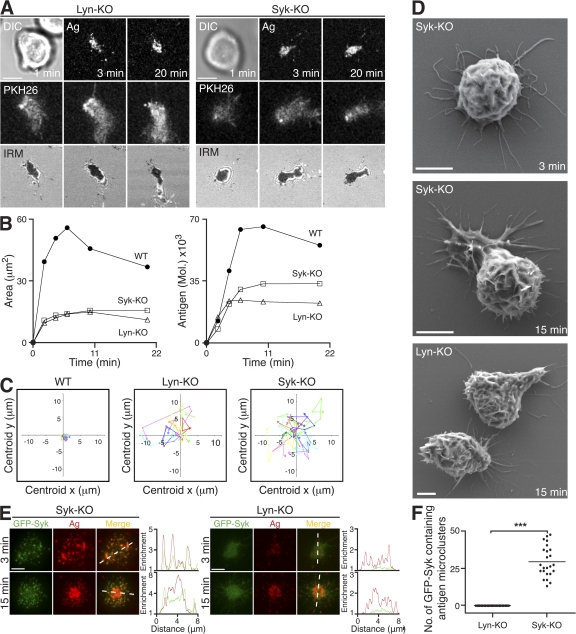
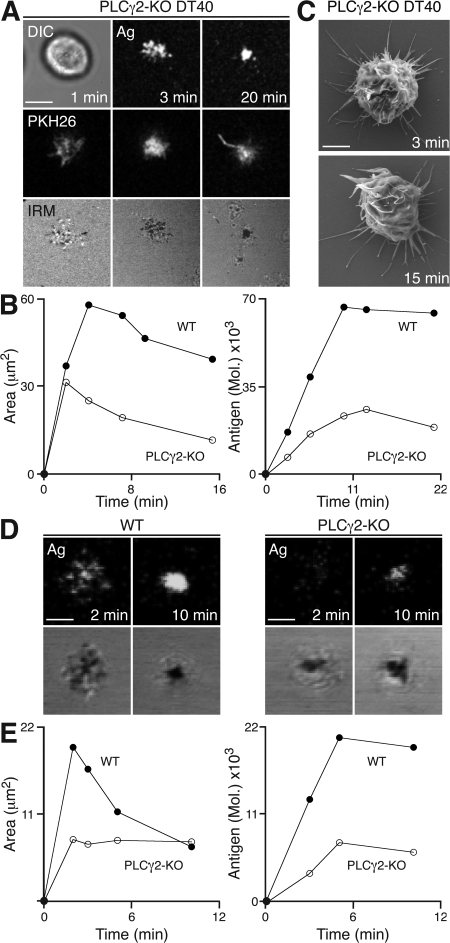
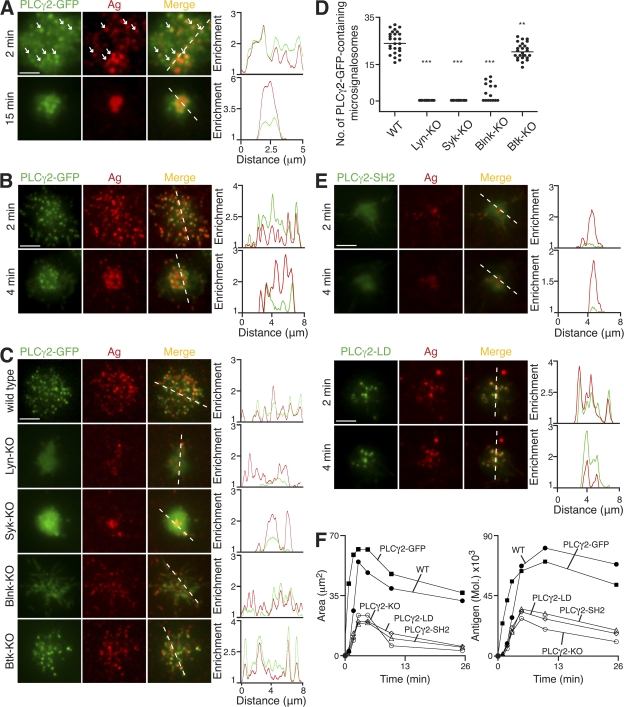
Verification
Claims the paper makes
The claims and statistics of this paper haven’t been checked yet.
Run the check — free, no account needed. It reads the open-access text and checks the sources it cites.
Claims other papers make about this one
Each is checked against this paper’s own text: does it say what the citing paper says it does?
The source backs part of the claim, not all of it — or backs it for a different population, condition or comparison.
In the citing paper
“In addition to the production of IP3, DAG, and calcium flux, PLCγ2 activation results in activation of phospholipase D and cell spreading (12, 13, 14, 15, 16, 17), bringing on other vital cell signaling processes such as Erk (18).”
From The role of PLCγ2 in immunological disorders, cancer, and neurodegeneration (2021) · cites this paper as [17]
Experimental — accuracy not yet measuredThe cited source says what the claim attributes to it.
In the citing paper
“Very interestingly, efficient assembly of the latter is absolutely dependent on Lyn and Syk (55).”
Self-check
Percentages, sums and reported differences re-computed from the paper’s own numbers.
The self-check needs the paper’s full text.
Citations
Cites
The Immunological Synapse: A Molecular Machine Controlling T Cell Activation
Grakoui, A., Bromley, S. K., Sumen, C., Davis, M. M., Shaw, A. S., Allen, P. M., & Dustin, M. L. (1999) · Science · doi:10.1126/science.285.5425.221 · Cited by 3,110
RHO GTPASES: Biochemistry and Biology
Jaffe, A. B., & Hall, A. (2005) · Annual Review of Cell and Developmental Biology · doi:10.1146/annurev.cellbio.21.020604.150721 · Cited by 3,009
Three-dimensional segregation of supramolecular activation clusters in T cells
Monks, C. R. F., Freiberg, B. A., Kupfer, H., Sciaky, N., & Kupfer, A. (1998) · Nature · doi:10.1038/25764 · Cited by 2,353
Regulation of Phosphoinositide-Specific Phospholipase C
Rhee, S. G. (2001) · Annual Review of Biochemistry · doi:10.1146/annurev.biochem.70.1.281 · Cited by 1,628
Goodnow, C. C., Crosbie, J. C., Adelstein, S., Lavoie, T., Smith‐Gill, S. J., Brink, R. A., Pritchard-Briscoe, H., Wotherspoon, J. S., Loblay, R. H., Raphael, K., et al. (1988) · Nature · doi:10.1038/334676a0 · Cited by 1,568
Varma, R., Campi, G., Yokosuka, T., Saito, T., & Dustin, M. L. (2006) · Immunity · doi:10.1016/j.immuni.2006.04.010 · Cited by 882
Junt, T., Moseman, E. A., Iannacone, M., Massberg, S., Lang, P. A., Boes, M., Fink, K., Henrickson, S. E., Shayakhmetov, D. M., Di Paolo, N. C., et al. (2007) · Nature · doi:10.1038/nature06287 · Cited by 846
B lymphocyte-specific, Cre-mediated mutagenesis in mice
Rickert, R. (1997) · Nucleic Acids Research · doi:10.1093/nar/25.6.1317 · Cited by 729
Yokosuka, T., Sakata-Sogawa, K., Kobayashi, W., Hiroshima, M., Hashimoto, A. S., Tokunaga, M., Dustin, M. L., & Saito, T. (2005) · Nature Immunology · doi:10.1038/ni1272 · Cited by 702
Regulation of B-cell fate by antigen-receptor signals
Niiro, H., & Clark, E. A. (2002) · Nature reviews. Immunology · doi:10.1038/nri955 · Cited by 654
Takata, M., Sabe, H., Hata, A., Inazu, T., Homma, Y., Nukada, T., Yamamura, H., & Kurosaki, T. (1994) · The EMBO Journal · doi:10.1002/j.1460-2075.1994.tb06387.x · Cited by 650
Self-citationSubcapsular encounter and complement-dependent transport of immune complexes by lymph node B cells
Phan, T. G., Grigorova, I., Okada, T., & Cyster, J. G. (2007) · Nature Immunology · doi:10.1038/ni1494 · Cited by 644
Campi, G., Varma, R., & Dustin, M. L. (2005) · The Journal of Experimental Medicine · doi:10.1084/jem.20051182 · Cited by 639
T cell receptor ligation induces the formation of dynamically regulated signaling assemblies
Bunnell, S. C., Hong, D. I., Kardon, J. R., Yamazaki, T., McGlade, C. J., Barr, V. A., & Samelson, L. E. (2002) · The Journal of Cell Biology · doi:10.1083/jcb.200203043 · Cited by 633
B cells acquire antigen from target cells after synapse formation
Batista, F. D., Iber, D., & Neuberger, M. S. (2001) · Nature · doi:10.1038/35078099 · Cited by 629
Self-citationBalázs, M., Martin, F., Zhou, T., & Kearney, J. F. (2002) · Immunity · doi:10.1016/s1074-7613(02)00389-8 · Cited by 624
Carrasco, Y. R., & Batista, F. D. (2007) · Immunity · doi:10.1016/j.immuni.2007.06.007 · Cited by 611
Self-citationActivation of phospholipase Cγ by PI 3‐kinase‐induced PH domain‐mediated membrane targeting
Falasca, M., Logan, S. K., Lehto, V. P., Baccante, G., Lemmon, M. A., & Schlessinger, J. (1998) · The EMBO Journal · doi:10.1093/emboj/17.2.414 · Cited by 567
B cell antigen receptor signaling 101
DalPorto, J. (2004) · Molecular Immunology · doi:10.1016/j.molimm.2004.04.008 · Cited by 554
Regulation of B Lymphocyte Responses to Foreign and Self-Antigens by the CD19/CD21 Complex
Fearon, D. T., Carroll, M. C., & Carroll, M. C. (2000) · Annual Review of Immunology · doi:10.1146/annurev.immunol.18.1.393 · Cited by 529
Fu (1998) · doi:10.1016/s1074-7613(00)80591-9 · Cited by 518
Self-citationSakai, K., & Miyazaki, J. (1997) · Biochemical and Biophysical Research Communications · doi:10.1006/bbrc.1997.7111 · Cited by 494
Wykes, M., Pombo, A., Jenkins, C., & MacPherson, G. G. (1998) · The Journal of Immunology · doi:10.4049/jimmunol.161.3.1313 · Cited by 461
INITIATION AND PROCESSING OF SIGNALS FROM THE B CELL ANTIGEN RECEPTOR
Reth, M. G., & Wienands, J. (1997) · Annual Review of Immunology · doi:10.1146/annurev.immunol.15.1.453 · Cited by 444
GENETIC ANALYSIS OF B CELL ANTIGEN RECEPTOR SIGNALING
Kurosaki, T. (1999) · Annual Review of Immunology · doi:10.1146/annurev.immunol.17.1.555 · Cited by 432
Self-citationScharenberg, A. M., El-Hillal, O., Fruman, D. A., Beitz, L., Li, Z., Lin, S., Gout, I. T., Cantley, L. C., Rawlings, D. J., & Kinet, J.-P. (1998) · The EMBO Journal · doi:10.1093/emboj/17.7.1961 · Cited by 428
B Cell Ligand Discrimination Through a Spreading and Contraction Response
Fleire, S. J., Goldman, J., Carrasco, Y. R., Weber, M., Bray, D., & Batista, F. D. (2006) · Science · doi:10.1126/science.1123940 · Cited by 425
Self-citationSugawara, H., Kurosaki, M., Takata, M., & Kurosaki, T. (1997) · The EMBO Journal · doi:10.1093/emboj/16.11.3078 · Cited by 411
Self-citationDynamic Actin Polymerization Drives T Cell Receptor–Induced Spreading
Bunnell, S. C., Kapoor, V., Trible, R. P., Zhang, W., & Samelson, L. E. (2001) · Immunity · doi:10.1016/s1074-7613(01)00112-1 · Cited by 409
Holsinger, L. J., Graef, I. A., Swat, W., Chi, T., Bautista, D. M., Davidson, L., Lewis, R. S., Alt, F. W., & Crabtree, G. R. (1998) · Current Biology · doi:10.1016/s0960-9822(98)70225-8 · Cited by 402
Fluckiger, A.-C., Li, Z., Kato, R. M., Wahl, M. I., Ochs, H. D., Longnecker, R., Kinet, J.-P., Witte, O. N., Scharenberg, A. M., & Rawlings, D. J. (1998) · The EMBO Journal · doi:10.1093/emboj/17.7.1973 · Cited by 399
SHIP Modulates Immune Receptor Responses by Regulating Membrane Association of Btk
Bolland, S. M., Pearse, R. N., Kurosaki, T., & Ravetch, J. V. (1998) · Immunity · doi:10.1016/s1074-7613(00)80555-5 · Cited by 384
Self-citationDepoil, D., Fleire, S. J., Treanor, B., Weber, M., Harwood, N. E., Marchbank, K. J., Tybulewicz, V. L. J., & Batista, F. D. (2007) · Nature Immunology · doi:10.1038/ni1547 · Cited by 369
Self-citationCarrasco, Y. R., Fleire, S. J., Cameron, T. O., Dustin, M. L., & Batista, F. D. (2004) · Immunity · doi:10.1016/s1074-7613(04)00105-0 · Cited by 345
Self-citationBLNK Required for Coupling Syk to PLCγ2 and Rac1-JNK in B Cells
Ishiai, M., Kurosaki, M., Pappu, R., Okawa, K., Ronko, I., Fu, C., Shibata, M., Iwamatsu, A., Chan, A. C., & Kurosaki, T. (1999) · Immunity · doi:10.1016/s1074-7613(00)80012-6 · Cited by 318
Self-citationDesMarais, V. M., Ghosh, M., Eddy, R. J., & Condeelis, J. S. (2004) · Journal of Cell Science · doi:10.1242/jcs.01631 · Cited by 301
Delon, J., Kaibuchi, K., & Germain, R. N. (2001) · Immunity · doi:10.1016/s1074-7613(01)00231-x · Cited by 297
Knockouts of Src-family kinases: stiff bones, wimpy T cells, and bad memories.Preprint
Lowell, C. A., & Soriano, P. M. (1996) · Genes & Development · doi:10.1101/gad.10.15.1845 · Cited by 285
ERM proteins regulate cytoskeleton relaxation promoting T cell–APC conjugation
Faure, S., Salazar‐Fontana, L. I., Sémichon, M., Tybulewicz, V. L. J., Bismuth, G., Trautmann, A., Germain, R. N., & Delon, J. (2004) · Nature Immunology · doi:10.1038/ni1039 · Cited by 284
Wienands, J., Schweikert, J., Wollscheid, B., Jumaa, H., Nielsen, P. J., & Reth, M. (1998) · The Journal of Experimental Medicine · doi:10.1084/jem.188.4.791 · Cited by 271
The complexity of signaling pathways activated by the BCR
DeFranco, A. L. (1997) · Current Opinion in Immunology · doi:10.1016/s0952-7915(97)80074-x · Cited by 251
Calcium signalling and cell-fate choice in B cells
Scharenberg, A. M., Humphries, L. A., & Rawlings, D. J. (2007) · Nature Reviews Immunology · doi:10.1038/nri2172 · Cited by 225
Szakal, A. K., Kosco, M. H., & Tew, J. G. (1988) · The Journal of Immunology · doi:10.4049/jimmunol.140.2.341 · Cited by 224
Vav proteins, masters of the world of cytoskeleton organization
Hornstein, I., Alcover, A., & Katzav, S. (2003) · Cellular Signalling · doi:10.1016/s0898-6568(03)00110-4 · Cited by 223
Goodnow, C. C., Crosbie, J., Adelstein, S., Lavoie, T., Smith‐Gill, S. J., Brink, R. A., Pritchard-Briscoe, H., Wotherspoon, J. S., Loblay, R. H., Raphael, K., et al. (2009) · PubMed · Cited by 221
Reynolds, L. F., Smyth, L. A., Norton, T., Freshney, N. W., Downward, J., Kioussis, D., & Tybulewicz, V. L. J. (2002) · The Journal of Experimental Medicine · doi:10.1084/jem.20011663 · Cited by 217
Hashimoto, S., Iwamatsu, A., Ishiai, M., Okawa, K., Yamadori, T., Matsushita, M., Baba, Y., Kishimoto, T., Kurosaki, T., & Tsukada, S. (1999) · Blood · doi:10.1182/blood.v94.7.2357.419k40_2357_2364 · Cited by 210
Self-citationHS1 Functions as an Essential Actin-Regulatory Adaptor Protein at the Immune Synapse
Gomez, T. S., McCarney, S., Carrizosa, E., Labno, C. M., Comiskey, E. O., Nolz, J. C., Zhu, P., Freedman, B. D., Clark, M. R., Rawlings, D. J., et al. (2006) · Immunity · doi:10.1016/j.immuni.2006.03.022 · Cited by 209
Regulation of B-cell signal transduction by adaptor proteins
Kurosaki, T. (2002) · Nature Reviews Immunology · doi:10.1038/nri801 · Cited by 209
Self-citationGupta, N., Wollscheid, B., Watts, J. D., Scheer, B., Aebersold, R. H., & DeFranco, A. L. (2006) · Nature Immunology · doi:10.1038/ni1337 · Cited by 195
Fruman, D. A., Satterthwaite, A. B., & Witte, O. N. (2000) · Immunity · doi:10.1016/s1074-7613(00)00002-9 · Cited by 191
Signal transduction through Vav-2 participates in humoral immune responses and B cell maturation
Doody, G. M., Bell, S. E., Vigorito, E., Clayton, E., McAdam, S., Tooze, R. M., Fernandez, C., Lee, I. J., & Turner, M. (2001) · Nature Immunology · doi:10.1038/88748 · Cited by 180
O'Rourke, L. M., Tooze, R. M., Turner, M., Sandoval, D. M., Carter, R. H., Tybulewicz, V. L. J., & Fearon, D. T. (1998) · Immunity · doi:10.1016/s1074-7613(00)80568-3 · Cited by 175
Yonezawa, N., Homma, Y., Yahara, I., Sakai, H., & Nishida, E. (1991) · Journal of Biological Chemistry · doi:10.1016/s0021-9258(19)47361-4 · Cited by 175
Evidence for an IgD homologue on chicken lymphocytes.
Chen, C.-L. H., Lehmeyer, J. E., & Cooper, M. D. (1982) · The Journal of Immunology · doi:10.4049/jimmunol.129.6.2580 · Cited by 160
Cutting Edge: Essential Role of Phospholipase C-γ2 in B Cell Development and Function
Hashimoto, A., Takeda, K., Inaba, M., Sekimata, M., Kaisho, T., Ikehara, S., Homma, Y., Akira, S., & Kurosaki, T. (2000) · The Journal of Immunology · doi:10.4049/jimmunol.165.4.1738 · Cited by 155
Self-citationVav1 Regulates Phospholipase Cγ Activation and Calcium Responses in Mast Cells
Manetz, T. S., González‐Espinosa, C., Arudchandran, R., Xirasagar, S., Tybulewicz, V. L. J., & Rivera, J. (2001) · Molecular and Cellular Biology · doi:10.1128/mcb.21.11.3763-3774.2001 · Cited by 155
RasGRP1 and RasGRP3 Regulate B Cell Proliferation by Facilitating B Cell Receptor-Ras Signaling
Coughlin, J. J., Stang, S. L., Dower, N. A., & Stone, J. C. (2005) · The Journal of Immunology · doi:10.4049/jimmunol.175.11.7179 · Cited by 154
Vav3 Modulates B Cell Receptor Responses by Regulating Phosphoinositide 3-Kinase Activation
Inabe, K., Ishiai, M., Scharenberg, A. M., Freshney, N. W., Downward, J., & Kurosaki, T. (2002) · The Journal of Experimental Medicine · doi:10.1084/jem.20011571 · Cited by 146
Self-citationWeng, W., Jarvis, L. J., & LeBien, T. W. (1994) · Journal of Biological Chemistry · doi:10.1016/s0021-9258(18)31664-8 · Cited by 145
BASH, a novel signaling molecule preferentially expressed in B cells of the bursa of Fabricius.
Goitsuka, R., Fujimura, Y., Mamada, H., Umeda, A., Morimura, T., Uetsuka, K., Doi, K., Tsuji, S., & Kitamura, D. (1998) · PubMed · Cited by 145
Watanabe, D., Hashimoto, S., Ishiai, M., Matsushita, M., Baba, Y., Kishimoto, T., Kurosaki, T., & Tsukada, S. (2001) · Journal of Biological Chemistry · doi:10.1074/jbc.m103675200 · Cited by 136
Self-citationPhospholipase C-γ: diverse roles in receptor-mediated calcium signaling
Patterson, R. L., van Rossum, D. B., Nikolaidis, N., Gill, D. L., & Snyder, S. H. (2005) · Trends in Biochemical Sciences · doi:10.1016/j.tibs.2005.10.005 · Cited by 130
Mechanism of B-Cell Receptor-Induced Phosphorylation and Activation of Phospholipase C-γ2
Kim, Y. J., Sekiya, F., Poulin, B., Bae, Y. S., & Rhee, S. G. (2004) · Molecular and Cellular Biology · doi:10.1128/mcb.24.22.9986-9999.2004 · Cited by 126
BLNK: molecular scaffolding through ‘cis’‐mediated organization of signaling proteins
Chiu, C. W., Dalton, M., Ishiai, M., Kurosaki, T., & Chan, A. C. (2002) · The EMBO Journal · doi:10.1093/emboj/cdf658 · Cited by 124
Self-citationRecruitment and activation of PLCγ1 in T cells: a new insight into old domains
Braiman, A., Barda‐Saad, M., Sommers, C. L., & Samelson, L. E. (2006) · The EMBO Journal · doi:10.1038/sj.emboj.7600978 · Cited by 116
Goitsuka, R., Fujimura, Y., Mamada, H., Umeda, A., Morimura, T., Uetsuka, K., Doi, K., Tsuji, S., & Kitamura, D. (1998) · The Journal of Immunology · doi:10.4049/jimmunol.161.11.5804 · Cited by 115
Oh-hora, M., Johmura, S., Hashimoto, A., Hikida, M., & Kurosaki, T. (2003) · The Journal of Experimental Medicine · doi:10.1084/jem.20031547 · Cited by 113
Self-citationRole of Tyrosine Phosphorylation of HS1 in B Cell Antigen Receptor-mediated Apoptosis
Yamanashi, Y., Fukuda, T., Nishizumi, H., Inazu, T., Higashi, K., Kitamura, D., Ishida, T., Yamamura, H., Watanabe, T., & Yamamoto, T. S. (1997) · The Journal of Experimental Medicine · doi:10.1084/jem.185.7.1387 · Cited by 112
The role of membrane-associated adaptors in T cell receptor signalling
Zhang, W., & Samelson, L. E. (2000) · Seminars in Immunology · doi:10.1006/smim.2000.0205 · Cited by 110
Regulation of B cell fates by BCR signaling components
Kurosaki, T. (2002) · Current Opinion in Immunology · doi:10.1016/s0952-7915(02)00344-8 · Cited by 106
Self-citationHumphries, L. A., Dangelmaier, C., Sommer, K., Kipp, K. R., Kato, R. M., Griffith, N., Bakman, I., Turk, C. W., Daniel, J. L., & Rawlings, D. J. (2004) · Journal of Biological Chemistry · doi:10.1074/jbc.m311985200 · Cited by 104
Wu, J., Qin, D., Burton, G. F., Szakal, A. K., & Tew, J. G. (1996) · The Journal of Immunology · doi:10.4049/jimmunol.157.8.3404 · Cited by 97
Foucault, I., Bras, S. L., Charvet, C., Moon, C., Altman, A., & Deckert, M. (2004) · Blood · doi:10.1182/blood-2003-08-2965 · Cited by 88
Regulation of In Vitro and In Vivo Immune Functions by the Cytosolic Adaptor Protein SKAP-HOM
Togni, M., Swanson, K. D., Reimann, S., Kliche, S., Pearce, A. C., Simeoni, L., Reinhold, D., Wienands, J., Neel, B. G., Schraven, B. L., et al. (2005) · Molecular and Cellular Biology · doi:10.1128/mcb.25.18.8052-8063.2005 · Cited by 85
3BP2 Deficiency Impairs the Response of B Cells, but Not T Cells, to Antigen Receptor Ligation
de la Fuente, M. Á., Kumar, L., Lu, B., & Geha, R. S. (2006) · Molecular and Cellular Biology · doi:10.1128/mcb.00087-06 · Cited by 46
Hao, J.-J., Carey, G. B., & Zhan, X. (2004) · Journal of Biological Chemistry · doi:10.1074/jbc.m313564200 · Cited by 42
Vigorito, E., Bardi, G., Glassford, J., Lam, E. W. ‐., Clayton, E., & Turner, M. (2004) · The Journal of Immunology · doi:10.4049/jimmunol.173.5.3209 · Cited by 40
Vav and the B cell signalosome
DeFranco, A. L. (2001) · Nature Immunology · doi:10.1038/88669 · Cited by 40
Brezski, R. J., & Monroe, J. G. (2007) · The Journal of Immunology · doi:10.4049/jimmunol.179.7.4464 · Cited by 34
Brooks, S. R., Kirkham, P. M., Freeberg, L. E., & Carter, R. H. (2004) · The Journal of Immunology · doi:10.4049/jimmunol.172.12.7556 · Cited by 30
Immunogenicity of a contiguous T-B synthetic epitope of the A/PR/8/34 influenza virus
Brumeanu, T., Casares, S. A., Bot, A. I., Bot, S., & Bona, C. A. (1997) · Journal of Virology · doi:10.1128/jvi.71.7.5473-5480.1997 · Cited by 29
Genetic analysis of B cell signaling
Shinohara, H., & Kurosaki, T. (2006) · Sub-cellular biochemistry/Subcellular biochemistry · doi:10.1007/978-1-4020-4896-8_10 · Cited by 23
Self-citationTreanor, B., & Batista, F. D. (2007) · Current Opinion in Immunology · doi:10.1016/j.coi.2007.05.009 · Cited by 19
Self-citation
Research works printed but not linked: 1
- 2006, Nat. Immunol., 7, 625
Cited by
Sorted by citations
Yokosuka, T., Takamatsu, M., Kobayashi-Imanishi, W., Hashimoto-Tane, A., Azuma, M., & Saito, T. (2012) · Journal of Experimental Medicine · doi:10.1084/jem.20112741 · Cited by 1,161
The who, how and where of antigen presentation to B cells
Batista, F. D., & Harwood, N. E. (2008) · Nature reviews. Immunology · doi:10.1038/nri2454 · Cited by 832
Self-citationRole of Bruton’s tyrosine kinase in B cells and malignancies
Pal Singh, S., Dammeijer, F., & Hendriks, R. W. (2018) · Molecular Cancer · doi:10.1186/s12943-018-0779-z · Cited by 726
Targeting Bruton's tyrosine kinase in B cell malignancies
Hendriks, R. W., Yuvaraj, S., & Kil, L. P. (2014) · Nature reviews. Cancer · doi:10.1038/nrc3702 · Cited by 580
Early Events in B Cell Activation
Harwood, N. E., & Batista, F. D. (2010) · Annual Review of Immunology · doi:10.1146/annurev-immunol-030409-101216 · Cited by 429
Self-citation
Metadata
- Authors
- Weber, M., Treanor, B., Depoil, D., Shinohara, H., Harwood, N. E., Hikida, M., Kurosaki, T., & Batista, F. D.
- Affiliations
- Cancer Research UK (GB)
- RIKEN (JP)
- ORCID
- Venue
- The Journal of Experimental Medicine
- Publisher
- Rockefeller University Press
- Published
- 2008-03-24
- Volume
- 205
- Issue
- 4
- Pages
- 853-868
- ISSN
- 0022-1007 (ISSN-L)
- 1540-9538
- PMC
- PMC2292224
- OpenAlex
- W2135715200
- Cited by
- 170
- References
- 84
- Citations by year
- 2026: 2 · 2025: 4 · 2024: 7 · 2023: 4 · 2022: 5 · 2021: 9 · 2020: 4 · 2019: 8 · 2018: 11 · 2017: 10 · 2016: 9 · 2015: 12 · 2014: 13 · 2013: 13 · 2012: 10
- FWCI
- 6.84
- Type
- journal article
- Language
- en
- Open access
- green
- europepmc.org
- Licence
- cc-by-nc-sa
- Locations
- The Journal of Experimental Medicine (publishedVersion)
- Europe PMC (PubMed Central) (publishedVersion, cc-by-nc-sa)
- PubMed Central (publishedVersion, cc-by-nc-sa)
- PubMed (publishedVersion)
- Funders
- Cancer Research UK
- Topics
- Life Sciences › Immunology and Microbiology › Immunology › T-cell and B-cell Immunology
- Life Sciences › Biochemistry, Genetics and Molecular Biology › Molecular Biology › Protein Kinase Regulation and GTPase Signaling
- Life Sciences › Biochemistry, Genetics and Molecular Biology › Cancer Research › NF-κB Signaling Pathways
- Keywords
- PLCγ2, Vav, B cell receptor signaling, membrane-bound antigen, Bruton's tyrosine kinase, Lyn kinase, Syk, B cell activation, signal propagation
- MeSH terms
- Syk Kinase, Animals, Antigens, B-Lymphocytes, Cell Membrane, Cell Movement, Chickens, Models, Biological, Protein Binding, Protein-Tyrosine Kinases, Signal Transduction, src-Family Kinases, Intracellular Signaling Peptides and Proteins, Mice, Rats, Proto-Oncogene Proteins c-vav, Phospholipase C gamma, Inositol 1,4,5-Trisphosphate Receptors
About these checks
Registry, retraction, Cites and statistics results are computed, not judged, with one exception: a printed reference that no index lists is read once by a model before it counts as a citation error. Claims are extracted by a model and kept only when their quote appears verbatim in the text; each cited source is then checked, with a model’s help, for whether it says what the claim relies on. Those verdicts can be wrong — read the claim’s quote and the cited source before relying on one.
Statistics and arithmetic are recomputed, not judged.
Confidence bands are shown only for fields calibrated on our annotated test set. None is calibrated yet, so no band is shown.
What counts as a claim ›How we measure confidence ›How we check this ›
Are you an author, or do you see a problem with this page? Request a review
