Cited by 377Influenza Virus Research StudiesInflammation biomarkers and pathwaysCell death mechanisms and regulation

The DOI matches its Crossref record; 44 of the 44 references it cites were found in a registry or an index.

Lung epithelial apoptosis in influenza virus pneumonia: the role of macrophage-expressed TNF-related apoptosis-inducing ligand

Open access
Herold, Susanne, Steinmueller, Mirko, von Wulffen, Werner, Cakarova, Lidija, Pinto, Ruth, Pleschka, Stephan, Mack, Matthias, Kuziel, William A., Corazza, Nadia, Brunner, Thomas, Seeger, Werner, Lohmeyer, Juergen·2008·The Journal of Experimental Medicine

Abstract

Mononuclear phagocytes have been attributed a crucial role in the host defense toward influenza virus (IV), but their contribution to influenza-induced lung failure is incompletely understood. We demonstrate for the first time that lung-recruited "exudate" macrophages significantly contribute to alveolar epithelial cell (AEC) apoptosis by the release of tumor necrosis factor-related apoptosis-inducing ligand (TRAIL) in a murine model of influenza-induced pneumonia. Using CC-chemokine receptor 2-deficient (CCR2(-/-)) mice characterized by defective inflammatory macrophage recruitment, and blocking anti-CCR2 antibodies, we show that exudate macrophage accumulation in the lungs of influenza-infected mice is associated with pronounced AEC apoptosis and increased lung leakage and mortality. Among several proapoptotic mediators analyzed, TRAIL messenger RNA was found to be markedly up-regulated in alveolar exudate macrophages as compared with peripheral blood monocytes. Moreover, among the different alveolar-recruited leukocyte subsets, TRAIL protein was predominantly expressed on macrophages. Finally, abrogation of TRAIL signaling in exudate macrophages resulted in significantly reduced AEC apoptosis, attenuated lung leakage, and increased survival upon IV infection. Collectively, these findings demonstrate a key role for exudate macrophages in the induction of alveolar leakage and mortality in IV pneumonia. Epithelial cell apoptosis induced by TRAIL-expressing macrophages is identified as a major underlying mechanism.

Overview

The claims and statistics of this paper haven’t been checked yet.

Run the check — free, no account needed. It reads the open-access text and checks the sources it cites.

A few free checks a day · papers already verified open instantly · results are public

Integrity signals

Registry

Crossref · 10.1084/jem.20080201

Cites

44 of 44 references verified0 citation errors · 0 not checkable

Statistics

Figures

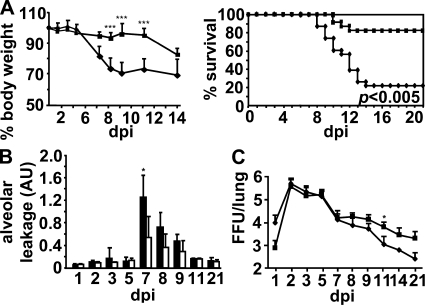
Figure 1. CCR2 deficiency is associated with increased survival, reduced body weight loss, attenuated alveolar leakage, and slightly reduced viral clearance during the time course of PR/8 infection. (A) Body weight and survival of PR/8-infected sex- and age-matched WT (♦, n = 23) or CCR2−/− (▪, n = 23) were determined until days 14 and 21 pi, respectively in four independent experiments. Error bars show SD. (B) Alveolar leakage was analyzed in PR/8-infected WT (filled bars) or CCR2−/− (empty bars) mice. The ratio of BALF and blood FITC fluorescence is expressed in arbitrary units (AU). (C) Lung virus titers of WT (♦) and CCR2−/− (▪) mice in the time course of PR/8 infection. Virus titers were determined from lung homogenate supernatants and values are given as log10 foci-forming units (FFU)/lung. Data in B and C are means ± SD of three to five mice per group from at least three independent experiments. *, P < 0.05; ***, P < 0.005.
Figure 1. CCR2 deficiency is associated with increased survival, reduced body weight loss, attenuated alveolar leakage, and slightly reduced viral clearance during the time course of PR/8 infection. (A) Body weight and survival of PR/8-infected sex- and age-matched WT (♦, n = 23) or CCR2−/− (▪, n = 23) were determined until days 14 and 21 pi, respectively in four independent experiments. Error bars show SD. (B) Alveolar leakage was analyzed in PR/8-infected WT (filled bars) or CCR2−/− (empty bars) mice. The ratio of BALF and blood FITC fluorescence is expressed in arbitrary units (AU). (C) Lung virus titers of WT (♦) and CCR2−/− (▪) mice in the time course of PR/8 infection. Virus titers were determined from lung homogenate supernatants and values are given as log10 foci-forming units (FFU)/lung. Data in B and C are means ± SD of three to five mice per group from at least three independent experiments. *, P < 0.05; ***, P < 0.005.CC BY-NC-SA · PubMed Central
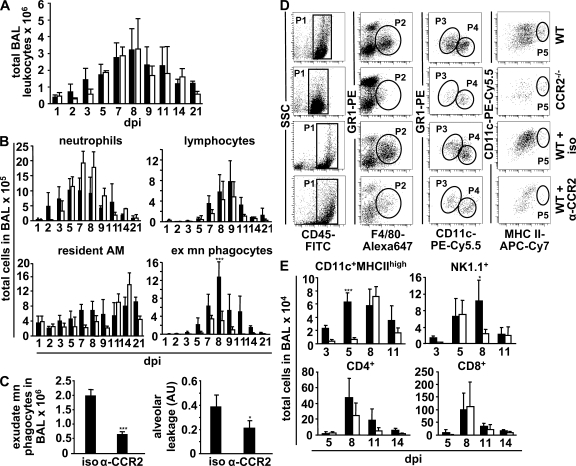
Figure 2. Alveolar macrophage recruitment in PR/8-infected mice is CCR2 dependent. (A and B) PR/8-infected WT (filled bars) or CCR2−/− (empty bars) mice were subjected to BAL, followed by quantification of total leukocyte BALF numbers (A) and BAL leukocyte subpopulations (B) from Pappenheim-stained cytocentrifuge preparations. (C) Quantification of exudate mononuclear phagocytes calculated from differential counts of BAL leukocytes from infected WT mice treated with isotype IgG or anti-CCR2 mAb (day 8 pi, left). Alveolar leakage of isotype- or anti-CCR2–treated PR/8-infected mice (day 7 pi, right). (D) FACS analysis of alveolar mononuclear phagocyte subpopulations in BALF from infected WT versus CCR2−/− mice or from WT mice treated with isotype IgG or anti-CCR2 mAb was performed by three-hierarchy gating on day 8 pi. CD45+ cells (population 1 [P1]) were gated according to their GR1 and F4/80 expression. GR1intF4/80+ cells represent alveolar mononuclear phagocytes (population 2 [P2]). Subgate analysis of population 2 revealed a CD11cint (population 3 [P3], exudate macrophages) and a CD11chigh (population 4 [P4], resident AM) subpopulation as well as a CD11chighMHCIIhigh subpopulation (population 5 [P5]) representing alveolar DCs. (E) Flow cytometric quantification of CD11chighMHCIIhigh DCs and lymphocyte subpopulations from BAL leukocytes of PR/8-infected WT (filled bars) versus CCR2−/− (empty bars) mice using the gating characteristics described in D for DCs. For analysis of lymphocyte subpopulations, CD45+ cells were subgated on NK cells (SSClowNK1.1+), CD4 T cells (SSClowCD4+), and CD8 T cells (SSClowCD8+). Data in E are given as total cells in BAL calculated from the respective percentage of CD45+ cells. All bar graphs represent the means ± SD from five experiments. *, P < 0.05; ***, P < 0.005. AM, alveolar macrophages; ex, exudate; mn, mononuclear; iso, isotype IgG.
Figure 2. Alveolar macrophage recruitment in PR/8-infected mice is CCR2 dependent. (A and B) PR/8-infected WT (filled bars) or CCR2−/− (empty bars) mice were subjected to BAL, followed by quantification of total leukocyte BALF numbers (A) and BAL leukocyte subpopulations (B) from Pappenheim-stained cytocentrifuge preparations. (C) Quantification of exudate mononuclear phagocytes calculated from differential counts of BAL leukocytes from infected WT mice treated with isotype IgG or anti-CCR2 mAb (day 8 pi, left). Alveolar leakage of isotype- or anti-CCR2–treated PR/8-infected mice (day 7 pi, right). (D) FACS analysis of alveolar mononuclear phagocyte subpopulations in BALF from infected WT versus CCR2−/− mice or from WT mice treated with isotype IgG or anti-CCR2 mAb was performed by three-hierarchy gating on day 8 pi. CD45+ cells (population 1 [P1]) were gated according to their GR1 and F4/80 expression. GR1intF4/80+ cells represent alveolar mononuclear phagocytes (population 2 [P2]). Subgate analysis of population 2 revealed a CD11cint (population 3 [P3], exudate macrophages) and a CD11chigh (population 4 [P4], resident AM) subpopulation as well as a CD11chighMHCIIhigh subpopulation (population 5 [P5]) representing alveolar DCs. (E) Flow cytometric quantification of CD11chighMHCIIhigh DCs and lymphocyte subpopulations from BAL leukocytes of PR/8-infected WT (filled bars) versus CCR2−/− (empty bars) mice using the gating characteristics described in D for DCs. For analysis of lymphocyte subpopulations, CD45+ cells were subgated on NK cells (SSClowNK1.1+), CD4 T cells (SSClowCD4+), and CD8 T cells (SSClowCD8+). Data in E are given as total cells in BAL calculated from the respective percentage of CD45+ cells. All bar graphs represent the means ± SD from five experiments. *, P < 0.05; ***, P < 0.005. AM, alveolar macrophages; ex, exudate; mn, mononuclear; iso, isotype IgG.CC BY-NC-SA · PubMed Central
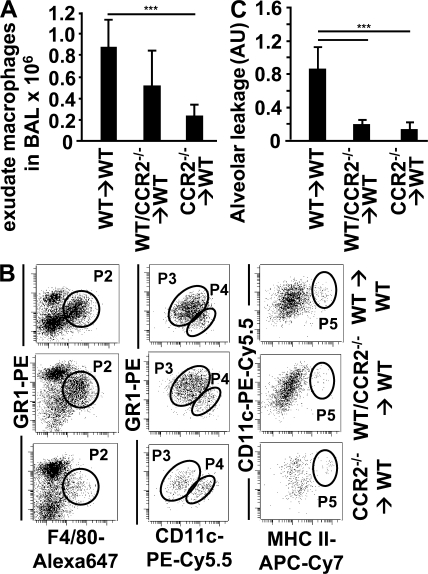
Figure 3. Alveolar barrier dysfunction is associated with CCR2 expression on circulating leukocytes during PR/8 infection. (A) Three different groups of PR/8-infected BM chimeric mice (WT recipient mice with transplantation of 100% WT BM cells; WT recipient mice with transplantation of mixed 50% WT/ 50% CCR2−/− BM cells; and WT recipient mice with transplantation of 100% CCR2−/− BM cells) were subjected to BAL at day 8 pi. Exudate macrophage numbers were calculated from BALF leukocyte numbers and differential counts of Pappenheim-stained cytocentrifuge preparations. (B) FACS analysis of BALF cells from PR/8-infected chimeric mice of each transplantation group was performed as described in Fig. 2 D, and representative dot plots from three independent experiments are shown. Note that population 3 (P3; exudate macrophages), population 4 (P4; resident alveolar macrophages), and population 5 (P5; alveolar DCs) are subgates of population 2 [P2]. (C) Alveolar leakage from PR/8-infected chimeric mice at day 7 pi. All bar graphs represent the means ± SD of four to eight mice per group from three independent experiments. ***, P < 0.005.
Figure 3. Alveolar barrier dysfunction is associated with CCR2 expression on circulating leukocytes during PR/8 infection. (A) Three different groups of PR/8-infected BM chimeric mice (WT recipient mice with transplantation of 100% WT BM cells; WT recipient mice with transplantation of mixed 50% WT/ 50% CCR2−/− BM cells; and WT recipient mice with transplantation of 100% CCR2−/− BM cells) were subjected to BAL at day 8 pi. Exudate macrophage numbers were calculated from BALF leukocyte numbers and differential counts of Pappenheim-stained cytocentrifuge preparations. (B) FACS analysis of BALF cells from PR/8-infected chimeric mice of each transplantation group was performed as described in Fig. 2 D, and representative dot plots from three independent experiments are shown. Note that population 3 (P3; exudate macrophages), population 4 (P4; resident alveolar macrophages), and population 5 (P5; alveolar DCs) are subgates of population 2 [P2]. (C) Alveolar leakage from PR/8-infected chimeric mice at day 7 pi. All bar graphs represent the means ± SD of four to eight mice per group from three independent experiments. ***, P < 0.005.CC BY-NC-SA · PubMed Central
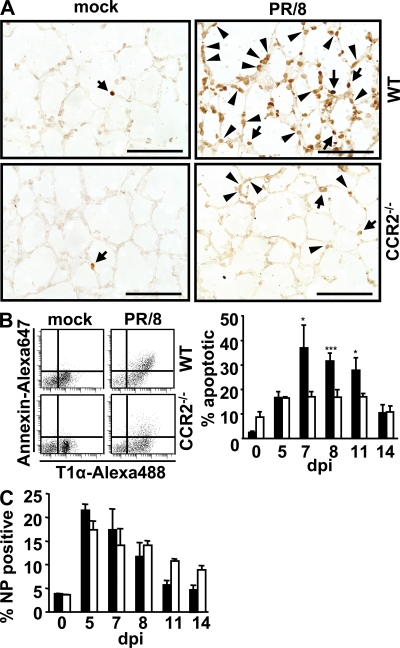
Figure 4. AEC apoptosis is reduced in PR/8-infected CCR2−/− mice compared with WT mice. (A) WT or CCR2−/− mice were mock or PR/8 infected and TUNEL assay was performed on cryosections from lavaged lungs at day 7 pi. Nuclei of apoptotic cells appear in brown. Arrows, apoptotic intraalveolar leukocytes; arrowheads, apoptotic AEC. Bars, 100 μm. (B) Flow cytometric quantification of apoptotic AEC. Lungs from mock- or PR/8-infected WT or CCR2−/− mice were digested on day 7 pi and analyzed for annexin V binding. Representative dot plots show expression of the AEC type I marker T1α and annexin V staining of viable (propidium iodide negative) CD45− cells. Apoptotic cells are mainly AEC type I (left). Quantification of FACS data as obtained in B from PR/8-infected mice (right). The bar graph represents the annexin V+ proportion of CD45− T1α+ cells. (C) Quantification of FACS analysis of the NP+ proportion of CD45− T1α+ cells from lung homogenates in the time course after PR/8 infection. Values are means ± SD of three to four mice per group from three independent experiments. *, P < 0.05; ***, P < 0.005. NP, IV nucleoprotein; filled bars, WT; empty bars, CCR2−/−.
Figure 4. AEC apoptosis is reduced in PR/8-infected CCR2−/− mice compared with WT mice. (A) WT or CCR2−/− mice were mock or PR/8 infected and TUNEL assay was performed on cryosections from lavaged lungs at day 7 pi. Nuclei of apoptotic cells appear in brown. Arrows, apoptotic intraalveolar leukocytes; arrowheads, apoptotic AEC. Bars, 100 μm. (B) Flow cytometric quantification of apoptotic AEC. Lungs from mock- or PR/8-infected WT or CCR2−/− mice were digested on day 7 pi and analyzed for annexin V binding. Representative dot plots show expression of the AEC type I marker T1α and annexin V staining of viable (propidium iodide negative) CD45− cells. Apoptotic cells are mainly AEC type I (left). Quantification of FACS data as obtained in B from PR/8-infected mice (right). The bar graph represents the annexin V+ proportion of CD45− T1α+ cells. (C) Quantification of FACS analysis of the NP+ proportion of CD45− T1α+ cells from lung homogenates in the time course after PR/8 infection. Values are means ± SD of three to four mice per group from three independent experiments. *, P < 0.05; ***, P < 0.005. NP, IV nucleoprotein; filled bars, WT; empty bars, CCR2−/−.CC BY-NC-SA · PubMed Central
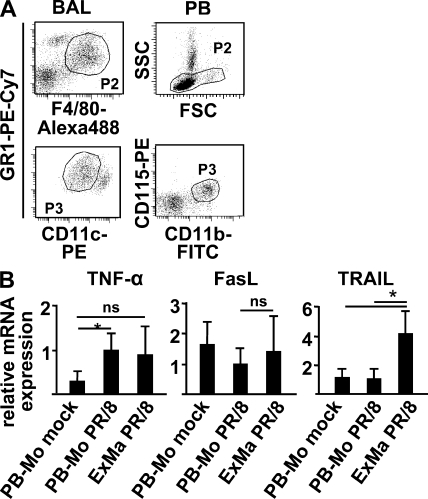
Figure 5. Relative mRNA expression of the proapoptotic factors TNF-α, TRAIL, and FasL in peripheral blood (PB) monocytes and alveolar exudate macrophages. (A) BALF exudate alveolar macrophages from PR/8-infected WT mice were high-purity flow sorted on day 8 pi according to their surface expression of F4/80, GR1, and CD11c (F4/80+GR1intCD11cint [population 3 (P3)], left). PB monocytes from the same (PR/8 infected) animals or from mock-infected mice were flow sorted according to their scatter characteristics (SSClow) and CD11b and CD115 expression (CD11b+CD115+ [population 3 (P3)], right). SSC, side scatter; FSC, forward scatter. (B) Relative mRNA expression of TNF-α, TRAIL, and FasL from sorted PB monocytes of mock-infected (PB-Mo mock) or PR/8-infected (PB-Mo PR/8) mice or from exudate macrophages of infected mice (ExMa PR/8). Values are the means ± SD from three independent experiments, including pooled BALF or blood cells, from n = 8 mice each. *, P < 0.05.
Figure 5. Relative mRNA expression of the proapoptotic factors TNF-α, TRAIL, and FasL in peripheral blood (PB) monocytes and alveolar exudate macrophages. (A) BALF exudate alveolar macrophages from PR/8-infected WT mice were high-purity flow sorted on day 8 pi according to their surface expression of F4/80, GR1, and CD11c (F4/80+GR1intCD11cint [population 3 (P3)], left). PB monocytes from the same (PR/8 infected) animals or from mock-infected mice were flow sorted according to their scatter characteristics (SSClow) and CD11b and CD115 expression (CD11b+CD115+ [population 3 (P3)], right). SSC, side scatter; FSC, forward scatter. (B) Relative mRNA expression of TNF-α, TRAIL, and FasL from sorted PB monocytes of mock-infected (PB-Mo mock) or PR/8-infected (PB-Mo PR/8) mice or from exudate macrophages of infected mice (ExMa PR/8). Values are the means ± SD from three independent experiments, including pooled BALF or blood cells, from n = 8 mice each. *, P < 0.05.CC BY-NC-SA · PubMed Central
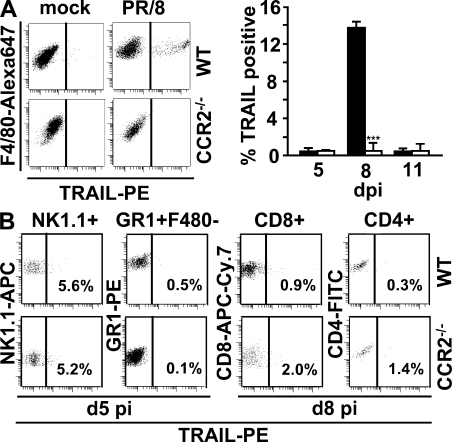
Figure 6. TRAIL is expressed on the cell surface of alveolar exudate macrophages. (A) WT or CCR2−/− mice were mock or PR/8 infected and BAL cells were stained with GR1-FITC, F4/80–Alexa Fluor 647, and TRAIL PE or isotype PE mAbs, respectively. GR1intF4/80+ cells were gated and analyzed for TRAIL surface expression (left). Quantitative analysis of the proportion of TRAIL+ from F4/80+ BALF cells gained from PR/8-infected WT (filled bars) or CCR2−/− mice (empty bars) on days 5, 8, and 11 pi (right). (B) FACS analysis of TRAIL expression on BALF NK cells (SSClowNK1.1+), neutrophils (GR1highF4/80+), CD8 T cells (SSClowCD8+), and CD4 T cells (SSClowCD4+) of PR/8-infected WT (top) or CCR2−/− (bottom) mice gained at the indicated time points. Values are the means ± SD of two to four mice per group from at least two independent experiments. ***, P < 0.005.
Figure 6. TRAIL is expressed on the cell surface of alveolar exudate macrophages. (A) WT or CCR2−/− mice were mock or PR/8 infected and BAL cells were stained with GR1-FITC, F4/80–Alexa Fluor 647, and TRAIL PE or isotype PE mAbs, respectively. GR1intF4/80+ cells were gated and analyzed for TRAIL surface expression (left). Quantitative analysis of the proportion of TRAIL+ from F4/80+ BALF cells gained from PR/8-infected WT (filled bars) or CCR2−/− mice (empty bars) on days 5, 8, and 11 pi (right). (B) FACS analysis of TRAIL expression on BALF NK cells (SSClowNK1.1+), neutrophils (GR1highF4/80+), CD8 T cells (SSClowCD8+), and CD4 T cells (SSClowCD4+) of PR/8-infected WT (top) or CCR2−/− (bottom) mice gained at the indicated time points. Values are the means ± SD of two to four mice per group from at least two independent experiments. ***, P < 0.005.CC BY-NC-SA · PubMed Central
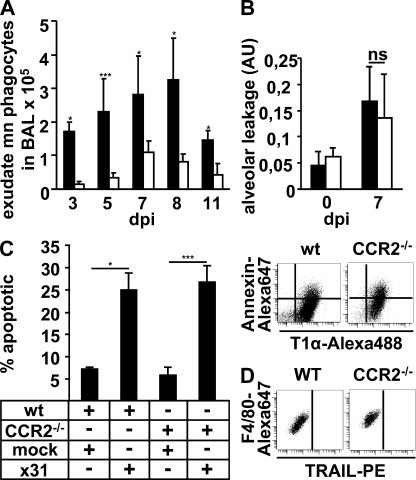
Figure 7. x31-infected WT and CCR2−/− mice lack TRAIL expression on exudate macrophages and reveal equal levels of AEC apoptosis and alveolar barrier function. (A) Quantification of BAL exudate mononuclear phagocytes from Pappenheim-stained cytocentrifuge preparations in x31-infected WT (filled bars) or CCR2−/− (empty bars) mice. (B) Alveolar leakage of uninfected (day 0) or x31-infected (day 7) WT (filled bars) or CCR2−/− (empty bars) mice. (C, right) FACS analysis of apoptotic AEC type I from mock- or x31-infected WT or CCR2−/− mice on day 7 pi. (C, left) Quantification of FACS data. Bar graphs show the annexin V+ proportion of CD45− T1α+ cells. (D) GR1intF4/80+ BAL cells from x31-infected WT or CCR2−/− mice were gated and analyzed for TRAIL surface expression. *, P < 0.05; ***, P < 0.005. All bar graphs represent the means ± SD from three independent experiments.
Figure 7. x31-infected WT and CCR2−/− mice lack TRAIL expression on exudate macrophages and reveal equal levels of AEC apoptosis and alveolar barrier function. (A) Quantification of BAL exudate mononuclear phagocytes from Pappenheim-stained cytocentrifuge preparations in x31-infected WT (filled bars) or CCR2−/− (empty bars) mice. (B) Alveolar leakage of uninfected (day 0) or x31-infected (day 7) WT (filled bars) or CCR2−/− (empty bars) mice. (C, right) FACS analysis of apoptotic AEC type I from mock- or x31-infected WT or CCR2−/− mice on day 7 pi. (C, left) Quantification of FACS data. Bar graphs show the annexin V+ proportion of CD45− T1α+ cells. (D) GR1intF4/80+ BAL cells from x31-infected WT or CCR2−/− mice were gated and analyzed for TRAIL surface expression. *, P < 0.05; ***, P < 0.005. All bar graphs represent the means ± SD from three independent experiments.CC BY-NC-SA · PubMed Central
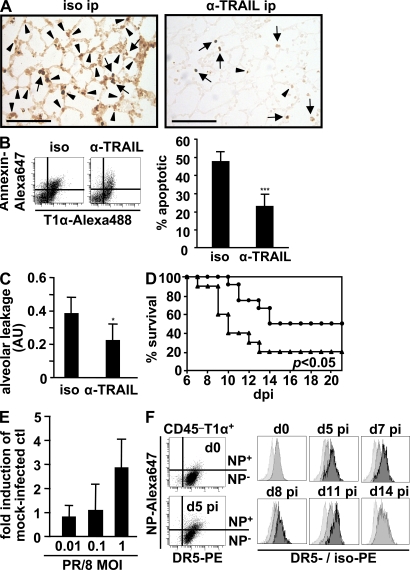
Figure 8. Anti-TRAIL treatment attenuates AEC apoptosis as well as alveolar leakage and enhances survival upon PR/8 infection. (A) PR/8-infected WT mice were treated with IgG isotype or anti-TRAIL mAb on days 3 and 5 pi and TUNEL assay was performed on lung cryosections at day 7 pi (arrows, apoptotic intraalveolar leukocytes; arrowheads, apoptotic AECs). Bars, 100 μm. (B) FACS analysis (representative dot plots, left) and quantification (four to six mice per group; right) of apoptotic AEC I of PR/8-infected, IgG isotype–treated, or anti-TRAIL–treated mice (day 7 pi). Error bars show SD. (C) Alveolar leakage of PR/8-infected WT mice at day 7 pi that were treated with IgG isotype or anti-TRAIL mAb at days 3 and 5 pi. (D) Survival of PR/8-infected WT mice treated with isotype IgG (▴, n = 10) or anti-TRAIL mAb (•, n = 12) at days 3, 5, 7, and 9 pi in three independent experiments. (E) TRAIL receptor DR5 is expressed on cultured AEC and up-regulated upon PR/8 infection dose dependently in vitro. Bar graphs depict DR5 mRNA expression as fold induction of mock-infected AEC. (F) DR5 is expressed on AEC and up-regulated upon PR/8 infection in vivo. Left, FACS analysis of DR5 and NP expression of gated AEC type I (CD45− T1α+) from digested lungs of uninfected (day 0, top) or PR/8-infected (day 5 pi) WT mice. Right, histograms depict DR5 expression of NP-negative (medium gray histograms) and NP-positive CD45− T1α+ AEC I (dark gray histograms) from noninfected (day 0) and PR/8-infected WT mice in the time course of infection. Isotype PE–stained cells are shown in light gray histograms. An NP-positive population is missing at days 0 and 14 pi. Bar graphs in C and E represent the means ± SD of three to five independent experiments. *, P < 0.05; ***, P < 0.005; iso, isotype IgG; NP, IV nucleoprotein.
Figure 8. Anti-TRAIL treatment attenuates AEC apoptosis as well as alveolar leakage and enhances survival upon PR/8 infection. (A) PR/8-infected WT mice were treated with IgG isotype or anti-TRAIL mAb on days 3 and 5 pi and TUNEL assay was performed on lung cryosections at day 7 pi (arrows, apoptotic intraalveolar leukocytes; arrowheads, apoptotic AECs). Bars, 100 μm. (B) FACS analysis (representative dot plots, left) and quantification (four to six mice per group; right) of apoptotic AEC I of PR/8-infected, IgG isotype–treated, or anti-TRAIL–treated mice (day 7 pi). Error bars show SD. (C) Alveolar leakage of PR/8-infected WT mice at day 7 pi that were treated with IgG isotype or anti-TRAIL mAb at days 3 and 5 pi. (D) Survival of PR/8-infected WT mice treated with isotype IgG (▴, n = 10) or anti-TRAIL mAb (•, n = 12) at days 3, 5, 7, and 9 pi in three independent experiments. (E) TRAIL receptor DR5 is expressed on cultured AEC and up-regulated upon PR/8 infection dose dependently in vitro. Bar graphs depict DR5 mRNA expression as fold induction of mock-infected AEC. (F) DR5 is expressed on AEC and up-regulated upon PR/8 infection in vivo. Left, FACS analysis of DR5 and NP expression of gated AEC type I (CD45− T1α+) from digested lungs of uninfected (day 0, top) or PR/8-infected (day 5 pi) WT mice. Right, histograms depict DR5 expression of NP-negative (medium gray histograms) and NP-positive CD45− T1α+ AEC I (dark gray histograms) from noninfected (day 0) and PR/8-infected WT mice in the time course of infection. Isotype PE–stained cells are shown in light gray histograms. An NP-positive population is missing at days 0 and 14 pi. Bar graphs in C and E represent the means ± SD of three to five independent experiments. *, P < 0.05; ***, P < 0.005; iso, isotype IgG; NP, IV nucleoprotein.CC BY-NC-SA · PubMed Central
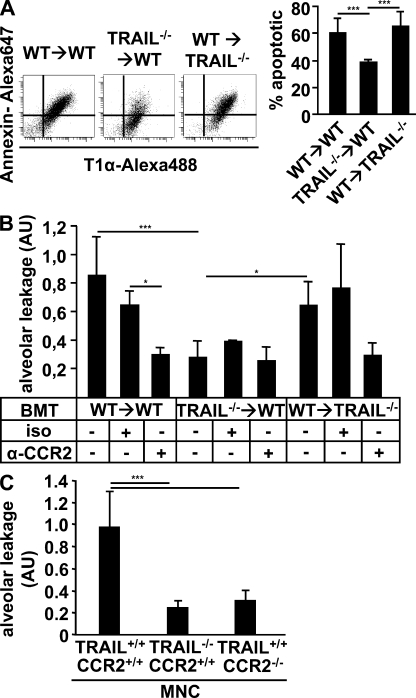
Figure 9. AEC apoptosis and lung leakage are reduced in PR/8-infected mice recruiting TRAIL-deficient exudate macrophages to their lungs. (A) Digested lungs of three different groups of PR/8-infected BM chimeric mice (WT recipient mice with transplantation of WT BM cells; WT recipient mice with transplantation of TRAIL−/− BM cells; and TRAIL−/− recipient mice with transplantation of WT BM cells) were analyzed for AEC type I apoptosis (left, representative FACS plots; right, quantitative analysis of five independent experiments). Error bars show SD. (B) Alveolar leakage of different BM chimeric mice that were either left untreated or injected with isotype IgG or anti-CCR2 mAb, respectively, was analyzed at day 7 pi. (C) CCR2−/− mice were adoptively transferred with CCR2+/+/TRAIL+/+, CCR2+/+/TRAIL−/−, or CCR2−/−/TRAIL+/+ MNC, and alveolar leakage was analyzed at day 7 after PR/8 infection. BMT, BM transplantation; iso, isotype IgG; MNC, mononuclear cells; ***, P < 0.005; *, P < 0.05. Bar graphs in B and C represent the means ± SD of three to five mice per group from three independent experiments.
Figure 9. AEC apoptosis and lung leakage are reduced in PR/8-infected mice recruiting TRAIL-deficient exudate macrophages to their lungs. (A) Digested lungs of three different groups of PR/8-infected BM chimeric mice (WT recipient mice with transplantation of WT BM cells; WT recipient mice with transplantation of TRAIL−/− BM cells; and TRAIL−/− recipient mice with transplantation of WT BM cells) were analyzed for AEC type I apoptosis (left, representative FACS plots; right, quantitative analysis of five independent experiments). Error bars show SD. (B) Alveolar leakage of different BM chimeric mice that were either left untreated or injected with isotype IgG or anti-CCR2 mAb, respectively, was analyzed at day 7 pi. (C) CCR2−/− mice were adoptively transferred with CCR2+/+/TRAIL+/+, CCR2+/+/TRAIL−/−, or CCR2−/−/TRAIL+/+ MNC, and alveolar leakage was analyzed at day 7 after PR/8 infection. BMT, BM transplantation; iso, isotype IgG; MNC, mononuclear cells; ***, P < 0.005; *, P < 0.05. Bar graphs in B and C represent the means ± SD of three to five mice per group from three independent experiments.CC BY-NC-SA · PubMed Central

Verification

Claims the paper makes

The claims and statistics of this paper haven’t been checked yet.

Run the check — free, no account needed. It reads the open-access text and checks the sources it cites.

A few free checks a day · papers already verified open instantly · results are public

Claims other papers make about this one

Each is checked against this paper’s own text: does it say what the citing paper says it does?

Self-check

Percentages, sums and reported differences re-computed from the paper’s own numbers.

The self-check needs the paper’s full text.

Citations

Cites

Show all 44 references

Research works printed but not linked: 3

  1. 2007, Am. J. Respir. Cell Mol. Biol., 38, 105
  2. 1997, Am. J. Pathol., 151, 999
  3. 2006, Nat. Immunol., 7, 311

Cited by

Sorted by citations

See all 377

Metadata

Authors
Herold, S., Steinmueller, M., von Wulffen, W., Cakarova, L., Pinto, R., Pleschka, S., Mack, M., Kuziel, W. A., Corazza, N., Brunner, T., Seeger, W., & Lohmeyer, J.
Affiliations
  • Justus-Liebig-Universität Gießen (DE)
  • 1University of Giessen Lung Center, Department of Internal Medicine, Division of Pulmonary and Critical Care Medicine and Infectious Diseases,
  • University of Regensburg (DE)
  • 4PDL BioPharma Inc., Redwood City, CA 94063
  • University of Bern (CH)
Venue
The Journal of Experimental Medicine
Published
2008-12-08
Volume
205
Issue
13
Pages
3065-3077
ISSN
  • 0022-1007 (ISSN-L)
  • 1540-9538
OpenAlex
W2105053798
Cited by
376
References
44
Citations by year
2026: 3 · 2025: 19 · 2024: 16 · 2023: 17 · 2022: 26 · 2021: 32 · 2020: 32 · 2019: 16 · 2018: 21 · 2017: 21 · 2016: 23 · 2015: 20 · 2014: 21 · 2013: 21 · 2012: 22
FWCI
15.84
Type
journal article
Language
en
Open access
Locations
  • The Journal of Experimental Medicine (publishedVersion)
  • PubMed Central (publishedVersion, cc-by-nc-sa)
  • PubMed (publishedVersion)
  • University of Regensburg Publication Server (University of Regensburg) (acceptedVersion)
  • KOPS (University of Konstanz) (submittedVersion)
  • Bern Open Repository and Information System (University of Bern) (submittedVersion)
  • Max Planck Institute for Plasma Physics (submittedVersion)
Topics
  • Health Sciences › Medicine › Epidemiology › Influenza Virus Research Studies
  • Life Sciences › Immunology and Microbiology › Immunology › Inflammation biomarkers and pathways
  • Life Sciences › Biochemistry, Genetics and Molecular Biology › Molecular Biology › Cell death mechanisms and regulation
Keywords
influenza virus pneumonia, alveolar epithelial cell apoptosis, TRAIL, tumor necrosis factor-related apoptosis-inducing ligand, CCR2, macrophage recruitment, respiratory failure, host defense
MeSH terms
Animals, Bronchoalveolar Lavage Fluid, Chimera, Humans, Influenza, Human, Leukocytes, Mononuclear, Lung, Macrophages, Mice, Inbred C57BL, Orthomyxoviridae, Phagocytes, Pneumonia, Apoptosis, Mice, Knockout, Respiratory Mucosa, Apoptosis Regulatory Proteins, Mice, TNF-Related Apoptosis-Inducing Ligand, Receptors, CCR2

About these checks

Registry, retraction, Cites and statistics results are computed, not judged, with one exception: a printed reference that no index lists is read once by a model before it counts as a citation error. Claims are extracted by a model and kept only when their quote appears verbatim in the text; each cited source is then checked, with a model’s help, for whether it says what the claim relies on. Those verdicts can be wrong — read the claim’s quote and the cited source before relying on one.

Statistics and arithmetic are recomputed, not judged.

Confidence bands are shown only for fields calibrated on our annotated test set. None is calibrated yet, so no band is shown.

What counts as a claim ›How we measure confidence ›How we check this ›

Are you an author, or do you see a problem with this page? Request a review