

The DOI matches its Crossref record; 40 of the 41 references it cites were found in a registry or an index.
TREM-2 promotes macrophage survival and lung disease after respiratory viral infection
Open accessAbstract
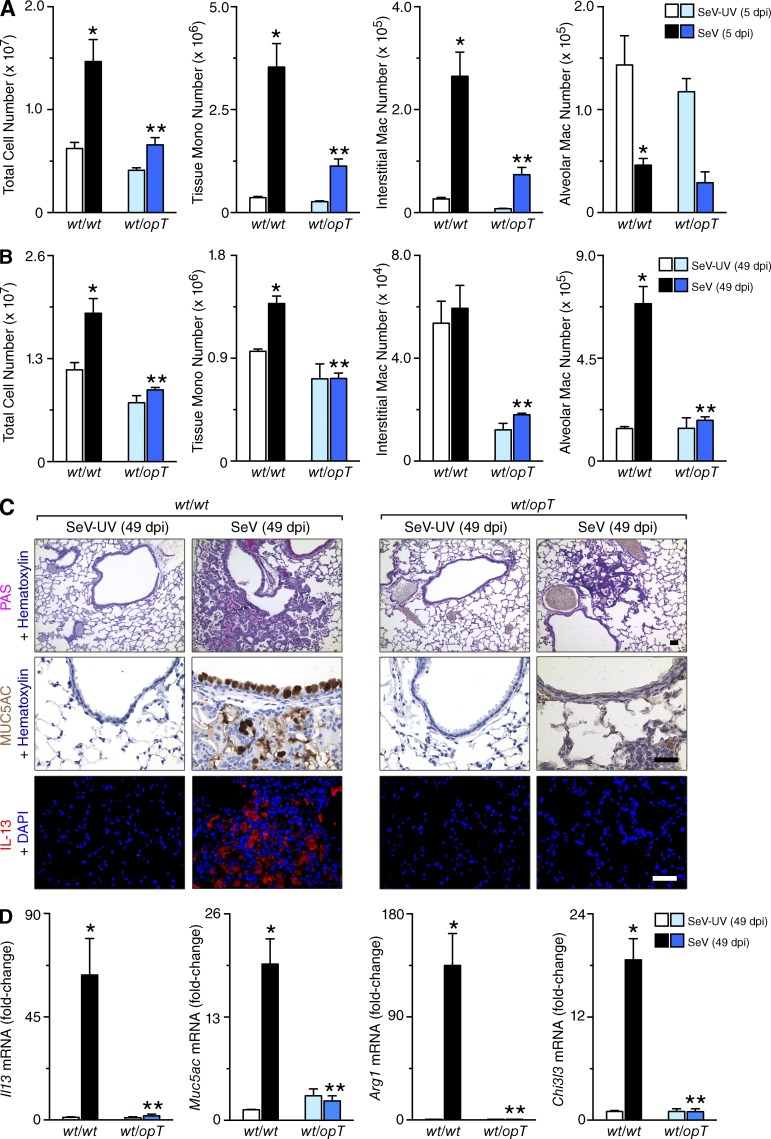
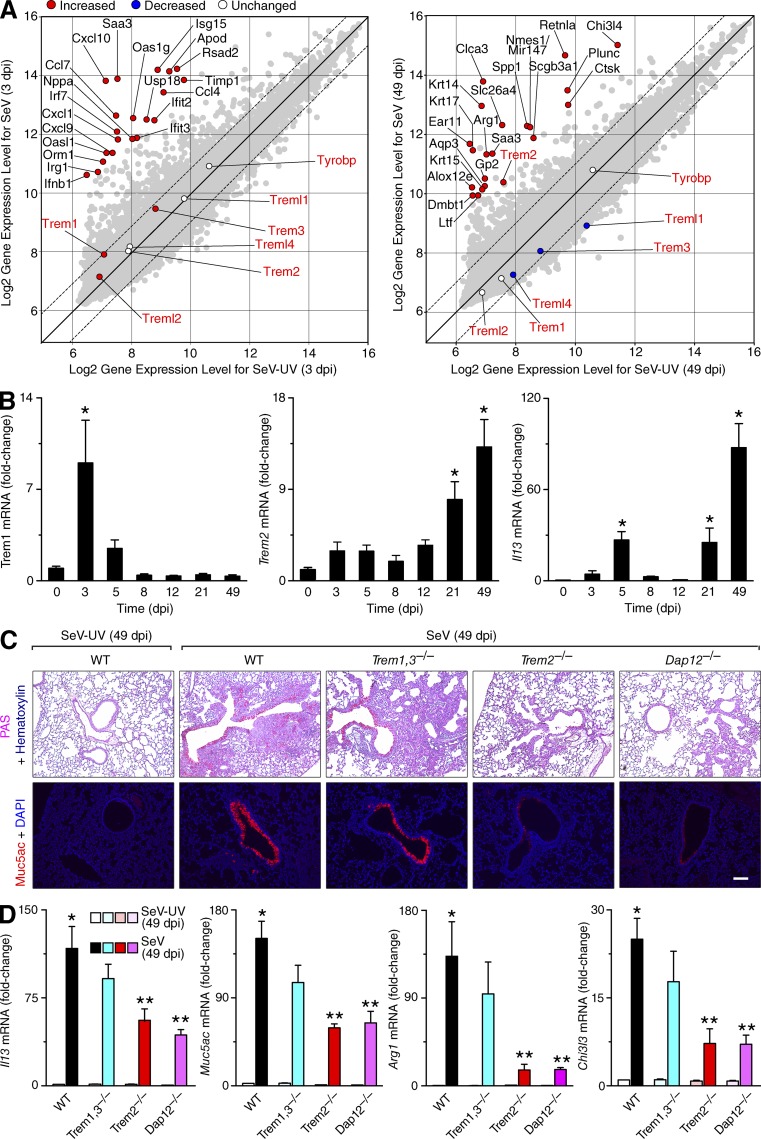
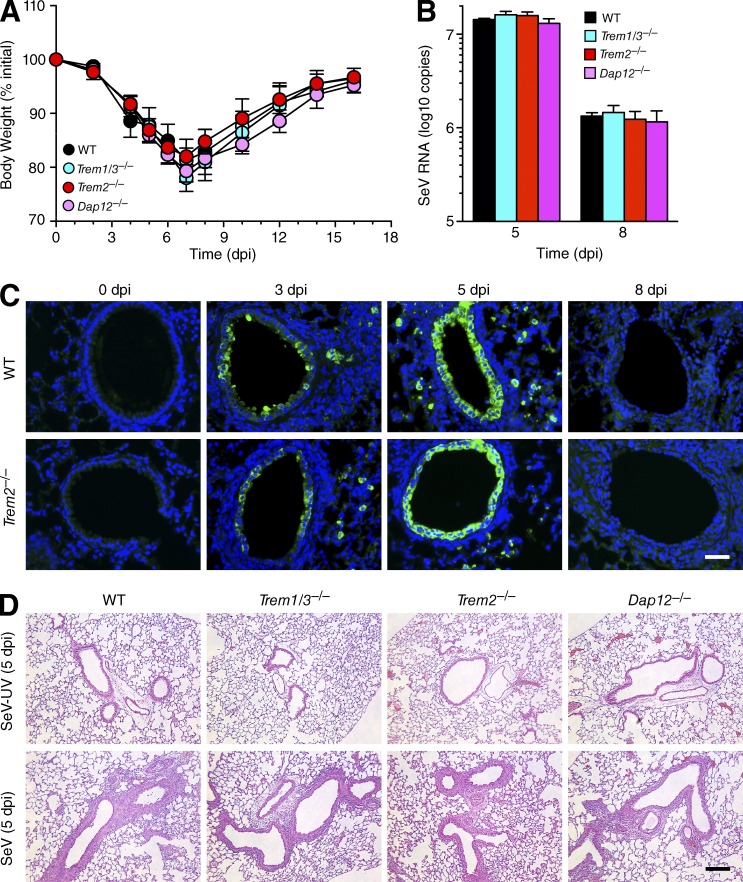
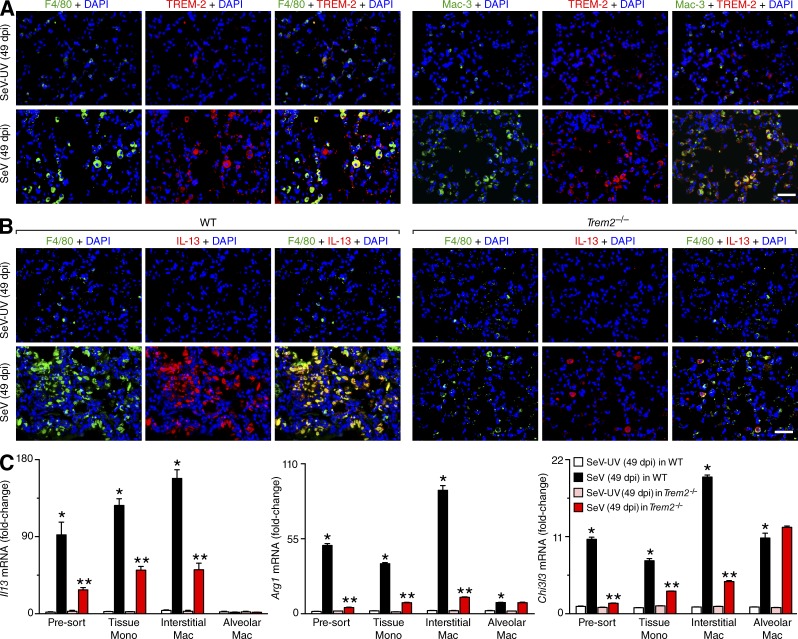
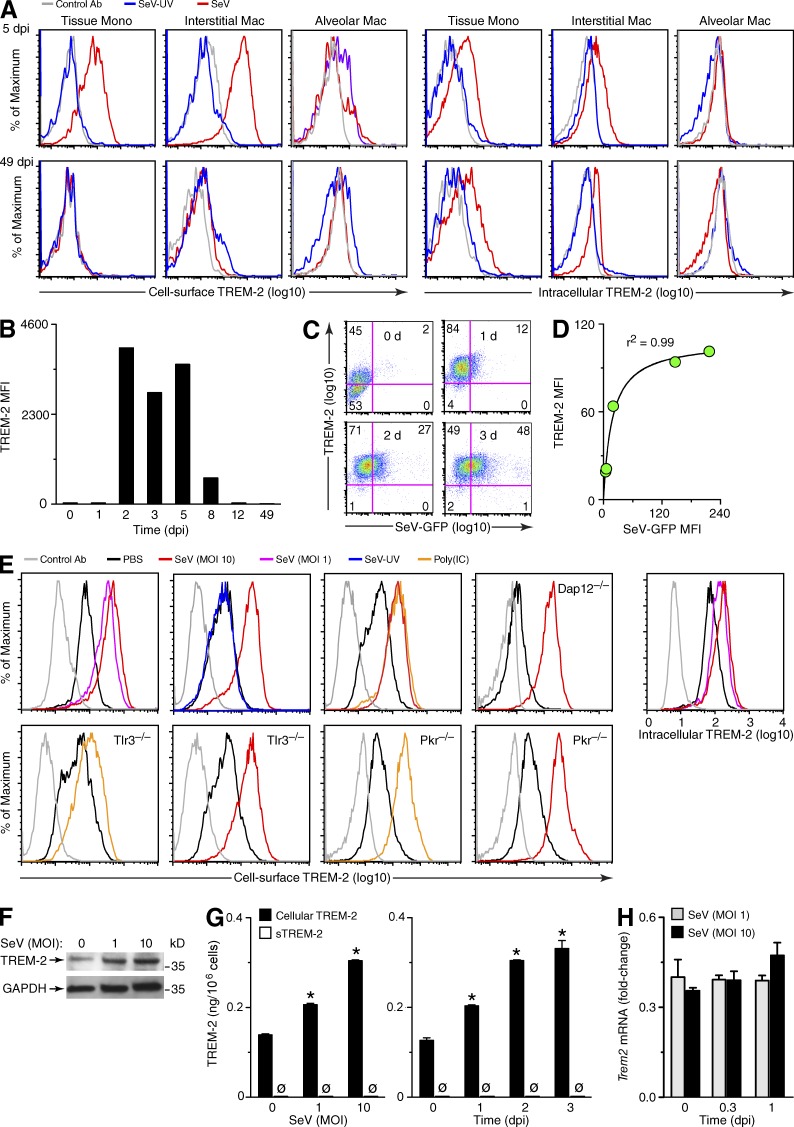
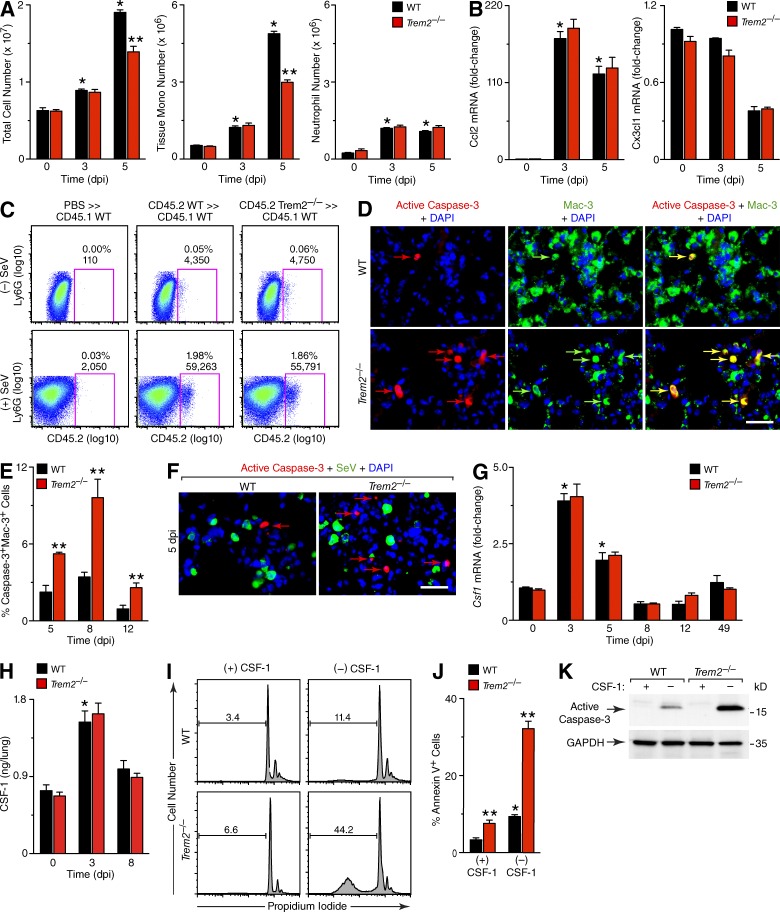
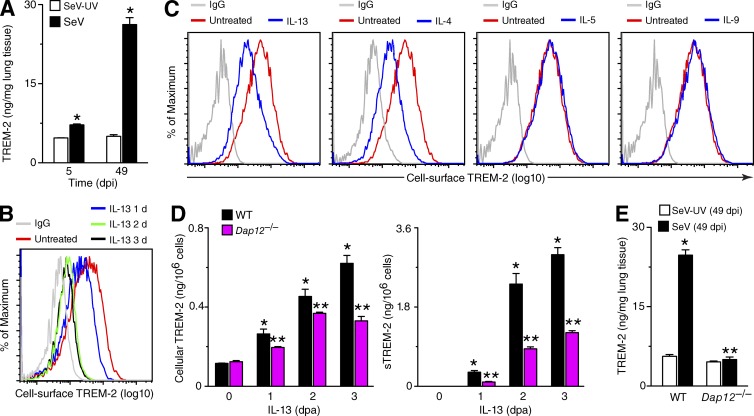
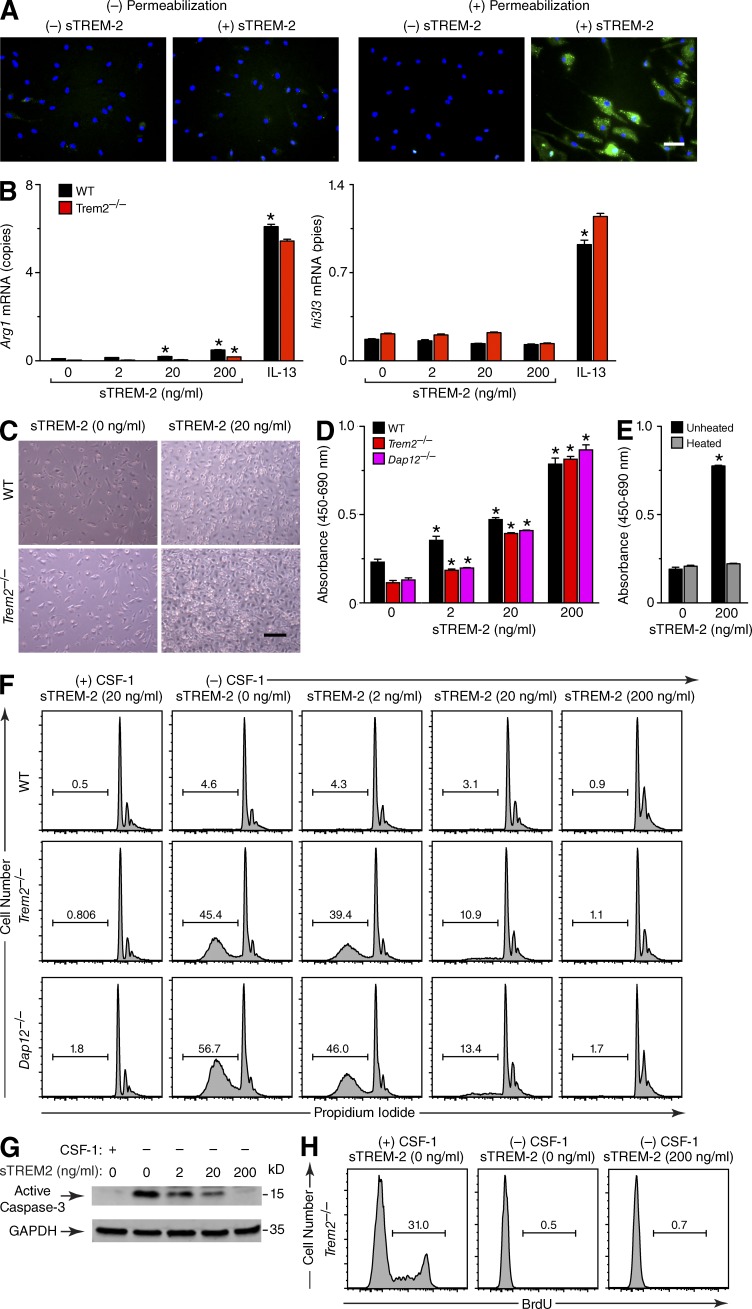
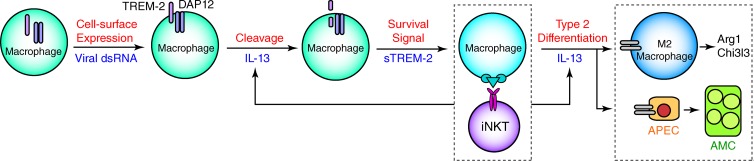
Viral infections and type 2 immune responses are thought to be critical for the development of chronic respiratory disease, but the link between these events needs to be better defined. Here, we study a mouse model in which infection with a mouse parainfluenza virus known as Sendai virus (SeV) leads to long-term activation of innate immune cells that drive IL-13-dependent lung disease. We find that chronic postviral disease (signified by formation of excess airway mucus and accumulation of M2-differentiating lung macrophages) requires macrophage expression of triggering receptor expressed on myeloid cells-2 (TREM-2). Analysis of mechanism shows that viral replication increases lung macrophage levels of intracellular and cell surface TREM-2, and this action prevents macrophage apoptosis that would otherwise occur during the acute illness (5-12 d after inoculation). However, the largest increases in TREM-2 levels are found as the soluble form (sTREM-2) long after clearance of infection (49 d after inoculation). At this time, IL-13 and the adapter protein DAP12 promote TREM-2 cleavage to sTREM-2 that is unexpectedly active in preventing macrophage apoptosis. The results thereby define an unprecedented mechanism for a feed-forward expansion of lung macrophages (with IL-13 production and consequent M2 differentiation) that further explains how acute infection leads to chronic inflammatory disease.
Overview
The claims and statistics of this paper haven’t been checked yet.
Run the check — free, no account needed. It reads the open-access text and checks the sources it cites.
Integrity signals
Registry
Cites
Statistics
Figures
Verification
Claims the paper makes
The claims and statistics of this paper haven’t been checked yet.
Run the check — free, no account needed. It reads the open-access text and checks the sources it cites.
Claims other papers make about this one
Each is checked against this paper’s own text: does it say what the citing paper says it does?
In the citing paper
“The knockdown of Trem2 decreasing survival and altering the metabolism of microglia is consistent with previous studies (35,38–40,56,57).”
From Trem2 promotes anti-inflammatory responses in microglia and is suppressed under pro-inflammatory conditions (2020) · cites this paper as [56]
Self-check
Percentages, sums and reported differences re-computed from the paper’s own numbers.
The self-check needs the paper’s full text.
Citations
Cites
Recognition of double-stranded RNA and activation of NF-κB by Toll-like receptor 3
Alexopoulou, L., Holt, A. C., Medzhitov, R., & Flavell, R. A. (2001) · Nature · doi:10.1038/35099560 · Cited by 6,129
Bouchon, A., Dietrich, J., & Colonna, M. (2000) · The Journal of Immunology · doi:10.4049/jimmunol.164.10.4991 · Cited by 1,284 · cited 2×
“2, C and D), consistent with the association of TREM-2 and DAP12 phenotype in other systems (Bouchon et al., 2000; Kaifu et al., 2003; Turnbull et al., 2006).”
BackgroundTREM-1 amplifies inflammation and is a crucial mediator of septic shock
Bouchon, A., Facchetti, F., Weigand, M. A., & Colonna, M. (2001) · Nature · doi:10.1038/35074114 · Cited by 1,092
TREM2 mutations implicated in neurodegeneration impair cell surface transport and phagocytosis
Kleinberger, G., Yamanishi, Y., Suárez-Calvet, M., Czirr, E., Lohmann, E., Cuyvers, E., Struyfs, H., Pettkus, N., Wenninger-Weinzierl, A., Mazaheri, F., et al. (2014) · Science Translational Medicine · doi:10.1126/scitranslmed.3009093 · Cited by 798
Self-citationTREMs in the immune system and beyond
Colonna, M. (2003) · Nature Reviews Immunology · doi:10.1038/nri1106 · Cited by 701
Self-citationCutting Edge: TREM-2 Attenuates Macrophage Activation
Turnbull, I. R., Gilfillan, S., Cella, M., Aoshi, T., Miller, M., Piccio, L., Hernandez, M., & Colonna, M. (2006) · The Journal of Immunology · doi:10.4049/jimmunol.177.6.3520 · Cited by 688
Deficient signaling in mice devoid of double‐stranded RNA‐dependent protein kinase.
Yang, Y. L., Reis, L. F. L., Pavlovic, J., Aguzzi, A., Schäfer, R., Kumar, A., Williams, B. R. G., Aguet, M., & Weissmann, C. (1995) · The EMBO Journal · doi:10.1002/j.1460-2075.1995.tb00300.x · Cited by 632
Kim, E. Y., Battaile, J. T., Patel, A. C., You, Y., Agapov, E., Grayson, M. H., Benoit, L. A., Byers, D. E., Alevy, Y., Tucker, J., et al. (2008) · Nature Medicine · doi:10.1038/nm1770 · Cited by 523
Self-citationBouchon, A., Hernández-Munain, C., Cella, M., & Colonna, M. (2001) · The Journal of Experimental Medicine · doi:10.1084/jem.194.8.1111 · Cited by 460
Hamerman, J. A., Jarjoura, J. R., Humphrey, M. B., Nakamura, M. C., Seaman, W. E., & Lanier, L. L. (2006) · The Journal of Immunology · doi:10.4049/jimmunol.177.4.2051 · Cited by 440
Cited by
Sorted by citations
Innate Immune Landscape in Early Lung Adenocarcinoma by Paired Single-Cell Analyses
Lavin, Y., Kobayashi, S., Leader, A., Amir, E.-A. D., Elefant, N., Bigenwald, C., Remark, R., Sweeney, R., Becker, C. D., Levine, J. H., et al. (2017) · Cell · doi:10.1016/j.cell.2017.04.014 · Cited by 1,209
TREM2 — a key player in microglial biology and Alzheimer disease
Ulland, T. K., & Colonna, M. (2018) · Nature Reviews Neurology · doi:10.1038/s41582-018-0072-1 · Cited by 735
Self-citationTREM2 Modulation Remodels the Tumor Myeloid Landscape Enhancing Anti-PD-1 Immunotherapy
Molgora, M., Esaulova, E., Vermi, W., Hou, J., Chen, Y., Luo, J., Brioschi, S., Bugatti, M., Omodei, A. S., Ricci, B., et al. (2020) · Cell · doi:10.1016/j.cell.2020.07.013 · Cited by 656
“During lung acute viral infection, TREM2+ macrophages release sTREM2, which inhibits apoptosis of macrophages, causing a feed-forward expansion of lung macrophages that converts acute infection into a chronic inflammatory disease (Wu et al., 2015).”
Biology of lung macrophages in health and disease
Aegerter, H., Lambrecht, B. N., & Jakubzick, C. (2022) · Immunity · doi:10.1016/j.immuni.2022.08.010 · Cited by 652
The Physiology, Pathology, and Potential Therapeutic Applications of the TREM2 Signaling Pathway
Deczkowska, A., Weiner, A., & Amit, I. (2020) · Cell · doi:10.1016/j.cell.2020.05.003 · Cited by 648
New insights into the role of TREM2 in Alzheimer’s disease
Gratuze, M., Leyns, C. E. G., & Holtzman, D. M. (2018) · Molecular Neurodegeneration · doi:10.1186/s13024-018-0298-9 · Cited by 489
TREM2, microglia, and neurodegenerative diseases
Yeh, F. L., Hansen, D. V., & Sheng, M. (2017) · Trends in Molecular Medicine · doi:10.1016/j.molmed.2017.03.008 · Cited by 440
TREM2 variants: new keys to decipher Alzheimer disease pathogenesis
Colonna, M., & Wang, Y. (2016) · Nature Reviews Neuroscience · doi:10.1038/nrn.2016.7 · Cited by 418
TREM2 in Neurodegenerative Diseases
Jay, T. R., von Saucken, V. E., & Landreth, G. E. (2017) · Molecular Neurodegeneration · doi:10.1186/s13024-017-0197-5 · Cited by 427
Colonna, M. (2023) · Nature Reviews Immunology · doi:10.1038/s41577-023-00837-1 · Cited by 394
Self-citationInsights Gained from Single-Cell Analysis of Immune Cells in the Tumor Microenvironment
Ren, X., Zhang, L., Zhang, Y., Li, Z., Siemers, N. O., & Zhang, Z. (2021) · Annual Review of Immunology · doi:10.1146/annurev-immunol-110519-071134 · Cited by 371
Soluble TREM2 induces inflammatory responses and enhances microglial survival
Zhong, L., Chen, X., Wang, T., Wang, Z., Liao, C., Wang, Z., Huang, R., Wang, D., Li, X., Wu, L., et al. (2017) · The Journal of Experimental Medicine · doi:10.1084/jem.20160844 · Cited by 368
Elucidating the Role of TREM2 in Alzheimer’s Disease
Ulrich, J. D., Ulland, T. K., Colonna, M., & Holtzman, D. M. (2017) · Neuron · doi:10.1016/j.neuron.2017.02.042 · Cited by 325
Humanized TREM2 mice reveal microglia-intrinsic and -extrinsic effects of R47H polymorphism
Song, W. M., Joshita, S., Zhou, Y., Ulland, T. K., Gilfillan, S., & Colonna, M. (2018) · Journal of Experimental Medicine · doi:10.1084/jem.20171529 · Cited by 305
Self-citationMicroglia in Alzheimer’s disease: pathogenesis, mechanisms, and therapeutic potentials
Miao, J., Ma, H., Yang, Y., Liao, Y., Lin, C., Zheng, J., Yu, M., & Lan, J. (2023) · Frontiers in Aging Neuroscience · doi:10.3389/fnagi.2023.1201982 · Cited by 293
TREM2-Ligand Interactions in Health and Disease
Kober, D. L., & Brett, T. J. (2017) · Journal of Molecular Biology · doi:10.1016/j.jmb.2017.04.004 · Cited by 284
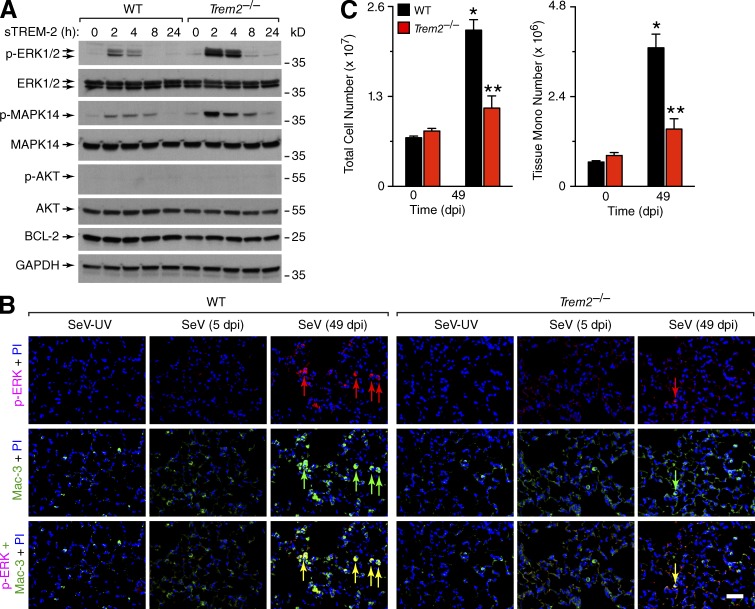
“In the first study of sTREM2 function, application of sTREM2 (residues 19–136) to cultured BMDMs resulted in ERK and MAPK14 activation that persisted several hours and prevented apoptosis following M-CSF withdrawal [71].”
BackgroundSelf-citationWang, X., He, Q., Zhou, C., Xu, Y., Liu, D., Fujiwara, N., Kubota, N., Click, A., Henderson, P., Vancil, J., et al. (2023) · Immunity · doi:10.1016/j.immuni.2022.11.013 · Cited by 262
Kleinberger, G., Brendel, M., Mracsko, E. Z., Wefers, B., Groeneweg, L., Xiang, X., Focke, C., Deußing, M., Suárez‐Calvet, M., Mazaheri, F., et al. (2017) · The EMBO Journal · doi:10.15252/embj.201796516 · Cited by 249
Is resolution the end of inflammation?
Feehan, K. T., & Gilroy, D. W. (2019) · Trends in Molecular Medicine · doi:10.1016/j.molmed.2019.01.006 · Cited by 229
Zhang, Y., Mao, D., Roswit, W. T., Jin, X., Patel, A. C., Patel, D. A., Agapov, E. V., Wang, Z., Tidwell, R. M., Atkinson, J. J., et al. (2015) · Nature Immunology · doi:10.1038/ni.3279 · Cited by 222
Hendrikx, T., Porsch, F., Kiss, M. G., Rajcic, D., Papac-Miličević, N., Hoebinger, C., Goederle, L., Hladik, A., Shaw, L. E., Horstmann, H., et al. (2022) · Journal of Hepatology · doi:10.1016/j.jhep.2022.06.004 · Cited by 220
Kober, D. L., Alexander-Brett, J. M., Karch, C. M., Cruchaga, C., Colonna, M., Holtzman, M. J., & Brett, T. J. (2016) · eLife · doi:10.7554/elife.20391 · Cited by 238
Jung, S., Hwang, B., Shin, S. Y., Park, E., Park, S., Kim, C. W., Kim, E., Choo, E. H., Choi, I. J., Świrski, F. K., et al. (2022) · Nature Communications · doi:10.1038/s41467-022-32284-2 · Cited by 215
Liu, W., Taso, O., Wang, R., Bayram, S., Graham, A. C., Garcia-Reitboeck, P., Mallach, A., Andrews, W. D., Piers, T. M., Botia, J. A., et al. (2020) · Human Molecular Genetics · doi:10.1093/hmg/ddaa209 · Cited by 214
“The knockdown of Trem2 decreasing survival or altering the metabolism of microglia is consistent with previous studies (Ulland et al. 2017; Wang et al. 2015; Wu et al. 2015; Zheng et al. 2017).”
ResultTREM2, microglia, and Alzheimer’s disease.
Qin, Q., Teng, Z., Liu, C., Li, Q., Yin, Y., & Tang, Y. (2021) · Mechanisms of Ageing and Development · doi:10.1016/j.mad.2021.111438 · Cited by 219
TREM2 dependent and independent functions of microglia in Alzheimer’s disease
Hou, J., Chen, Y., Grajales-Reyes, G., & Colonna, M. (2022) · Molecular Neurodegeneration · doi:10.1186/s13024-022-00588-y · Cited by 191
Self-citationTREM2 deficiency reduces the efficacy of immunotherapeutic amyloid clearance
Xiang, X., Werner, G., Bohrmann, B., Liesz, A., Mazaheri, F., Capell, A., Feederle, R., Knuesel, I., Kleinberger, G., & Haass, C. (2016) · EMBO Molecular Medicine · doi:10.15252/emmm.201606370 · Cited by 183
The Role of APOE and TREM2 in Alzheimer′s Disease—Current Understanding and Perspectives
Wolfe, C. M., Fitz, N. F., Nam, K. N., Lefterov, I. M., & Koldamova, R. P. (2018) · International Journal of Molecular Sciences · doi:10.3390/ijms20010081 · Cited by 199
TREM2 in CNS homeostasis and neurodegenerative disease
Painter, M. M., Atagi, Y., Liu, C.-C., Rademakers, R., Xu, H., Fryer, J. D., & Bu, G. (2015) · Molecular Neurodegeneration · doi:10.1186/s13024-015-0040-9 · Cited by 169
Function of Macrophages in Disease: Current Understanding on Molecular Mechanisms
Zhang, C., Yang, M. J., & Ericsson, A. C. (2021) · Frontiers in Immunology · doi:10.3389/fimmu.2021.620510 · Cited by 162
BMAL1 links the circadian clock to viral airway pathology and asthma phenotypes
Ehlers, A., Xie, W., Agapov, E. V., Brown, S. G., Steinberg, D. F., Tidwell, R. M., Sajol, G., Schutz, R., Weaver, R., Yu, H., et al. (2017) · Mucosal Immunology · doi:10.1038/mi.2017.24 · Cited by 159
Garcia-Reitboeck, P., Phillips, A., Piers, T. M., Villegas-Llerena, C., Butler, M., Mallach, A., Rodrigues, C., Arber, C. E., Heslegrave, A., Zetterberg, H., et al. (2018) · Cell Reports · doi:10.1016/j.celrep.2018.07.094 · Cited by 162
TREM2 inhibits inflammatory responses in mouse microglia by suppressing the PI3K/NF‐κB signaling
Li, C., Zhao, B. Q., Lin, C., Gong, Z., & An, X. (2018) · Cell Biology International · doi:10.1002/cbin.10975 · Cited by 161
Zhao, Y., Kilian, C., Turner, J., Bosurgi, L., Roedl, K., Bartsch, P., Gnirck, A.-C., Cortesi, F., Schultheiß, C., Hellmig, M., et al. (2021) · Science Immunology · doi:10.1126/sciimmunol.abf6692 · Cited by 157
TREM2 Function in Alzheimer’s Disease and Neurodegeneration
Ulrich, J. D., & Holtzman, D. M. (2016) · ACS Chemical Neuroscience · doi:10.1021/acschemneuro.5b00313 · Cited by 154
Price, B. R., Sudduth, T. L., Weekman, E. M., Johnson, S. N., Hawthorne, D., Woolums, A. E., & Wilcock, D. M. (2020) · Journal of Neuroinflammation · doi:10.1186/s12974-020-01915-0 · Cited by 145
Grabiec, A. M., & Hussell, T. (2016) · Seminars in Immunopathology · doi:10.1007/s00281-016-0555-3 · Cited by 148
Cerebrospinal fluid soluble TREM2 in aging and Alzheimer’s disease
Henjum, K., Almdahl, I. S., Årskog, V., Minthon, L., Hansson, O., Fladby, T., & Nilsson, L. N. G. (2016) · Alzheimer s Research & Therapy · doi:10.1186/s13195-016-0182-1 · Cited by 145
Soluble TREM2: Innocent bystander or active player in neurological diseases?
Filipello, F., Goldsbury, C., You, S. F., Locca, A., Karch, C. M., & Piccio, L. (2022) · Neurobiology of Disease · doi:10.1016/j.nbd.2022.105630 · Cited by 134
Microglia-Mediated Neuroprotection, TREM2, and Alzheimer’s Disease: Evidence From Optical Imaging
Condello, C., Yuan, P., & Grutzendler, J. (2018) · Biological Psychiatry · doi:10.1016/j.biopsych.2017.10.007 · Cited by 131
TREM2: Potential therapeutic targeting of microglia for Alzheimer's disease
Li, Y., Xu, H., Wang, H., Yang, K., Luan, J., & Wang, S. (2023) · Biomedicine & Pharmacotherapy · doi:10.1016/j.biopha.2023.115218 · Cited by 133
Woodruff, P. G., van den Berge, M., Boucher, R. C., Brightling, C. E., Burchard, E. G., Christenson, S. A., Han, M. K., Holtzman, M. J., Kraft, M., Lynch, D. A., et al. (2017) · American Journal of Respiratory and Critical Care Medicine · doi:10.1164/rccm.201705-0973ws · Cited by 115
Zhang, H., Liu, Z., Wen, H., Guo, Y., Xu, F., Zhu, Q., Yuan, W., Luo, R., Lu, C., Liu, R., et al. (2022) · Cancer Immunology Immunotherapy · doi:10.1007/s00262-022-03173-w · Cited by 117
Lu, Q., Yokoyama, C. C., Williams, J. W., Baldridge, M. T., Jin, X., DesRochers, B. L., Bricker, T. L., Wilen, C. B., Bagaitkar, J., Loginicheva, E., et al. (2016) · Cell Host & Microbe · doi:10.1016/j.chom.2015.12.011 · Cited by 103
Influenza A Virus Infection Causes Chronic Lung Disease Linked to Sites of Active Viral RNA Remnants
Keeler, S. P., Agapov, E. V., Hinojosa, M. E., Letvin, A. N., Wu, K., & Holtzman, M. J. (2018) · The Journal of Immunology · doi:10.4049/jimmunol.1800671 · Cited by 96
Saber, M., Kokiko‐Cochran, O. N., Puntambekar, S. S., Lathia, J. D., & Lamb, B. T. (2016) · Journal of Neurotrauma · doi:10.1089/neu.2016.4401 · Cited by 97
García‐Revilla, J., Deierborg, T., Venero, J. L., & Boza‐Serrano, A. (2020) · Frontiers in Immunology · doi:10.3389/fimmu.2020.02069 · Cited by 90
TREM2 suppresses the proinflammatory response to facilitate PRRSV infection via PI3K/NF-κB signaling
Zhu, Z., Zhang, X., Dong, W., Wang, X., he, S. T., Zhang, H., Wang, X., Wei, R., Chen, Y., Liu, X., et al. (2020) · PLoS Pathogens · doi:10.1371/journal.ppat.1008543 · Cited by 91
TREM2 in Alzheimer’s Disease: Microglial Survival and Energy Metabolism
Zheng, H., Cheng, B., Li, Y., Li, X., Chen, X., & Zhang, Y.-W. (2018) · Frontiers in Aging Neuroscience · doi:10.3389/fnagi.2018.00395 · Cited by 94
TREM2‐dependent effects on microglia in Alzheimer's disease
Zhou, Y., Ulland, T. K., & Colonna, M. (2018) · Frontiers in Aging Neuroscience · doi:10.3389/fnagi.2018.00202 · Cited by 82
Zhou, L., Wang, M., Guo, H., Hou, J., Zhang, Y., Li, M., Wu, X., Chen, X., & Wang, L. (2022) · Frontiers in Immunology · doi:10.3389/fimmu.2022.848367 · Cited by 85
The Alzheimer’s disease-associated protective Plcγ2-P522R variant promotes immune functions
Takalo, M., Wittrahm, R., Wefers, B., Parhizkar, S., Jokivarsi, K., Kuulasmaa, T., Mäkinen, P., Martiskainen, H., Wurst, W., Xiang, X., et al. (2020) · Molecular Neurodegeneration · doi:10.1186/s13024-020-00402-7 · Cited by 83
Pleiotropic neuroprotective effects of taxifolin in cerebral amyloid angiopathy
Inoue, T., Saitô, S., Tanaka, M., Yamakage, H., Kusakabe, T., Shimatsu, A., Ihara, M., & Satoh‐Asahara, N. (2019) · Proceedings of the National Academy of Sciences · doi:10.1073/pnas.1901659116 · Cited by 81
Functional insights from biophysical study of TREM2 interactions with apoE and Aβ 1‐42
Kober, D. L., Stuchell‐Brereton, M. D., Kluender, C. E., Dean, H. B., Strickland, M. R., Steinberg, D. F., Nelson, S. S., Baban, B. A., Holtzman, D. M., Frieden, C., et al. (2020) · Alzheimer s & Dementia · doi:10.1002/alz.12194 · Cited by 85
TREM2: A new player in the tumor microenvironment
Molgora, M., Liu, Y. A., Colonna, M., & Cella, M. (2023) · Seminars in Immunology · doi:10.1016/j.smim.2023.101739 · Cited by 80
Wang, Y., Cao, C., Zhu, Y., Fan, H., Liu, Q., Liu, Y., Chen, K., Wu, Y., Liang, S., Li, M., et al. (2022) · Cell Death & Disease · doi:10.1038/s41419-022-05193-x · Cited by 69
Chen, F., El-Naccache, D. W., Ponessa, J. J., Lemenze, A. D., Espinosa, V., Wu, W., Lothstein, K. E., Jin, L., Antao, O. Q., Weinstein, J. S., et al. (2022) · Cell Reports · doi:10.1016/j.celrep.2021.110215 · Cited by 63
Foo, S., Cambou, M. C., Mok, T., Fajardo, V. M., Jung, K. L., Fuller, T. L., Chen, W., Kerin, T., Mei, J. Y., Bhattacharya, D., et al. (2021) · Cell Reports Medicine · doi:10.1016/j.xcrm.2021.100453 · Cited by 65
Behavioral and transcriptomic analysis of Trem2-null mice: not all knockout mice are created equal
Kang, S. S., Kurti, A., Baker, K. E., Liu, C.-C., Colonna, M., Ulrich, J. D., Holtzman, D. M., Bu, G., & Fryer, J. D. (2018) · Human Molecular Genetics · doi:10.1093/hmg/ddx366 · Cited by 62
Self-citationImpact of aging immune system on neurodegeneration and potential immunotherapies
Liang, Z., Zhao, Y., Ruan, L., Zhu, L., Jin, K., Zhuge, Q., Su, D., & Zhao, Y. L. (2017) · Progress in Neurobiology · doi:10.1016/j.pneurobio.2017.07.006 · Cited by 64
Exploring the Impact of TREM2 in Tumor-Associated Macrophages
Khantakova, D., Brioschi, S., & Molgora, M. (2022) · Vaccines · doi:10.3390/vaccines10060943 · Cited by 64
Multimodal profiling reveals tissue-directed signatures of human immune cells altered with age
Wells, S. B., Rainbow, D. B., Mark, M., Szabo, P. A., Ergen, C., Caron, D. P., Maceiras, A. R., Rahmani, E., Benuck, E., Amiri, V. V. P., et al. (2025) · Nature Immunology · doi:10.1038/s41590-025-02241-4 · Cited by 67
Immune determinants of chronic sequelae after respiratory viral infection
Narasimhan, H., Wu, Y., Goplen, N. P., & Sun, J. (2022) · Science Immunology · doi:10.1126/sciimmunol.abm7996 · Cited by 60
Basal epithelial stem cells cross an alarmin checkpoint for postviral lung disease
Wu, K., Kamimoto, K., Zhang, Y., Yang, K., Keeler, S. P., Gerovac, B. J., Agapov, E. V., Austin, S. R., Yantis, J., Gissy, K. A., et al. (2021) · Journal of Clinical Investigation · doi:10.1172/jci149336 · Cited by 49
The therapeutic potential of TREM2 in cancer
Wolf, E. M., Fingleton, B., & Hasty, A. H. (2022) · Frontiers in Oncology · doi:10.3389/fonc.2022.984193 · Cited by 50
Wein, A. N., Dunbar, P. R., McMaster, S. R., Li, Z.-R. T., Denning, T. L., & Kohlmeier, J. E. (2018) · The Journal of Immunology · doi:10.4049/jimmunol.1701796 · Cited by 48
TREM-2 is a sensor and activator of T cell response in SARS-CoV-2 infection
Wu, Y., Wang, M., Yin, H., Ming, S., Li, X., Jiang, G., Liu, Y., Wang, P., Zhou, G., Liu, L., et al. (2021) · Science Advances · doi:10.1126/sciadv.abi6802 · Cited by 44
Davidov, V., Jensen, G. L., Mai, S., Chen, S., & Pan, P. (2020) · Frontiers in Immunology · doi:10.3389/fimmu.2020.01842 · Cited by 45
Does soluble TREM2 protect against Alzheimer's disease?
Brown, G. C., & St George-Hyslop, P. (2022) · Frontiers in Aging Neuroscience · doi:10.3389/fnagi.2021.834697 · Cited by 39
Byers, D. E., Wu, K., Dang-Vu, G., Jin, X., Agapov, E. V., Zhang, X., Battaile, J. T., Schechtman, K. B., Yusen, R. D., Pierce, R. A., et al. (2017) · CHEST Journal · doi:10.1016/j.chest.2017.09.044 · Cited by 40
COVID-19 lung disease shares driver AT2 cytopathic features with Idiopathic pulmonary fibrosis
Sinha, S., Castillo, V., Espinoza, C. R., Tindle, C., Fonseca, A. G., Dan, J. M., Katkar, G. D., Das, S., Sahoo, D., & Ghosh, P. (2022) · EBioMedicine · doi:10.1016/j.ebiom.2022.104185 · Cited by 43
Kim, K., Park, S.-E., Park, J.-S., & Choi, J. (2022) · Current Opinion in Lipidology · doi:10.1097/mol.0000000000000842 · Cited by 39
Qu, W., Wang, Y., Wu, Y., Liu, Y., Chen, K., Liu, X., Zou, Z., Huang, X., & Wu, M. (2018) · Frontiers in Immunology · doi:10.3389/fimmu.2018.01121 · Cited by 40
The Emerging Roles and Therapeutic Potential of Soluble TREM2 in Alzheimer’s Disease
Zhong, L., & Chen, X. (2019) · Frontiers in Aging Neuroscience · doi:10.3389/fnagi.2019.00328 · Cited by 40
Meprin β cleaves TREM2 and controls its phagocytic activity on macrophages
Berner, D. K., Wessolowski, L., Armbrust, F., Schneppenheim, J., Schlepckow, K., Koudelka, T., Scharfenberg, F., Lucius, R., Tholey, A., Kleinberger, G., et al. (2020) · The FASEB Journal · doi:10.1096/fj.201902183r · Cited by 39
Hwang, M., Savarin, C., Kim, J., Powers, J., Towne, N., Oh, H., & Bergmann, C. C. (2022) · Journal of Neuroinflammation · doi:10.1186/s12974-022-02629-1 · Cited by 40
Cui, X., Qiao, J., Liu, S., Wu, M., & Gu, W. (2020) · Brain Research Bulletin · doi:10.1016/j.brainresbull.2020.10.006 · Cited by 35
Yang, S., Yang, Y., Wang, F., Luo, Q., Zhang, Y., Zheng, F., Shu, Q., Chen, Q., & Fang, X. (2021) · American Journal of Respiratory Cell and Molecular Biology · doi:10.1165/rcmb.2020-0521oc · Cited by 35
Korvatska, O., Kiianitsa, K., Ratushny, A. V., Matsushita, M. M., Beeman, N. E., Chien, W., Satoh, J., Dorschner, M. O., Keene, C. D., Bammler, T. K., et al. (2020) · Frontiers in Immunology · doi:10.3389/fimmu.2020.559342 · Cited by 31
The sTREM2 Concentrations in the Blood: A Marker of Neurodegeneration?
Ferri, E., Rossi, P. D., Geraci, A., Ciccone, S., Cesari, M., & Arosio, B. (2021) · Frontiers in Molecular Biosciences · doi:10.3389/fmolb.2020.627931 · Cited by 35
Jiang, Y., Yu, W., Hu, T., Peng, H., Hu, F., Yuan, Y., Liu, X., Lai, S., Zhou, J., & Dong, X. S. (2024) · Frontiers in Immunology · doi:10.3389/fimmu.2024.1335333 · Cited by 32
Divergent sensory pathways of sneezing and coughing
Jiang, H., Cui, H., Chen, M., Li, F., Shen, X., Guo, C., Hoekel, G. E., Zhu, Y., Han, L., Wu, K., et al. (2024) · Cell · doi:10.1016/j.cell.2024.08.009 · Cited by 34
Reduced TREM2 activation in microglia of patients with Alzheimer's disease
Okuzono, Y., Sakuma, H., Miyakawa, S., Ifuku, M., Lee, J. H., Das, D., Banerjee, A., Zhao, Y., Yamamoto, K., Ando, T., et al. (2021) · FEBS Open Bio · doi:10.1002/2211-5463.13300 · Cited by 33
TREM2 expression in the brain and biological fluids in prion diseases
Diaz-Lucena, D., Kruse, N., Thüne, K., Schmitz, M., Villar-Piqué, A., da Cunha, J. E. G., Hermann, P., López-Pérez, Ó., Andrés-Benito, P., Ladogana, A., et al. (2021) · Acta Neuropathologica · doi:10.1007/s00401-021-02296-1 · Cited by 32
Ferrara, S. J., Chaudhary, P., DeBell, M. J., Marracci, G., Miller, H. I., Calkins, E., Pocius, E., Napier, B. A., Emery, B., BOURDETTE, D. N., et al. (2021) · Cell chemical biology · doi:10.1016/j.chembiol.2021.07.014 · Cited by 36
Zhu, D., Huang, M., Shen, P., Zhang, B., Chen, G., Chen, J., Duan, L., & Duan, Y. (2023) · Journal of Cellular and Molecular Medicine · doi:10.1111/jcmm.17842 · Cited by 30
Oatis, D. A., Simon-Repolski, E., Baltă, C., Mihu, A. G., Pieretti, G., Alfano, R., Peluso, L., Trotta, M. C., D’Amico, M., & Hermenean, A. O. (2022) · International Journal of Molecular Sciences · doi:10.3390/ijms23158210 · Cited by 29
Cholesterol efflux pathways hinder KRAS-driven lung tumor progenitor cell expansion
Guilbaud, E., Barouillet, T., Ilié, M., Borowczyk, C., Ivanov, S., Sarrazy, V., Vaillant, N., Ayrault, M., Castiglione, A., Rignol, G., et al. (2023) · Cell stem cell · doi:10.1016/j.stem.2023.05.005 · Cited by 28
The age-related microglial transformation in Alzheimer's disease pathogenesis
Yuan, C., Aierken, A., Xie, Z., Li, N., Zhao, J., & Qing, H. (2020) · Neurobiology of Aging · doi:10.1016/j.neurobiolaging.2020.03.024 · Cited by 27
Wang, J.-H., Kumar, S., & Liu, G. (2021) · Investigative Ophthalmology & Visual Science · doi:10.1167/iovs.62.14.22 · Cited by 28
Biofilm-Induced Type 2 Innate Immunity in a Cystic Fibrosis Model of Pseudomonas aeruginosa
Bielen, K., Jongers, B. ‘., Boddaert, J., Raju, T. K., Lammens, C., Malhotra‐Kumar, S., Jorens, P. G., Goossens, H., & Kumar‐Singh, S. (2017) · Frontiers in Cellular and Infection Microbiology · doi:10.3389/fcimb.2017.00274 · Cited by 28
Lü, X., Chen, L., Jiang, C., Cao, K., Gao, Z., & Wang, Y. (2022) · Pain · doi:10.1097/j.pain.0000000000002708 · Cited by 29
Wang, X., Wu, K., Keeler, S. P., Mao, D., Agapov, E. V., Zhang, Y., & Holtzman, M. J. (2021) · The Journal of Immunology · doi:10.4049/jimmunol.2000965 · Cited by 25
Knowledge gaps in Alzheimer's disease immune biomarker research
Morgan, D., & Mielke, M. M. (2021) · Alzheimer s & Dementia · doi:10.1002/alz.12342 · Cited by 26
Li, S., Bern, M. D., Miao, B., Fan, C., Xing, X., Inoue, T., Piersma, S. J., Wang, T., Colonna, M., Kurosaki, T., et al. (2022) · eLife · doi:10.7554/elife.77294 · Cited by 25
Wu, K., Zhang, Y., Austin, S. R., Yin‐Declue, H., Byers, D. E., Crouch, E. C., & Holtzman, M. J. (2023) · American Journal Of Pathology · doi:10.1016/j.ajpath.2023.02.005 · Cited by 25
TREM2+ macrophages: a key role in disease development
Wang, X., Wang, Y., Yang, L. X., Zhang, Y., & Yang, L. (2025) · Frontiers in Immunology · doi:10.3389/fimmu.2025.1550893 · Cited by 29
Rhinovirus-induces progression of lung disease in a mouse model of COPD via IL-33/ST2 signaling axis
Gimenes-Júnior, J. A., Srivastava, V., Reddy-Vari, H., Kotnala, S., Mishra, R., Farazuddin, M., Li, W., & Sajjan, U. S. (2019) · Clinical Science · doi:10.1042/cs20181088 · Cited by 24
Lin, C., Kong, Y., Chen, Q., Zeng, J., Pan, X., & Miao, J. (2024) · Frontiers in Aging Neuroscience · doi:10.3389/fnagi.2024.1420731 · Cited by 25
The double-edged role and therapeutic potential of TREM2 in atherosclerosis
Zhu, B., Liu, Y., & Peng, D. (2024) · Biomarker Research · doi:10.1186/s40364-024-00675-w · Cited by 28
Metadata
- Authors
- Wu, K., Byers, D. E., Jin, X., Agapov, E., Alexander-Brett, J., Patel, A. C., Cella, M., Gilfilan, S., Colonna, M., Kober, D. L., Brett, T. J., & Holtzman, M. J.
- Affiliations
- Washington University in St. Louis (US)
- Pulmonary and Critical Care Medicine, Department of Medicine 1 , 2 , 3 , 4 , and 5
- Corresponding author
- Holtzman, Michael J.
- ORCID
- Venue
- Journal of Experimental Medicine
- Publisher
- Rockefeller University Press
- Published
- 2015-04-20
- Volume
- 212
- Issue
- 5
- Pages
- 681-697
- ISSN
- 0022-1007 (ISSN-L)
- 1540-9538
- PMC
- PMC4419356
- OpenAlex
- W2111240640
- Cited by
- 207
- References
- 41
- Citations by year
- 2026: 11 · 2025: 17 · 2024: 19 · 2023: 23 · 2022: 36 · 2021: 24 · 2020: 22 · 2019: 8 · 2018: 14 · 2017: 16 · 2016: 11 · 2015: 4
- FWCI
- 7.33
- Type
- journal article
- Language
- en
- Open access
- green
- www.ncbi.nlm.nih.gov
- Licence
- cc-by-nc-sa
- Locations
- The Journal of Experimental Medicine (publishedVersion)
- Europe PMC (PubMed Central) (publishedVersion, cc-by-nc-sa)
- PubMed Central (publishedVersion, cc-by-nc-sa)
- PubMed (publishedVersion)
- Funders
- National Heart, Lung, and Blood Institute (R01HL119813, P01HL029594, R01HL073159, R01HL121791, P50HL084922, T32HL007317)
- National Institute of Allergy and Infectious Diseases (U19-AI07048, U19AI070489)
- Topics
- Life Sciences › Immunology and Microbiology › Immunology › Inflammation biomarkers and pathways
- Life Sciences › Immunology and Microbiology › Immunology › Immune Response and Inflammation
- Health Sciences › Medicine › Pulmonary and Respiratory Medicine › Asthma and respiratory diseases
- Keywords
- TREM2, macrophage survival, macrophage apoptosis, Sendai virus, respiratory viral infections, IL-13, DAP12, M2 macrophages, Th2 immune response, airway mucus hypersecretion, innate immune activation
- MeSH terms
- Animals, Cell Survival, Immunity, Innate, Lung Diseases, Membrane Glycoproteins, Respirovirus Infections, Receptors, Immunologic, Virus Replication, Macrophages, Alveolar, Apoptosis, Mice, Knockout, Interleukin-13, Sendai virus, Mice
About these checks
Registry, retraction, Cites and statistics results are computed, not judged, with one exception: a printed reference that no index lists is read once by a model before it counts as a citation error. Claims are extracted by a model and kept only when their quote appears verbatim in the text; each cited source is then checked, with a model’s help, for whether it says what the claim relies on. Those verdicts can be wrong — read the claim’s quote and the cited source before relying on one.
Statistics and arithmetic are recomputed, not judged.
Confidence bands are shown only for fields calibrated on our annotated test set. None is calibrated yet, so no band is shown.
What counts as a claim ›How we measure confidence ›How we check this ›
Are you an author, or do you see a problem with this page? Request a review
