Cited by 298

The DOI matches its Crossref record; 9 of the 9 references it cites were found in a registry or an index.

Macrophages of distinct origins contribute to tumor development in the lung

Loyher, Pierre-Louis, Hamon, Pauline, Laviron, Marie, Meghraoui-Kheddar, Aïda, Goncalves, Elena, Deng, Zihou, Torstensson, Sara, Bercovici, Nadège, Baudesson de Chanville, Camille, Combadière, Béhazine, Geissmann, Frederic, Savina, Ariel, Combadière, Christophe, Boissonnas, Alexandre·2018·Journal of Experimental Medicine

Abstract

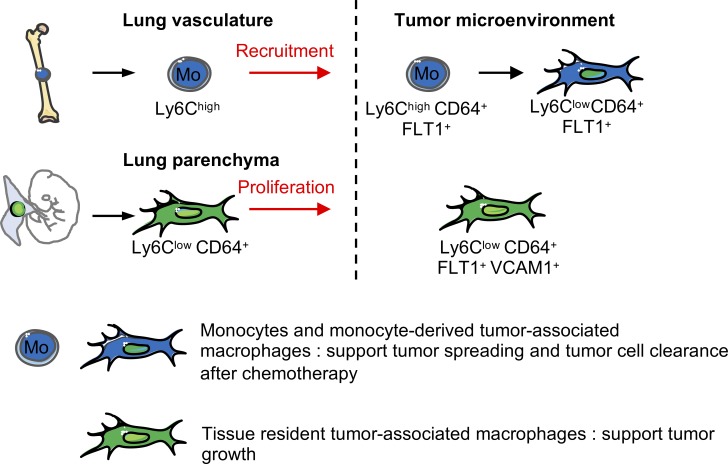
Tissue-resident macrophages can self-maintain without contribution of adult hematopoiesis. Herein we show that tissue-resident interstitial macrophages (Res-TAMs) in mouse lungs contribute to the pool of tumor-associated macrophages (TAMs) together with CCR2-dependent recruited macrophages (MoD-TAMs). Res-TAMs largely correlated with tumor cell growth in vivo, while MoD-TAMs accumulation was associated with enhanced tumor spreading. Both cell subsets were depleted after chemotherapy, but MoD-TAMs rapidly recovered and performed phagocytosis-mediated tumor clearance. Interestingly, anti-VEGF treatment combined with chemotherapy inhibited both Res and Mod-TAM reconstitution without affecting monocyte infiltration and improved its efficacy. Our results reveal that the developmental origin of TAMs dictates their relative distribution, function, and response to cancer therapies in lung tumors.

Overview

The claims and statistics of this paper haven’t been checked yet.

Run the check — free, no account needed. It reads the open-access text and checks the sources it cites.

A few free checks a day · papers already verified open instantly · results are public

Integrity signals

Registry

Crossref · 10.1084/jem.20180534

Cites

9 of 9 references verified0 citation errors · 0 not checkable

Statistics

Figures

Graphical abstract
Graphical abstract CC BY-NC-SA · PubMed Central
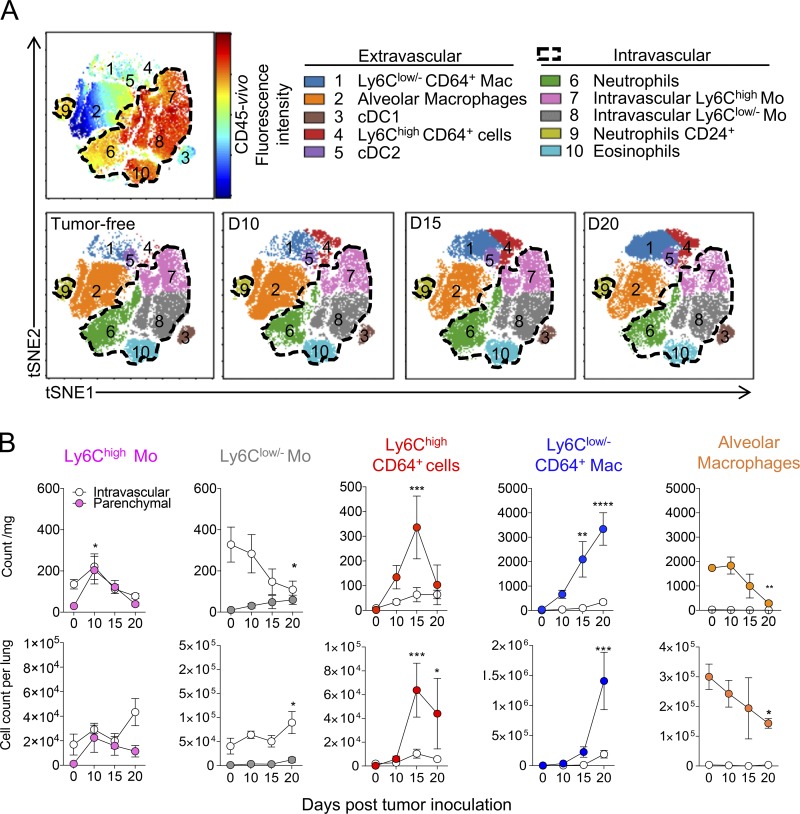
Figure 1. Lung macrophage subsets differentially accumulate during tumor development. (A) Representative tSNE dimension 1 and 2 plots of the lung myeloid compartment evolution after TC-1 cell intravenous inoculation. Upper panel delineates cell blood/tissue partitioning (dashed gates). Color clusters are represented over time (lower panels). (B) Blood/tissue partitioning monitoring of lung monocytes and macrophages during tumor growth. Dots represent mean of the absolute number ± SEM/milligram of tissue (upper panels) or absolute number per whole lung (lower panels). Statistical differences are indicated compared with D0. For all panels, n = 6–8 mice per time point out of three independent experiments, two-way ANOVA with Bonferroni multiple comparisons test was performed. *, P < 0.05; **, P < 0.01; ***, P < 0.001; ****, P < 0.0001). See also Figs. S1.
Figure 1. Lung macrophage subsets differentially accumulate during tumor development. (A) Representative tSNE dimension 1 and 2 plots of the lung myeloid compartment evolution after TC-1 cell intravenous inoculation. Upper panel delineates cell blood/tissue partitioning (dashed gates). Color clusters are represented over time (lower panels). (B) Blood/tissue partitioning monitoring of lung monocytes and macrophages during tumor growth. Dots represent mean of the absolute number ± SEM/milligram of tissue (upper panels) or absolute number per whole lung (lower panels). Statistical differences are indicated compared with D0. For all panels, n = 6–8 mice per time point out of three independent experiments, two-way ANOVA with Bonferroni multiple comparisons test was performed. *, P < 0.05; **, P < 0.01; ***, P < 0.001; ****, P < 0.0001). See also Figs. S1.CC BY-NC-SA · PubMed Central
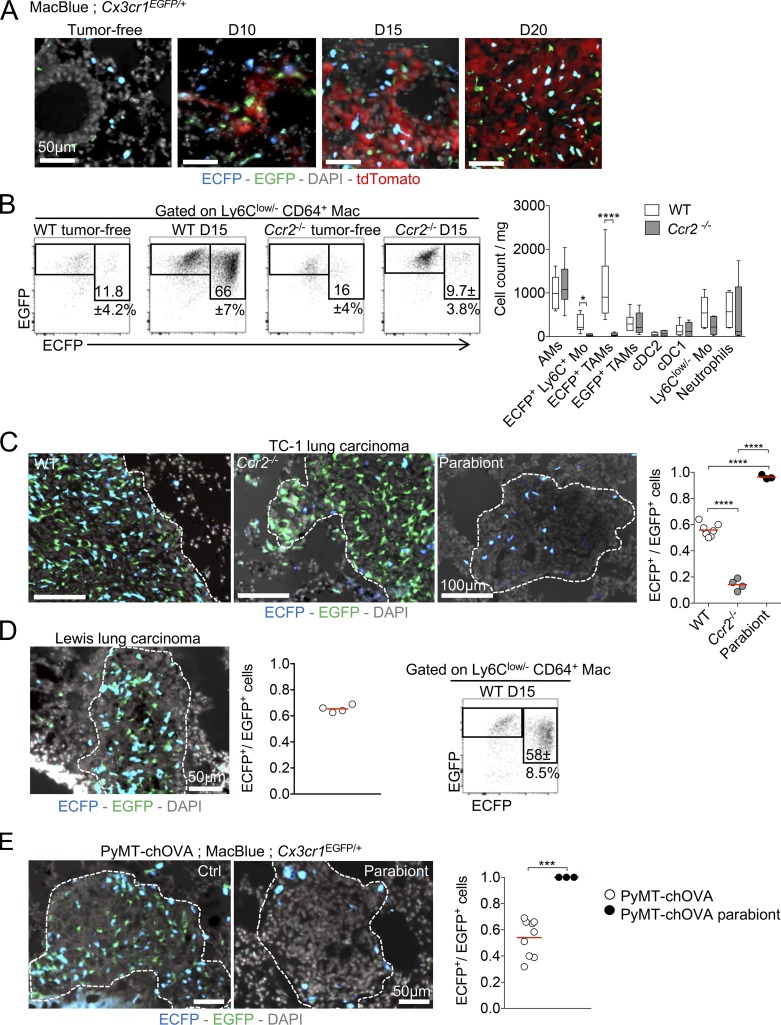
Figure 2. Macrophages have distinct origins within lung tumors. (A) Lung cryo-sections of tumor free and TC-1tdTomato tumor bearing MacBlue × Cx3cr1EGFP/+ mice show the distribution of ECFP+ and EGFP+ cells within tumor nodules over time. (B) Dot plots show the relative proportion of macrophage subsets in tumor-free, tumor-bearing MacBlue × Cx3cr1EGFP/+ (WT) and MacBlue × Cx3cr1EGFP/+ × Ccr2−/− (Ccr2−/−) mice at indicated time points, numbers indicate the mean percentage ± SD of ECFP+EGFP+ TAMs (left panel). Box and whisker graph shows the absolute number per milligram of tissue of indicated myeloid subsets in WT and Ccr2−/− mice (right panel; n = 10 mice out of three independent experiments, two-way ANOVA with Bonferroni multiple comparisons test was performed). (C) Lung cryo-sections show the distribution of ECFP+ and EGFP+ cells in TC-1 tumor-bearing MacBlue × Cx3cr1EGFP/+ (WT), MacBlue × Cx3cr1EGFP/+ × Ccr2−/− (Ccr2−/−) mice and C57Bl6 host parabiont with MacBlue × Cx3cr1EGFP/+ mice (left panels). Ratio of ECFP+/EGFP+ cell numbers in lung tumors. Each dot represents mean of ECFP+/EGFP+ cell ratio from different tumor nodules per mouse, red bars indicate mean, mice are pooled from at least two independent experiments (right panel). (D) Lung cryo-sections show the distribution of ECFP+ and EGFP+ cells in LLC tumor bearing MacBlue × Cx3cr1EGFP/+ mouse (day 15; left panel), and ratio of ECFP+/EGFP+ cells in LLC tumors (middle panel). Each dot represents mean of ECFP+/EGFP+ cell ratio from different tumor nodules per mouse, red bar indicates mean, mice are pooled from two independent experiments. Dot plot show the relative proportion of macrophages subsets in LLC tumor bearing MacBlue × Cx3cr1EGFP/+ mice at the indicated time point; numbers indicated the mean percentage ± SD of ECFP+EGFP+ TAMs (right panel; n = 4 mice out of two independent experiments). (E) Lung cryo-section shows the distribution of ECFP+ and EGFP+ cells in spontaneous pulmonary metastases from MacBlue × Cx3cr1EGFP/+ × PyMT-ChOVA mouse (left panel). Middle panel shows the lack of EGFP+ cells in pulmonary metastases from C57Bl6 PyMT-ChOVA host parabiont. Right panel shows the quantification based on histological analyses. Each dot represents mean of ECFP+/EGFP+ cell ratio from different tumor nodules per mouse, red bar indicates mean, all mice are independents. ANOVA with Bonferroni multiple comparisons test were performed for panel B and C and unpaired Student's t test was performed for panel E. For all panels: *, P < 0.05; ***, P < 0.001; ****, P < 0.0001. See also Fig. S2.
Figure 2. Macrophages have distinct origins within lung tumors. (A) Lung cryo-sections of tumor free and TC-1tdTomato tumor bearing MacBlue × Cx3cr1EGFP/+ mice show the distribution of ECFP+ and EGFP+ cells within tumor nodules over time. (B) Dot plots show the relative proportion of macrophage subsets in tumor-free, tumor-bearing MacBlue × Cx3cr1EGFP/+ (WT) and MacBlue × Cx3cr1EGFP/+ × Ccr2−/− (Ccr2−/−) mice at indicated time points, numbers indicate the mean percentage ± SD of ECFP+EGFP+ TAMs (left panel). Box and whisker graph shows the absolute number per milligram of tissue of indicated myeloid subsets in WT and Ccr2−/− mice (right panel; n = 10 mice out of three independent experiments, two-way ANOVA with Bonferroni multiple comparisons test was performed). (C) Lung cryo-sections show the distribution of ECFP+ and EGFP+ cells in TC-1 tumor-bearing MacBlue × Cx3cr1EGFP/+ (WT), MacBlue × Cx3cr1EGFP/+ × Ccr2−/− (Ccr2−/−) mice and C57Bl6 host parabiont with MacBlue × Cx3cr1EGFP/+ mice (left panels). Ratio of ECFP+/EGFP+ cell numbers in lung tumors. Each dot represents mean of ECFP+/EGFP+ cell ratio from different tumor nodules per mouse, red bars indicate mean, mice are pooled from at least two independent experiments (right panel). (D) Lung cryo-sections show the distribution of ECFP+ and EGFP+ cells in LLC tumor bearing MacBlue × Cx3cr1EGFP/+ mouse (day 15; left panel), and ratio of ECFP+/EGFP+ cells in LLC tumors (middle panel). Each dot represents mean of ECFP+/EGFP+ cell ratio from different tumor nodules per mouse, red bar indicates mean, mice are pooled from two independent experiments. Dot plot show the relative proportion of macrophages subsets in LLC tumor bearing MacBlue × Cx3cr1EGFP/+ mice at the indicated time point; numbers indicated the mean percentage ± SD of ECFP+EGFP+ TAMs (right panel; n = 4 mice out of two independent experiments). (E) Lung cryo-section shows the distribution of ECFP+ and EGFP+ cells in spontaneous pulmonary metastases from MacBlue × Cx3cr1EGFP/+ × PyMT-ChOVA mouse (left panel). Middle panel shows the lack of EGFP+ cells in pulmonary metastases from C57Bl6 PyMT-ChOVA host parabiont. Right panel shows the quantification based on histological analyses. Each dot represents mean of ECFP+/EGFP+ cell ratio from different tumor nodules per mouse, red bar indicates mean, all mice are independents. ANOVA with Bonferroni multiple comparisons test were performed for panel B and C and unpaired Student's t test was performed for panel E. For all panels: *, P < 0.05; ***, P < 0.001; ****, P < 0.0001. See also Fig. S2.CC BY-NC-SA · PubMed Central
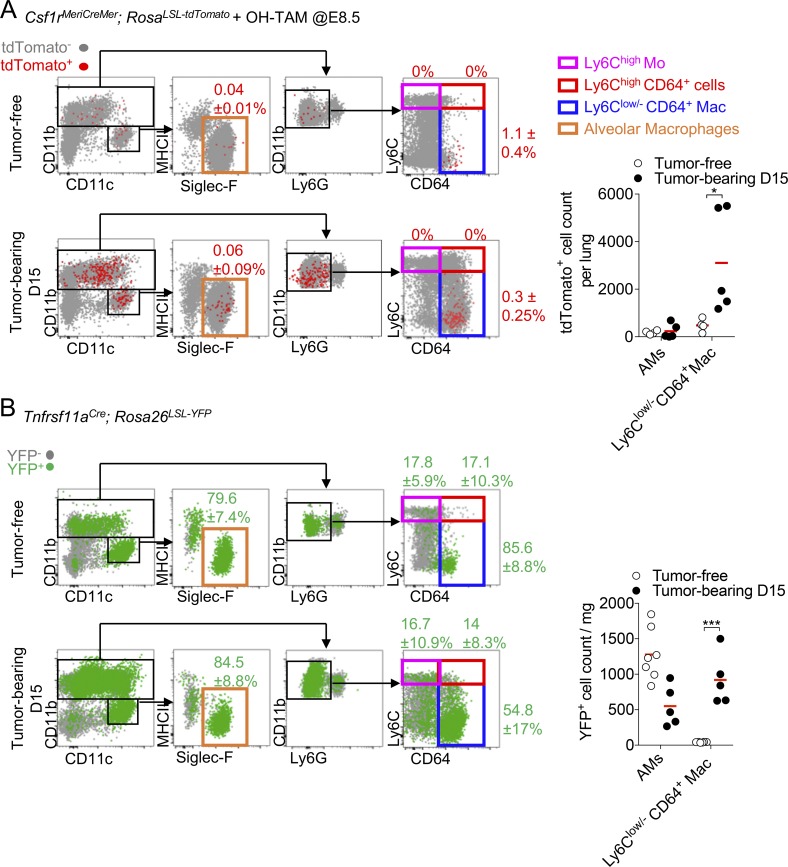
Figure 3. Lung IMs are of embryonic origin and accumulate within tumors. (A) Dot plots show tdTomato+ myeloid cell subsets in Csf1rMeriCreMer; RosaLSL-tdTomato after OH-TAM pulse at E8.5 in adult tumor-free mice and 15 d after TC-1 inoculation (left panels). Mean percentage ± SD of tdTomato+ cells among each subset is indicated. Right panel shows the numbers per milligram of tissue of the tdTomato+ AMs and Ly6Clow/- CD64+ Mac. Bars represent mean of four mice per group out of two independent experiments. Two-way ANOVA with Bonferroni multiple comparisons test was performed. (B) Dot plots show YFP+ macrophage subsets in Tnfrsf11aCre; Rosa26LSL-YFP mice. Mean percentage ± SD of YFP+ cells among each subset is indicated (left panels). Right panel shows the absolute number per milligram of YFP+ AMs and Ly6Clow/- CD64+ Mac. Bars represent mean of four mice per group out of two independent experiments. Two-way ANOVA with Bonferroni multiple comparisons test was performed. For all panels: *, P < 0.05; ***, P < 0.001.
Figure 3. Lung IMs are of embryonic origin and accumulate within tumors. (A) Dot plots show tdTomato+ myeloid cell subsets in Csf1rMeriCreMer; RosaLSL-tdTomato after OH-TAM pulse at E8.5 in adult tumor-free mice and 15 d after TC-1 inoculation (left panels). Mean percentage ± SD of tdTomato+ cells among each subset is indicated. Right panel shows the numbers per milligram of tissue of the tdTomato+ AMs and Ly6Clow/- CD64+ Mac. Bars represent mean of four mice per group out of two independent experiments. Two-way ANOVA with Bonferroni multiple comparisons test was performed. (B) Dot plots show YFP+ macrophage subsets in Tnfrsf11aCre; Rosa26LSL-YFP mice. Mean percentage ± SD of YFP+ cells among each subset is indicated (left panels). Right panel shows the absolute number per milligram of YFP+ AMs and Ly6Clow/- CD64+ Mac. Bars represent mean of four mice per group out of two independent experiments. Two-way ANOVA with Bonferroni multiple comparisons test was performed. For all panels: *, P < 0.05; ***, P < 0.001.CC BY-NC-SA · PubMed Central
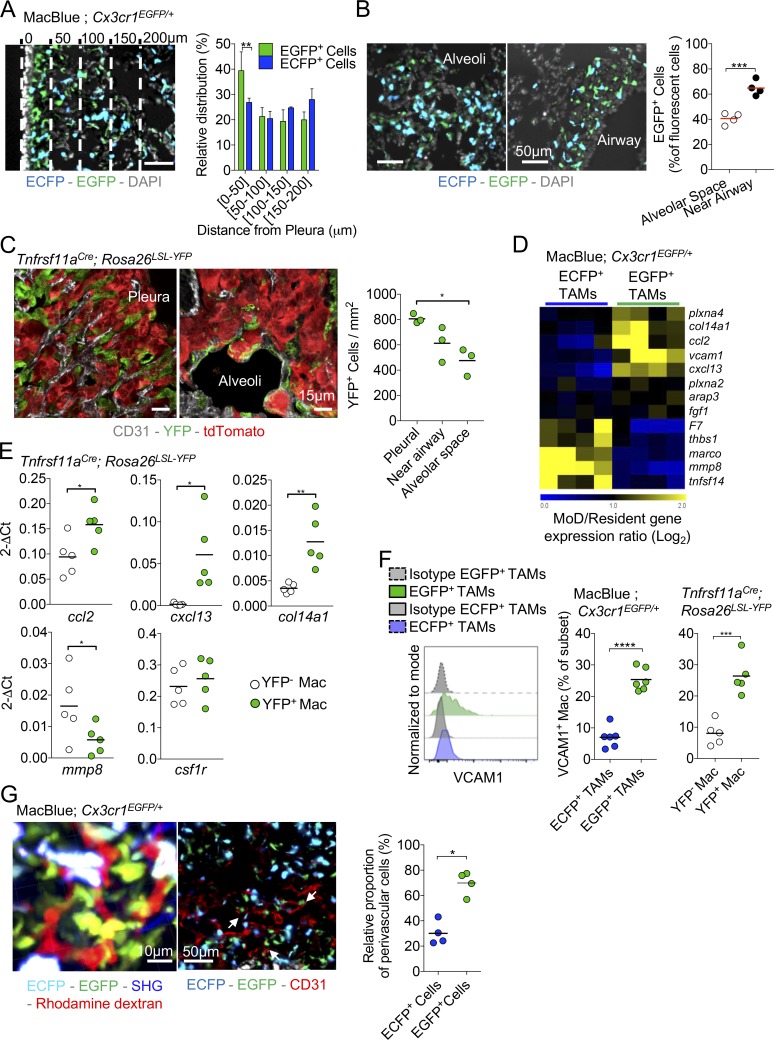
Figure 4. Resident and MoD-TAMs harbor distinct phenotypes and anatomical distribution. (A) Lung cryo-section shows the distribution of ECFP+ and EGFP+ cells in TC-1 pulmonary tumor nodule located in the vicinity of the pleura. Bar, 50 µm. Dashed lines represent each 50-µm interval, starting from the pleura. Graph represents the relative distribution of EGFP+ cells and ECFP+ MoD cells as a function of the distance from the surface (pleura; bars represent means ± SD of four mice out of two independent experiments; two-way ANOVA was performed). (B) Lung cryo-sections show the distribution of ECFP+ and EGFP+ cells in pulmonary tumor nodules located in the alveolar space or near large airways, 15 d after TC-1 inoculation. Graph represents the percentage of EGFP+ cells among fluorescent cells in each sub-anatomical compartment (dots represent the mean ratio per mouse, mice are pooled from two independent experiments, and red bars indicate mean. Unpaired Student’s t test was performed). (C) Lung cryo-sections of Tnfrsf11aCre; Rosa26LSL-YFP mice shows YFP+ cells in pulmonary tumor nodules located in the pleura or in the alveolar space 15 d after tdTomato+ TC-1 inoculation. Graph represents the number of YFP+ cells in each sub-anatomical compartment (dots represent the mean ratio per mouse, mice are pooled from two independent experiments, and bars indicate means; one-way ANOVA was performed). (D) Heat map shows a selection of transcripts involved in extracellular matrix interaction and remodeling, differentially expressed between EGFP+ and ECFP+-TAMs. (E) Expression of indicated genes, relative to GAPDH (2-ΔCt), as determined by qPCR of FACS-sorted YFP+ and YFP− TAMs in Tnfrsf11aCre; Rosa26LSL-YFP mice. Each dot represents one mouse, pooled from two independent experiments. (F) Representative histogram shows VCAM expression gated on TAM subsets from MacBlue × Cx3cr1EGFP/+ mice (left panel). Middle panel shows the quantification of VCAM1 expression by EGFP+- and ECFP+-TAMs in MacBlue × Cx3cr1EGFP/+. Right panel represents the quantification of VCAM1 expression by YFP+ and YFP− macrophages in Tnfrsf11aCre; Rosa26LSL-YFP mice. Mice are pooled from three independent experiments, bars indicate means; unpaired Student’s t test was performed. (G) TPLSM 3D reconstruction shows the perivascular location of the EGFP+ cell network within a tumor nodule (left panel). Lung cryo-section from TC-1 tumor-bearing MacBlue × Cx3cr1EGFP/+ at day 15 shows fluorescent subset distribution regarding tumor vasculature using CD31 staining (middle panel). Close interactions of EGFP+ cells with the vasculature are indicated (white arrows). Scatter plot represents the relative proportion of perivascular EGFP+ cells and ECFP+ cells in tumor nodules (right panel; dots represent the mean proportion per mouse pooled from at least two independent experiments; bars indicate means; unpaired Student’s t test was performed). For all panels: *, P < 0.05; **, P < 0.01; ***, P < 0.001; ****, P < 0.0001. See also Fig. S3 and Videos 1 and 2.
Figure 4. Resident and MoD-TAMs harbor distinct phenotypes and anatomical distribution. (A) Lung cryo-section shows the distribution of ECFP+ and EGFP+ cells in TC-1 pulmonary tumor nodule located in the vicinity of the pleura. Bar, 50 µm. Dashed lines represent each 50-µm interval, starting from the pleura. Graph represents the relative distribution of EGFP+ cells and ECFP+ MoD cells as a function of the distance from the surface (pleura; bars represent means ± SD of four mice out of two independent experiments; two-way ANOVA was performed). (B) Lung cryo-sections show the distribution of ECFP+ and EGFP+ cells in pulmonary tumor nodules located in the alveolar space or near large airways, 15 d after TC-1 inoculation. Graph represents the percentage of EGFP+ cells among fluorescent cells in each sub-anatomical compartment (dots represent the mean ratio per mouse, mice are pooled from two independent experiments, and red bars indicate mean. Unpaired Student’s t test was performed). (C) Lung cryo-sections of Tnfrsf11aCre; Rosa26LSL-YFP mice shows YFP+ cells in pulmonary tumor nodules located in the pleura or in the alveolar space 15 d after tdTomato+ TC-1 inoculation. Graph represents the number of YFP+ cells in each sub-anatomical compartment (dots represent the mean ratio per mouse, mice are pooled from two independent experiments, and bars indicate means; one-way ANOVA was performed). (D) Heat map shows a selection of transcripts involved in extracellular matrix interaction and remodeling, differentially expressed between EGFP+ and ECFP+-TAMs. (E) Expression of indicated genes, relative to GAPDH (2-ΔCt), as determined by qPCR of FACS-sorted YFP+ and YFP− TAMs in Tnfrsf11aCre; Rosa26LSL-YFP mice. Each dot represents one mouse, pooled from two independent experiments. (F) Representative histogram shows VCAM expression gated on TAM subsets from MacBlue × Cx3cr1EGFP/+ mice (left panel). Middle panel shows the quantification of VCAM1 expression by EGFP+- and ECFP+-TAMs in MacBlue × Cx3cr1EGFP/+. Right panel represents the quantification of VCAM1 expression by YFP+ and YFP− macrophages in Tnfrsf11aCre; Rosa26LSL-YFP mice. Mice are pooled from three independent experiments, bars indicate means; unpaired Student’s t test was performed. (G) TPLSM 3D reconstruction shows the perivascular location of the EGFP+ cell network within a tumor nodule (left panel). Lung cryo-section from TC-1 tumor-bearing MacBlue × Cx3cr1EGFP/+ at day 15 shows fluorescent subset distribution regarding tumor vasculature using CD31 staining (middle panel). Close interactions of EGFP+ cells with the vasculature are indicated (white arrows). Scatter plot represents the relative proportion of perivascular EGFP+ cells and ECFP+ cells in tumor nodules (right panel; dots represent the mean proportion per mouse pooled from at least two independent experiments; bars indicate means; unpaired Student’s t test was performed). For all panels: *, P < 0.05; **, P < 0.01; ***, P < 0.001; ****, P < 0.0001. See also Fig. S3 and Videos 1 and 2.CC BY-NC-SA · PubMed Central
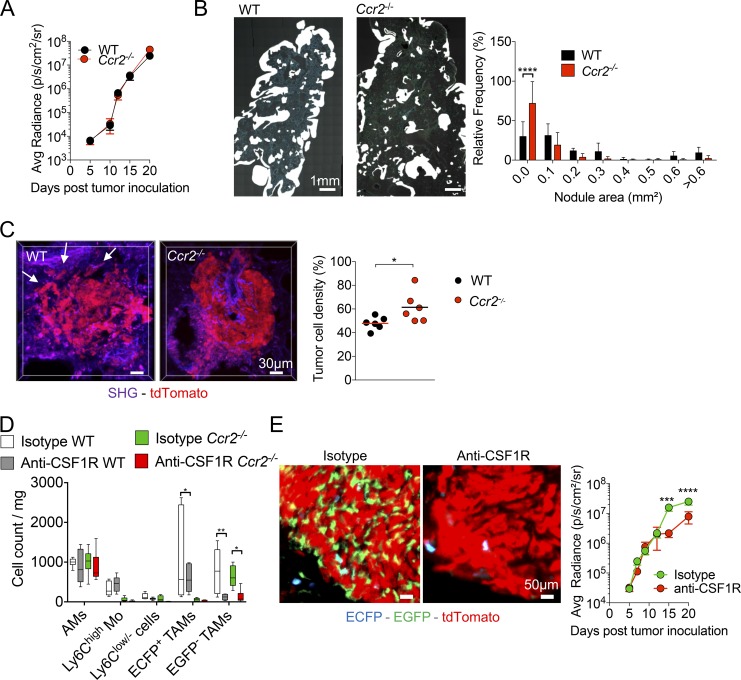
Figure 5. Resident TAMs support tumor cell growth, and MoD cells are associated with tumor spreading in the lung. (A) Tumor growth was monitored in WT and Ccr2−/− mice by bioluminescence imaging (graph represents mean ± SEM of n = 10 mice per group from two independent experiments). (B) Wide field images of a whole lung cryo-section 15 d after TC-1 inoculation in WT and Ccr2−/− mice (left panels). White mask indicates nodule size and distribution. Graph shows the relative distribution of nodule areas (right panel; n = 5–7 mice in each group out of three independent experiments; two-way ANOVA comparing WT and Ccr2−/− frequency of each distribution was performed). (C) TPLSM 3D reconstructions show tumor cell density in a representative nodule from TC-1tdTomato tumor-bearing WT and Ccr2−/− mice; white arrows indicate spread tumor cells (left panels). Tumor cell density was measured using 3D reconstruction images of tdTomato+ tumor nodule (dots represent the mean of at least four different tumor nodules per mouse, pooled from two independent experiments; bars indicate means; unpaired Student’s t test was performed). (D) Box and whisker graph represents numbers per milligram of lung of each indicated myeloid subset after indicated treatment at day 15. Tumor-bearing WT and Ccr2−/− mice were treated every 2 d with anti-CSF1R between days 5 and 14 (right panel; n = 6 mice from two independent experiments. One-way ANOVA comparing each subset individually for each condition was performed). (E) Lung cryo-sections of TC-1tdTomato tumor-bearing MacBlue × Cx3cr1EGFP/+ × Ccr2−/− mice treated with anti-CSF1R or isotype control show depletion of EGFP+ cells at day 15 (left panels). Tumor burden was monitored by bioluminescence imaging after TC-1-Luc inoculation (right panel). Mice were treated every 2 d with anti-CSF1R starting day 5 (graphs represent mean ± SEM, n = 10 mice per group out of two independent experiments. Two-way ANOVA with Bonferroni multiple comparisons test was performed). For all panels: *, P < 0.05; **, P < 0.01; ***, P < 0.001; ****, P < 0.0001.
Figure 5. Resident TAMs support tumor cell growth, and MoD cells are associated with tumor spreading in the lung. (A) Tumor growth was monitored in WT and Ccr2−/− mice by bioluminescence imaging (graph represents mean ± SEM of n = 10 mice per group from two independent experiments). (B) Wide field images of a whole lung cryo-section 15 d after TC-1 inoculation in WT and Ccr2−/− mice (left panels). White mask indicates nodule size and distribution. Graph shows the relative distribution of nodule areas (right panel; n = 5–7 mice in each group out of three independent experiments; two-way ANOVA comparing WT and Ccr2−/− frequency of each distribution was performed). (C) TPLSM 3D reconstructions show tumor cell density in a representative nodule from TC-1tdTomato tumor-bearing WT and Ccr2−/− mice; white arrows indicate spread tumor cells (left panels). Tumor cell density was measured using 3D reconstruction images of tdTomato+ tumor nodule (dots represent the mean of at least four different tumor nodules per mouse, pooled from two independent experiments; bars indicate means; unpaired Student’s t test was performed). (D) Box and whisker graph represents numbers per milligram of lung of each indicated myeloid subset after indicated treatment at day 15. Tumor-bearing WT and Ccr2−/− mice were treated every 2 d with anti-CSF1R between days 5 and 14 (right panel; n = 6 mice from two independent experiments. One-way ANOVA comparing each subset individually for each condition was performed). (E) Lung cryo-sections of TC-1tdTomato tumor-bearing MacBlue × Cx3cr1EGFP/+ × Ccr2−/− mice treated with anti-CSF1R or isotype control show depletion of EGFP+ cells at day 15 (left panels). Tumor burden was monitored by bioluminescence imaging after TC-1-Luc inoculation (right panel). Mice were treated every 2 d with anti-CSF1R starting day 5 (graphs represent mean ± SEM, n = 10 mice per group out of two independent experiments. Two-way ANOVA with Bonferroni multiple comparisons test was performed). For all panels: *, P < 0.05; **, P < 0.01; ***, P < 0.001; ****, P < 0.0001.CC BY-NC-SA · PubMed Central
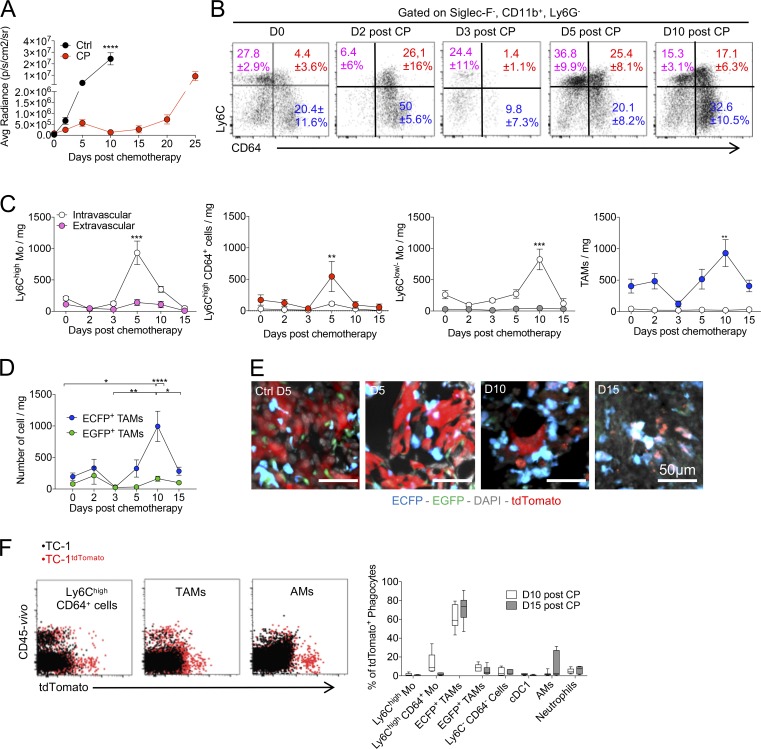
Figure 6. Distinct sensitivity and recovery of Res-TAMs and MoD-TAMs after chemotherapy. (A) Impact of CP treatment on tumor growth was monitored by bioluminescence imaging (graph represents mean ± SEM of n = 10 mice per group out of three independent experiments). (B) Dot plots show Ly6C and CD64 expressions of Siglec-F−CD11b+Ly6G− lung cells over time after CP treatment. Mean percentage ± SD of cells in each quadrant are indicated. (C) Blood/tissue partitioning monitoring of lung monocytes and macrophages during tumor growth after chemotherapy (graphs represent mean of the absolute number ± SEM/milligram of tissue, n = 6–10 mice per time point out of two to four independent experiments, two-way ANOVA with Bonferroni multiple comparisons test was performed. Only statistical differences compared with day of treatment [day 0] are indicated for each compartment). (D) Graph shows the absolute number per milligram of tissue of ECFP+-TAMs and EGFP+-TAMs from MacBlue × Cx3cr1EGFP/+ mice after CP (n = 4–10 mice per time point out of three independent experiments, two-way ANOVA with Bonferroni multiple comparisons test was performed). (E) Lung cryo-sections of TC-1tdTomato tumor-bearing MacBlue × Cx3cr1EGFP/+ mice show TAM subset distribution within tumor nodules following CP treatment. (F) Dot plots show TC-1tdTomato phagocytosis by the indicated mononuclear phagocyte subsets (red). Fluorescent background from nonfluorescent TC-1 tumor is overlaid (left panels; black). Box and whisker graphs show the relative proportion of phagocytic cells among indicated subsets at 10 and 15 d after CP treatment (right panels; n = 9 mice out of three independent experiments). For all panels: *, P < 0.05; **, P < 0.01; ***, P < 0.001; ****, P < 0.0001. See also Fig. S4.
Figure 6. Distinct sensitivity and recovery of Res-TAMs and MoD-TAMs after chemotherapy. (A) Impact of CP treatment on tumor growth was monitored by bioluminescence imaging (graph represents mean ± SEM of n = 10 mice per group out of three independent experiments). (B) Dot plots show Ly6C and CD64 expressions of Siglec-F−CD11b+Ly6G− lung cells over time after CP treatment. Mean percentage ± SD of cells in each quadrant are indicated. (C) Blood/tissue partitioning monitoring of lung monocytes and macrophages during tumor growth after chemotherapy (graphs represent mean of the absolute number ± SEM/milligram of tissue, n = 6–10 mice per time point out of two to four independent experiments, two-way ANOVA with Bonferroni multiple comparisons test was performed. Only statistical differences compared with day of treatment [day 0] are indicated for each compartment). (D) Graph shows the absolute number per milligram of tissue of ECFP+-TAMs and EGFP+-TAMs from MacBlue × Cx3cr1EGFP/+ mice after CP (n = 4–10 mice per time point out of three independent experiments, two-way ANOVA with Bonferroni multiple comparisons test was performed). (E) Lung cryo-sections of TC-1tdTomato tumor-bearing MacBlue × Cx3cr1EGFP/+ mice show TAM subset distribution within tumor nodules following CP treatment. (F) Dot plots show TC-1tdTomato phagocytosis by the indicated mononuclear phagocyte subsets (red). Fluorescent background from nonfluorescent TC-1 tumor is overlaid (left panels; black). Box and whisker graphs show the relative proportion of phagocytic cells among indicated subsets at 10 and 15 d after CP treatment (right panels; n = 9 mice out of three independent experiments). For all panels: *, P < 0.05; **, P < 0.01; ***, P < 0.001; ****, P < 0.0001. See also Fig. S4.CC BY-NC-SA · PubMed Central
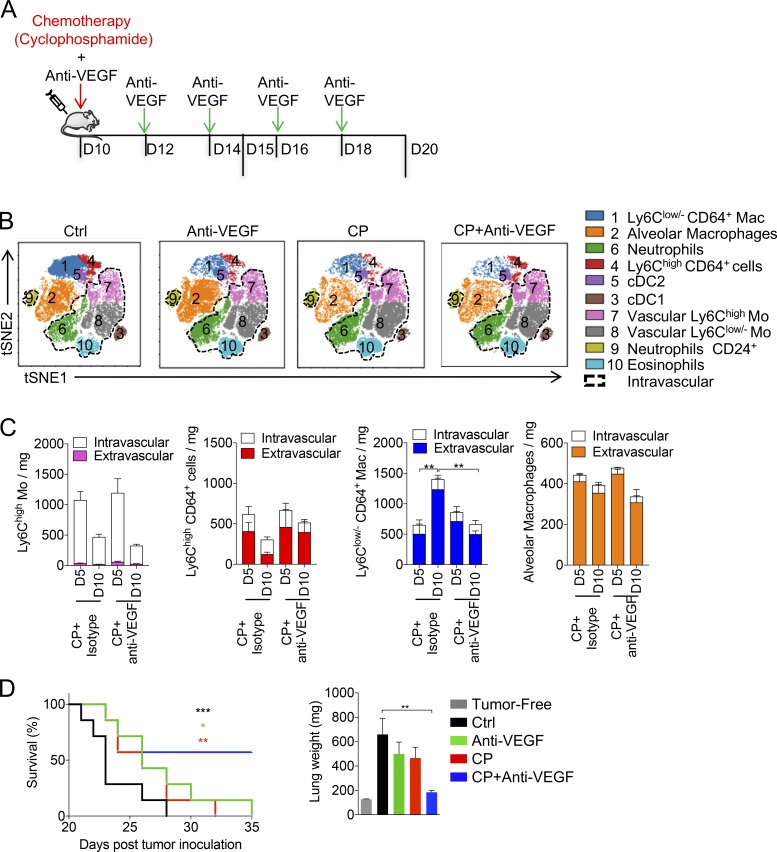
Figure 7. Anti-VEGF combination with CP reduces TAM recovery and enhances chemotherapy efficacy. (A) Tumor-bearing mice were treated with CP 10 d after tumor inoculation and treated or not every 2 d with anti-VEGF. (B) Representative tSNE dimension 1 and 2 plots show the impact of the different therapies on the myeloid signature at day 15. Cell subsets are color grouped, and dashed black gates delineate blood/tissue partitioning. (C) Blood/tissue partitioning monitoring of lung monocytes and macrophages during tumor growth at days 15 and 20 after CP or CP + anti-VEGF. (Bars represent mean of the total number of cell ± SEM. For all panels n = 6 mice per time point out of two independent experiments; two-way ANOVA with Bonferoni multiple comparisons test was performed.) (D) Survival curve shows the efficacy of combined therapy started from day 20 (n = 7 mice per group, data are representative of two experiments; log-rank [Mantel-Cox] test was performed to compare each survival curve with the one of CP + anti-VEGF). Corresponding lung weights are reported (one-way ANOVA with Bonferroni multiple comparisons test was performed). For all panels: *, P < 0.05; **, P < 0.01; ***, P < 0.001.
Figure 7. Anti-VEGF combination with CP reduces TAM recovery and enhances chemotherapy efficacy. (A) Tumor-bearing mice were treated with CP 10 d after tumor inoculation and treated or not every 2 d with anti-VEGF. (B) Representative tSNE dimension 1 and 2 plots show the impact of the different therapies on the myeloid signature at day 15. Cell subsets are color grouped, and dashed black gates delineate blood/tissue partitioning. (C) Blood/tissue partitioning monitoring of lung monocytes and macrophages during tumor growth at days 15 and 20 after CP or CP + anti-VEGF. (Bars represent mean of the total number of cell ± SEM. For all panels n = 6 mice per time point out of two independent experiments; two-way ANOVA with Bonferoni multiple comparisons test was performed.) (D) Survival curve shows the efficacy of combined therapy started from day 20 (n = 7 mice per group, data are representative of two experiments; log-rank [Mantel-Cox] test was performed to compare each survival curve with the one of CP + anti-VEGF). Corresponding lung weights are reported (one-way ANOVA with Bonferroni multiple comparisons test was performed). For all panels: *, P < 0.05; **, P < 0.01; ***, P < 0.001.CC BY-NC-SA · PubMed Central
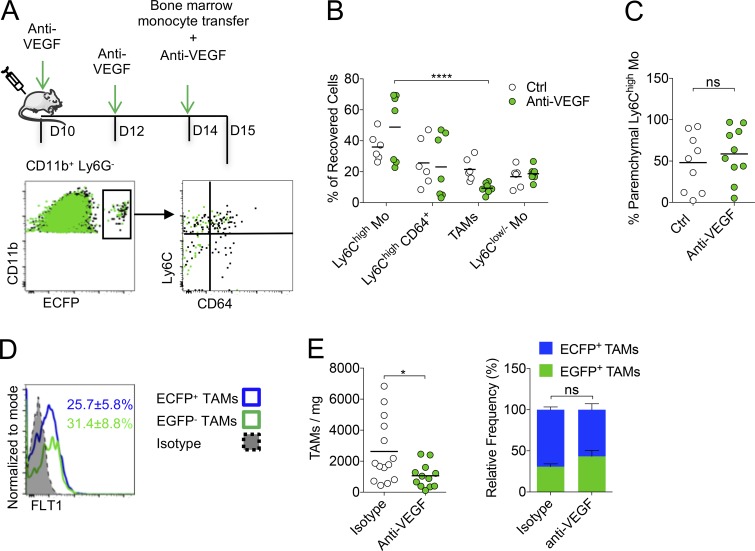
Figure 8. Anti-VEGF targets Res-TAM and MoD-TAM accumulation. (A) Bone marrow monocytes from MacBlue mice were adoptively transferred in tumor-bearing WT mice treated or not with anti-VEGF (upper panel). Representative overlay dot plots show the phenotype of recovered MoD cells from tumor-bearing mice treated (green) or not with anti-VEGF (black) 24 h after transfer (lower panels). (B) Graph shows the relative proportion of recovered cells in each mouse pooled from two independent experiments (black bars indicate means; two-way ANOVA with Bonferroni multiple comparisons test was performed). (C) Graph shows the proportion of Ly6Chigh-Mo infiltration evaluated by blood/tissue partitioning in each mouse pooled from two independent experiments (black bars indicate means; Student’s t test was performed). (D) Representative histogram plot of FTL1 expression by ECFP+ and ECFP+-TAMs, mean percentage ± SD of FLT1+ cell in each subset out of six mice from two independent experiments are indicated. (E) Left panel shows the number of TAMs/milligram in indicated conditions. Right panel shows the relative proportion of TAMs in mice treated with anti-VEGF or isotype. Black bars indicate means of two independent experiments, Student’s t test was performed. For all panels: *, P < 0.05; ****, P < 0.0001; ns, not significant. See also Fig. S5.
Figure 8. Anti-VEGF targets Res-TAM and MoD-TAM accumulation. (A) Bone marrow monocytes from MacBlue mice were adoptively transferred in tumor-bearing WT mice treated or not with anti-VEGF (upper panel). Representative overlay dot plots show the phenotype of recovered MoD cells from tumor-bearing mice treated (green) or not with anti-VEGF (black) 24 h after transfer (lower panels). (B) Graph shows the relative proportion of recovered cells in each mouse pooled from two independent experiments (black bars indicate means; two-way ANOVA with Bonferroni multiple comparisons test was performed). (C) Graph shows the proportion of Ly6Chigh-Mo infiltration evaluated by blood/tissue partitioning in each mouse pooled from two independent experiments (black bars indicate means; Student’s t test was performed). (D) Representative histogram plot of FTL1 expression by ECFP+ and ECFP+-TAMs, mean percentage ± SD of FLT1+ cell in each subset out of six mice from two independent experiments are indicated. (E) Left panel shows the number of TAMs/milligram in indicated conditions. Right panel shows the relative proportion of TAMs in mice treated with anti-VEGF or isotype. Black bars indicate means of two independent experiments, Student’s t test was performed. For all panels: *, P < 0.05; ****, P < 0.0001; ns, not significant. See also Fig. S5.CC BY-NC-SA · PubMed Central

Verification

Claims the paper makes

The claims and statistics of this paper haven’t been checked yet.

Run the check — free, no account needed. It reads the open-access text and checks the sources it cites.

A few free checks a day · papers already verified open instantly · results are public

Claims other papers make about this one

Each is checked against this paper’s own text: does it say what the citing paper says it does?

Self-check

Percentages, sums and reported differences re-computed from the paper’s own numbers.

The self-check needs the paper’s full text.

Citations

Cites

Show all 9 references

Research works printed but not linked: 48

  1. Barleon, 1996, Migration of human monocytes in response to vascular endothelial growth factor (VEGF) is mediated via the VEGF receptor flt-1, Blood., 87, 3336, 10.1182/blood.V87.8.3336.bloodjournal8783336 · DOI
  2. Boissonnas, 2013, CD8+ tumor-infiltrating T cells are trapped in the tumor-dendritic cell network, Neoplasia., 15, 85, 10.1593/neo.121572 · DOI
  3. Bowman, 2016, Macrophage Ontogeny Underlies Differences in Tumor-Specific Education in Brain Malignancies, Cell Reports., 17, 2445, 10.1016/j.celrep.2016.10.052 · DOI
  4. Broz, 2014, Dissecting the tumor myeloid compartment reveals rare activating antigen-presenting cells critical for T cell immunity, Cancer Cell., 26, 638, 10.1016/j.ccell.2014.09.007 · DOI · Paper page
  5. Chen, 2014, Cytobank: providing an analytics platform for community cytometry data analysis and collaboration, Curr. Top. Microbiol. Immunol., 377, 127
  6. Cohen, 2007, FDA drug approval summary: bevacizumab (Avastin) plus Carboplatin and Paclitaxel as first-line treatment of advanced/metastatic recurrent nonsquamous non-small cell lung cancer, Oncologist., 12, 713, 10.1634/theoncologist.12-6-713 · DOI
  7. Cortez-Retamozo, 2012, Origins of tumor-associated macrophages and neutrophils, Proc. Natl. Acad. Sci. USA., 109, 2491, 10.1073/pnas.1113744109 · DOI
  8. Dellapasqua, 2008, Metronomic cyclophosphamide and capecitabine combined with bevacizumab in advanced breast cancer, J. Clin. Oncol., 26, 4899, 10.1200/JCO.2008.17.4789 · DOI
  9. Doherty, 2011, The tumor necrosis factor family member LIGHT is a target for asthmatic airway remodeling, Nat. Med., 17, 596, 10.1038/nm.2356 · DOI
  10. Engelhardt, 2012, Marginating dendritic cells of the tumor microenvironment cross-present tumor antigens and stably engage tumor-specific T cells, Cancer Cell., 21, 402, 10.1016/j.ccr.2012.01.008 · DOI
  11. Franklin, 2014, The cellular and molecular origin of tumor-associated macrophages, Science., 344, 921, 10.1126/science.1252510 · DOI
  12. Gambardella, 2010, PI3K signaling through the dual GTPase-activating protein ARAP3 is essential for developmental angiogenesis, Sci. Signal., 3, ra76, 10.1126/scisignal.2001026 · DOI
  13. Gibbings, 2017, Three Unique Interstitial Macrophages in the Murine Lung at Steady State, Am. J. Respir. Cell Mol. Biol., 57, 66, 10.1165/rcmb.2016-0361OC · DOI
  14. Gosselin, 2014, Environment drives selection and function of enhancers controlling tissue-specific macrophage identities, Cell., 159, 1327, 10.1016/j.cell.2014.11.023 · DOI · Paper page
  15. Grunewald, 2006, VEGF-induced adult neovascularization: recruitment, retention, and role of accessory cells, Cell., 124, 175, 10.1016/j.cell.2005.10.036 · DOI
  16. Guilliams, 2013, Alveolar macrophages develop from fetal monocytes that differentiate into long-lived cells in the first week of life via GM-CSF, J. Exp. Med., 210, 1977, 10.1084/jem.20131199 · DOI
  17. Hamon, 2017, CX3CR1-dependent endothelial margination modulates Ly6Chigh monocyte systemic deployment upon inflammation in mice, Blood., 129, 1296, 10.1182/blood-2016-08-732164 · DOI
  18. Hawley, 2018, Csf1r-mApple Transgene Expression and Ligand Binding In Vivo Reveal Dynamics of CSF1R Expression within the Mononuclear Phagocyte System, J. Immunol., 200, 2209, 10.4049/jimmunol.1701488 · DOI
  19. Hughes, 2015, Perivascular M2 Macrophages Stimulate Tumor Relapse after Chemotherapy, Cancer Res., 75, 3479, 10.1158/0008-5472.CAN-14-3587 · DOI
  20. Jacquelin, 2013, CX3CR1 reduces Ly6Chigh-monocyte motility within and release from the bone marrow after chemotherapy in mice, Blood., 122, 674, 10.1182/blood-2013-01-480749 · DOI
  21. Ji, 1998, Antigen-specific immunotherapy for murine lung metastatic tumors expressing human papillomavirus type 16 E7 oncoprotein, Int. J. Cancer., 78, 41, 10.1002/(SICI)1097-0215(19980925)78:1<41::AID-IJC8>3.0.CO;2-X · DOI
  22. Jung, 2000, Analysis of fractalkine receptor CX(3)CR1 function by targeted deletion and green fluorescent protein reporter gene insertion, Mol. Cell. Biol., 20, 4106, 10.1128/MCB.20.11.4106-4114.2000 · DOI · Paper page
  23. Kaplan, 2005, VEGFR1-positive haematopoietic bone marrow progenitors initiate the pre-metastatic niche, Nature., 438, 820, 10.1038/nature04186 · DOI · Paper page
  24. Kitamura, 2015, CCL2-induced chemokine cascade promotes breast cancer metastasis by enhancing retention of metastasis-associated macrophages, J. Exp. Med., 212, 1043, 10.1084/jem.20141836 · DOI
  25. Kitamura, 2018, Monocytes Differentiate to Immune Suppressive Precursors of Metastasis-Associated Macrophages in Mouse Models of Metastatic Breast Cancer, Front. Immunol., 8, 2004, 10.3389/fimmu.2017.02004 · DOI
  26. Lavin, 2014, Tissue-resident macrophage enhancer landscapes are shaped by the local microenvironment, Cell., 159, 1312, 10.1016/j.cell.2014.11.018 · DOI · Paper page
  27. Lewis, 2016, The Multifaceted Role of Perivascular Macrophages in Tumors, Cancer Cell., 30, 365, 10.1016/j.ccell.2016.07.009 · DOI
  28. Lin, 1996, Treatment of established tumors with a novel vaccine that enhances major histocompatibility class II presentation of tumor antigen, Cancer Res., 56, 21
  29. Loyher, 2016, CCR2 Influences T Regulatory Cell Migration to Tumors and Serves as a Biomarker of Cyclophosphamide Sensitivity, Cancer Res., 76, 6483, 10.1158/0008-5472.CAN-16-0984 · DOI
  30. Maeda, 2012, Wnt5a-Ror2 signaling between osteoblast-lineage cells and osteoclast precursors enhances osteoclastogenesis, Nat. Med., 18, 405, 10.1038/nm.2653 · DOI · Paper page
  31. Mantovani, 2015, The interaction of anticancer therapies with tumor-associated macrophages, J. Exp. Med., 212, 435, 10.1084/jem.20150295 · DOI
  32. Misharin, 2013, Flow cytometric analysis of macrophages and dendritic cell subsets in the mouse lung, Am. J. Respir. Cell Mol. Biol., 49, 503, 10.1165/rcmb.2013-0086MA · DOI · Paper page
  33. Montero, 2012, Long-Term Complete Remission with nab-Paclitaxel, Bevacizumab, and Gemcitabine Combination Therapy in a Patient with Triple-Negative Metastatic Breast Cancer, Case Rep. Oncol., 5, 687, 10.1159/000346345 · DOI
  34. Motz, 2011, The parallel lives of angiogenesis and immunosuppression: cancer and other tales, Nat. Rev. Immunol., 11, 702, 10.1038/nri3064 · DOI · Paper page
  35. Ovchinnikov, 2008, Expression of Gal4-dependent transgenes in cells of the mononuclear phagocyte system labeled with enhanced cyan fluorescent protein using Csf1r-Gal4VP16/UAS-ECFP double-transgenic mice, J. Leukoc. Biol., 83, 430, 10.1189/jlb.0807585 · DOI
  36. Pollard, 2004, Tumour-educated macrophages promote tumour progression and metastasis, Nat. Rev. Cancer., 4, 71, 10.1038/nrc1256 · DOI
  37. Qian, 2010, Macrophage diversity enhances tumor progression and metastasis, Cell., 141, 39, 10.1016/j.cell.2010.03.014 · DOI
  38. Qian, 2015, FLT1 signaling in metastasis-associated macrophages activates an inflammatory signature that promotes breast cancer metastasis, J. Exp. Med., 212, 1433, 10.1084/jem.20141555 · DOI
  39. Rodero, 2015, Immune surveillance of the lung by migrating tissue monocytes, eLife., 4, e07847, 10.7554/eLife.07847 · DOI
  40. Sabatel, 2017, Exposure to Bacterial CpG DNA Protects from Airway Allergic Inflammation by Expanding Regulatory Lung Interstitial Macrophages, Immunity., 46, 457, 10.1016/j.immuni.2017.02.016 · DOI
  41. Saeed, 2006, TM4 microarray software suite, Methods Enzymol., 411, 134, 10.1016/S0076-6879(06)11009-5 · DOI
  42. Sauter, 2014, The MacBlue binary transgene (csf1r-gal4VP16/UAS-ECFP) provides a novel marker for visualisation of subsets of monocytes, macrophages and dendritic cells and responsiveness to CSF1 administration, PLoS One., 9, e105429, 10.1371/journal.pone.0105429 · DOI
  43. Schneider, 2014, Induction of the nuclear receptor PPAR-γ by the cytokine GM-CSF is critical for the differentiation of fetal monocytes into alveolar macrophages, Nat. Immunol., 15, 1026, 10.1038/ni.3005 · DOI
  44. Tamagnone, 2012, Emerging role of semaphorins as major regulatory signals and potential therapeutic targets in cancer, Cancer Cell., 22, 145, 10.1016/j.ccr.2012.06.031 · DOI
  45. Tan, 2016, Developmental origin of lung macrophage diversity, Development., 143, 1318, 10.1242/dev.129122 · DOI
  46. Trapnell, 2002, Gm-CSF regulates pulmonary surfactant homeostasis and alveolar macrophage-mediated innate host defense, Annu. Rev. Physiol., 64, 775, 10.1146/annurev.physiol.64.090601.113847 · DOI
  47. van de Laar, 2016, Yolk Sac Macrophages, Fetal Liver, and Adult Monocytes Can Colonize an Empty Niche and Develop into Functional Tissue-Resident Macrophages, Immunity., 44, 755, 10.1016/j.immuni.2016.02.017 · DOI
  48. Wyckoff, 2007, Direct visualization of macrophage-assisted tumor cell intravasation in mammary tumors, Cancer Res., 67, 2649, 10.1158/0008-5472.CAN-06-1823 · DOI

Cited by

Sorted by citations

Metadata

Authors
Loyher, P.-L., Hamon, P., Laviron, M., Meghraoui-Kheddar, A., Goncalves, E., Deng, Z., Torstensson, S., Bercovici, N., Baudesson de Chanville, C., Combadière, B., Geissmann, F., Savina, A., Combadière, C., & Boissonnas, A.
Affiliations
  • Sorbonne Universités, Institut National de la Santé et de la Recherche Médicale (Inserm, UMR1135), Centre National de la Recherche Scientifique (CNRS, ERL8255), Centre d’Immunologie et des Maladies Infectieuses CIMI, Paris, France 1
  • Immunology Program, Sloan Kettering Institute, Memorial Sloan Kettering Cancer Center, New York, NY 4
  • Inserm, U1016, Institut Cochin, CNRS UMR8104, Université Paris Descartes, Sorbonne Paris Cité, Paris, France 2
  • Institut Roche, 30, Boulogne-Billancourt Cedex, France 3
Venue
Journal of Experimental Medicine
Published
2018-09-10
Volume
215
Issue
10
Pages
2536-2553
ISSN
  • 0022-1007
  • 1540-9538
Cited by
298
References
9
Language
en
Funders
  • Fondation ARC pour la Recherche sur le Cancer
  • Memorial Sloan Kettering Cancer Center
  • Ligue Contre le Cancer
  • Seventh Framework Program (FP7/2007-2013, 304810)
  • Institut National de la Santé et de la Recherche Médicale
  • Roche
  • Fondation pour la Recherche Médicale
  • NIH
  • National Cancer Institute (P30CA008748)
  • National Institute of Allergy and Infectious Diseases (1R01AI130345-01)
  • National Heart, Lung, and Blood Institute (1 R01HL138090-01)

About these checks

Registry, retraction, Cites and statistics results are computed, not judged, with one exception: a printed reference that no index lists is read once by a model before it counts as a citation error. Claims are extracted by a model and kept only when their quote appears verbatim in the text; each cited source is then checked, with a model’s help, for whether it says what the claim relies on. Those verdicts can be wrong — read the claim’s quote and the cited source before relying on one.

Statistics and arithmetic are recomputed, not judged.

Confidence bands are shown only for fields calibrated on our annotated test set. None is calibrated yet, so no band is shown.

What counts as a claim ›How we measure confidence ›How we check this ›

Are you an author, or do you see a problem with this page? Request a review