Cited by 36

The DOI matches its Crossref record; 17 of the 17 references it cites were found in a registry or an index.

Qki is an essential regulator of microglial phagocytosis in demyelination

Ren, Jiangong, Dai, Congxin, Zhou, Xin, Barnes, Joseph A., Chen, Xi, Wang, Yunfei, Yuan, Liang, Shingu, Takashi, Heimberger, Amy B., Chen, Yiwen, Hu, Jian·2021·Journal of Experimental Medicine

Abstract

The mechanism underpinning the regulation of microglial phagocytosis in demyelinating diseases is unclear. Here, we showed that the Quaking protein (Qki) in microglia was greatly induced by demyelination in the brains of both mice and humans. Deletion of the Quaking gene (Qk) in microglia severely impaired the clearance of myelin debris. Transcriptomic profiling indicated that depletion of Qki impaired total RNA levels and splicing of the genes involved in phagosome formation and maturation. RNA immunoprecipitation (RIP) confirmed the physical interactions between the Qki protein and the mRNAs of Qki targets that are involved in phagocytosis, indicating that Qki regulates their RNA stability. Both Qki depletion and inhibition of Qki target Cd36 greatly reduced the phagocytic activity of microglia and macrophages. The defective uptake and degradation of myelin debris caused by Qki depletion in microglia resulted in unresolved myelin debris that impaired axon integrity, oligodendrocyte maturation, and subsequent remyelination. Thus, our results demonstrate that Qki is an essential regulator of microglia’s phagocytic activity under demyelinating conditions.

Overview

The claims and statistics of this paper haven’t been checked yet.

Run the check — free, no account needed. It reads the open-access text and checks the sources it cites.

A few free checks a day · papers already verified open instantly · results are public

Integrity signals

Registry

Crossref · 10.1084/jem.20190348

Cites

17 of 17 references verified0 citation errors · 0 not checkable

Statistics

Figures

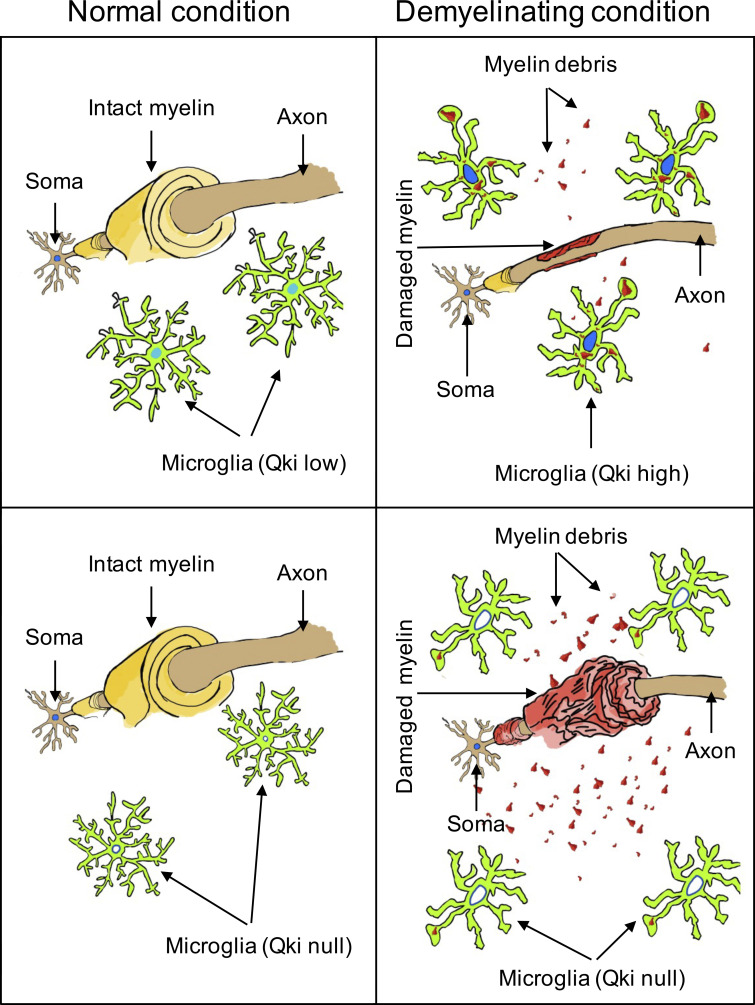
Graphical abstract
Graphical abstract CC BY-NC-SA · PubMed Central
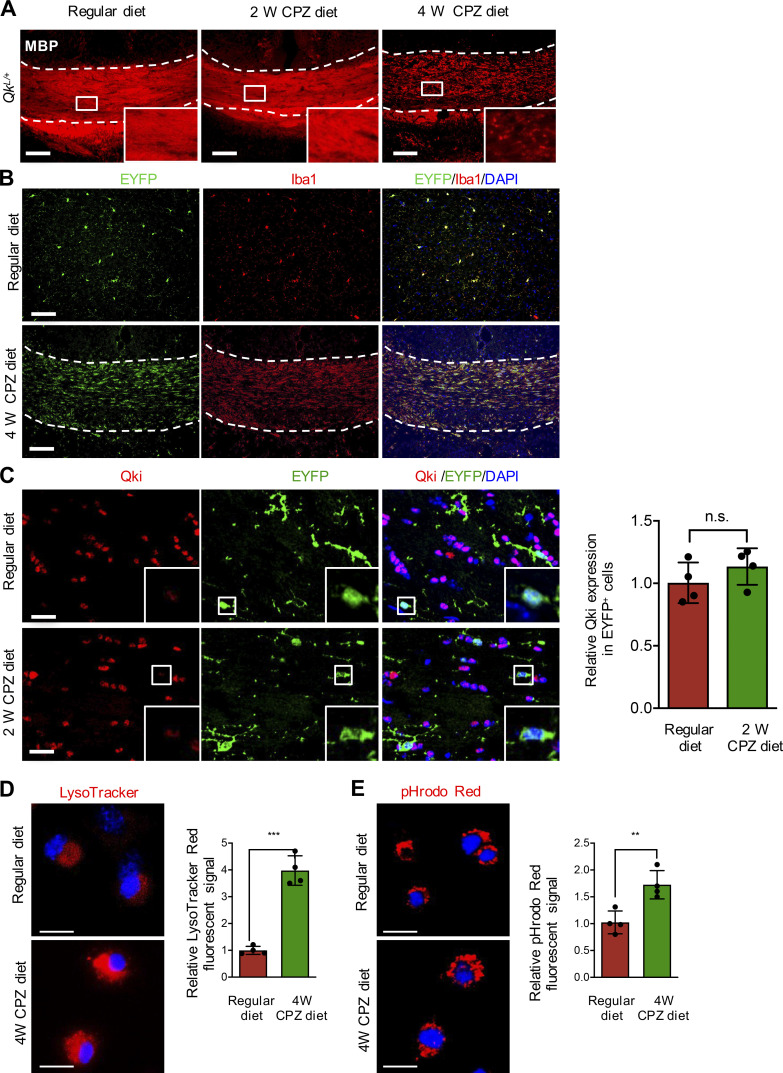
Figure S1. Qki in microglia is induced by demyelination in the CNS. (A) Representative images of IF of Mbp in the CCs of 8-wk-old control mice with 2- or 4-wk administration of the CPZ diet or the regular diet (n = 4 mice/group). (B) Representative images of IF of EYFP and Iba1 in the cortex of 8-wk-old Cx3cr1CreER-EYFP mice receiving the regular diet (top panels) or the CCs of 8-wk-old Cx3cr1CreER-EYFP receiving the CPZ diet (bottom panels) for 4 wk (n = 4/group). The regions between the dashed lines indicate the CC. (C) Representative images of IF and quantification of Qki and EYFP in the CCs of 8-wk-old control mice receiving the regular diet or the CPZ diet for 2 wk (n = 4/group). (D and E) Representative images and quantification of LysoTracker Red (D) and pHrodo Red (E) in microglia isolated as described in Cand treated with LysoTracker Red or pHrodo Red as indicated. Scale bars: 100 µm in A and B, 50 µm in C, and 20 µm in D and E. Data are means ± SD. Statistics were calculated using unpaired two-tailed Student’s t test (D and F). **, P < 0.01; ***, P < 0.001. Data represent three independent experiments (D and E). n.s., not significant; W, week.
Figure S1. Qki in microglia is induced by demyelination in the CNS. (A) Representative images of IF of Mbp in the CCs of 8-wk-old control mice with 2- or 4-wk administration of the CPZ diet or the regular diet (n = 4 mice/group). (B) Representative images of IF of EYFP and Iba1 in the cortex of 8-wk-old Cx3cr1CreER-EYFP mice receiving the regular diet (top panels) or the CCs of 8-wk-old Cx3cr1CreER-EYFP receiving the CPZ diet (bottom panels) for 4 wk (n = 4/group). The regions between the dashed lines indicate the CC. (C) Representative images of IF and quantification of Qki and EYFP in the CCs of 8-wk-old control mice receiving the regular diet or the CPZ diet for 2 wk (n = 4/group). (D and E) Representative images and quantification of LysoTracker Red (D) and pHrodo Red (E) in microglia isolated as described in Cand treated with LysoTracker Red or pHrodo Red as indicated. Scale bars: 100 µm in A and B, 50 µm in C, and 20 µm in D and E. Data are means ± SD. Statistics were calculated using unpaired two-tailed Student’s t test (D and F). **, P < 0.01; ***, P < 0.001. Data represent three independent experiments (D and E). n.s., not significant; W, week.CC BY-NC-SA · PubMed Central
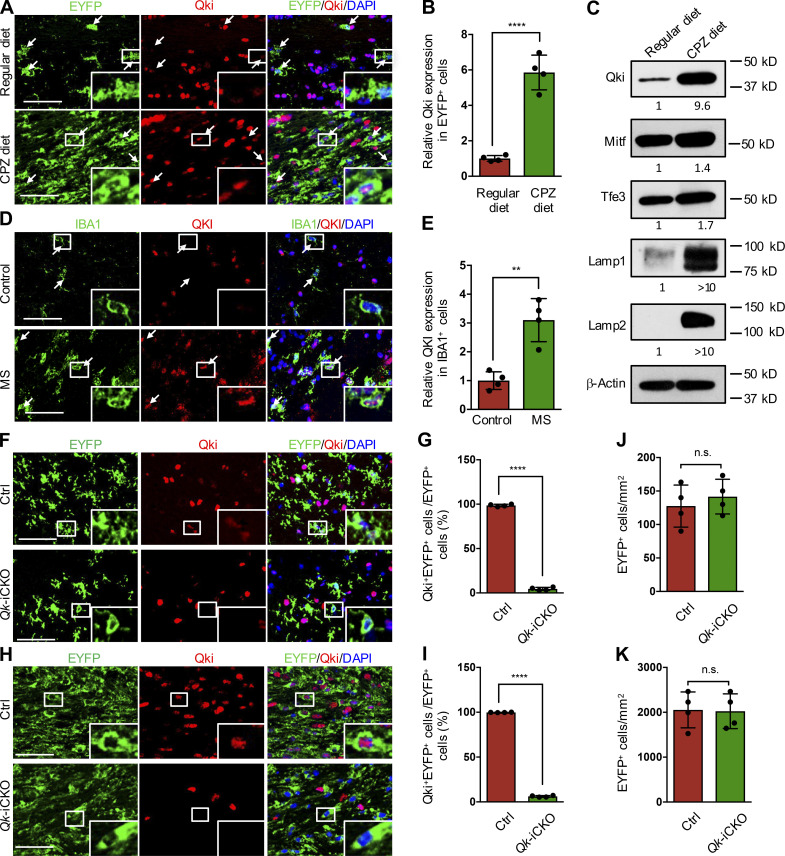
Figure 1. Qki in microglia is induced by demyelination in the CNS, and depletion of Qki does not impair microgliosis in response to CPZ-induced demyelination. (A and B) Representative images of IF and quantification of Qki and EYFP in the CC of 8-wk-old control mice fed the regular diet or the CPZ diet for 4 wk (n = 4 mice/group). (C) Western blotting showing the expression of Qki, the phagolysosomal components, and the regulators of phagocytosis in freshly isolated microglia from the CCs of 8-wk-old control mice fed the regular diet or the CPZ diet for 4 wk. The relative expression of these proteins was normalized with the loading control of β-actin. Data represent three independent experiments. (D and E) Representative images of IF and quantification of QKI and IBA1 in the lesions of patients with MS and the white matter of normal brain (n = 4 samples/group). Arrows indicate microglia in A and D. (F, G, and J) Representative images of IF of Qki and EYFP (F), quantification of percentage of Qki+EYFP+ microglia (G), and total number of EYFP+ microglia (J) in the cortex of P21 Qk-iCKO mice and control mice injected with tamoxifen at P15 (n = 4 mice/group). (H, I, and K) Representative images of IF of Qki and EYFP (H), quantification of percentage of Qki+EYFP+ microglia (I), and total number of EYFP+ microglia (K) in the CC of Qk-iCKO mice and control mice injected with tamoxifen at 8 wk of age and which subsequently received a CPZ diet for 4 wk (n = 4 mice/group). Scale bars: 50 µm. Data are means ± SD. Statistics were calculated using unpaired two-tailed Student’s t test (B, E, and I–K). **, P < 0.01; ****, P < 0.0001. Ctrl, control; n.s., not significant.
Figure 1. Qki in microglia is induced by demyelination in the CNS, and depletion of Qki does not impair microgliosis in response to CPZ-induced demyelination. (A and B) Representative images of IF and quantification of Qki and EYFP in the CC of 8-wk-old control mice fed the regular diet or the CPZ diet for 4 wk (n = 4 mice/group). (C) Western blotting showing the expression of Qki, the phagolysosomal components, and the regulators of phagocytosis in freshly isolated microglia from the CCs of 8-wk-old control mice fed the regular diet or the CPZ diet for 4 wk. The relative expression of these proteins was normalized with the loading control of β-actin. Data represent three independent experiments. (D and E) Representative images of IF and quantification of QKI and IBA1 in the lesions of patients with MS and the white matter of normal brain (n = 4 samples/group). Arrows indicate microglia in A and D. (F, G, and J) Representative images of IF of Qki and EYFP (F), quantification of percentage of Qki+EYFP+ microglia (G), and total number of EYFP+ microglia (J) in the cortex of P21 Qk-iCKO mice and control mice injected with tamoxifen at P15 (n = 4 mice/group). (H, I, and K) Representative images of IF of Qki and EYFP (H), quantification of percentage of Qki+EYFP+ microglia (I), and total number of EYFP+ microglia (K) in the CC of Qk-iCKO mice and control mice injected with tamoxifen at 8 wk of age and which subsequently received a CPZ diet for 4 wk (n = 4 mice/group). Scale bars: 50 µm. Data are means ± SD. Statistics were calculated using unpaired two-tailed Student’s t test (B, E, and I–K). **, P < 0.01; ****, P < 0.0001. Ctrl, control; n.s., not significant.CC BY-NC-SA · PubMed Central
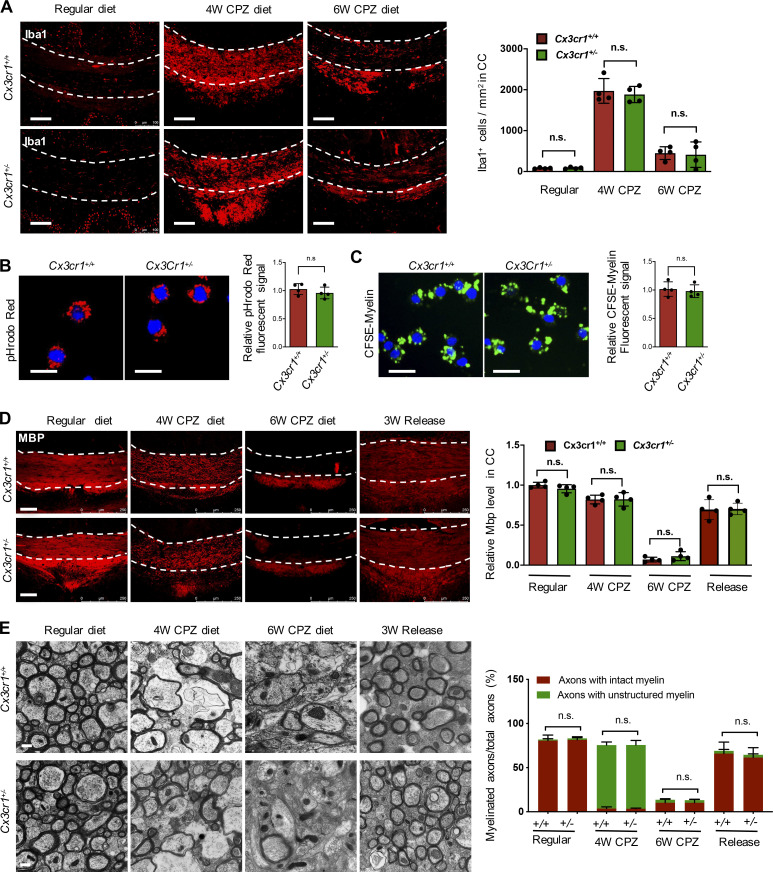
Figure S2. The heterogeneous deletion of Cx3cr1 in microglia does not affect its proliferation and phagocytic activity and the demyelinating and remyelinating courses of the CPZ-induced demyelination model. (A) Representative images of IF and quantification of Iba1 in the CCs of 8-wk-old Cx3cr1+/+ and Cx3cr1+/− mice with 4- or 6-wk administration of the CPZ diet or the regular diet (n = 4 mice/group). Scale bars: 100 µm. (B and C) Representative images and quantification of pHrodo Red (B) and CFSE-labeled myelin (C) in microglia isolated from the CCs of 8-wk-old Cx3cr1+/+ and Cx3cr1+/− mice with 4-wk administration of the CPZ diet and incubated with pHrodo Red and CFSE-labeled myelin as indicated. Scale bars: 20 µm. (D) Representative images of IF and quantification of Mbp in the CCs of 8-wk-old Cx3cr1+/+ and Cx3cr1+/− mice administered the regular diet, the CPZ diet for 4 wk, the CPZ diet for 6 wk, or the CPZ diet for 6 wk followed by the normal diet for 3 wk. Scale bars: 100 µm. (E) Representative electron micrographs and quantification in the CCs of 8-wk-old Cx3cr1+/+ and Cx3cr1+/− mice administered the regular diet, the CPZ diet for 4 wk, the CPZ diet for 6 wk, or the CPZ diet for 6 wk followed by the normal diet for 3 wk (n = 4 mice/group). Scale bars: 2 µm. Data are means ± SD. Statistics were calculated using two-way ANOVA with Tukey’s post hoc tests (A and D), unpaired two-tailed Student’s t test (B and C), and χ2 test (E). Data represent three independent experiments (B and C). The regions between the dashed lines indicate the CC (A and D). n.s., not significant; W, week.
Figure S2. The heterogeneous deletion of Cx3cr1 in microglia does not affect its proliferation and phagocytic activity and the demyelinating and remyelinating courses of the CPZ-induced demyelination model. (A) Representative images of IF and quantification of Iba1 in the CCs of 8-wk-old Cx3cr1+/+ and Cx3cr1+/− mice with 4- or 6-wk administration of the CPZ diet or the regular diet (n = 4 mice/group). Scale bars: 100 µm. (B and C) Representative images and quantification of pHrodo Red (B) and CFSE-labeled myelin (C) in microglia isolated from the CCs of 8-wk-old Cx3cr1+/+ and Cx3cr1+/− mice with 4-wk administration of the CPZ diet and incubated with pHrodo Red and CFSE-labeled myelin as indicated. Scale bars: 20 µm. (D) Representative images of IF and quantification of Mbp in the CCs of 8-wk-old Cx3cr1+/+ and Cx3cr1+/− mice administered the regular diet, the CPZ diet for 4 wk, the CPZ diet for 6 wk, or the CPZ diet for 6 wk followed by the normal diet for 3 wk. Scale bars: 100 µm. (E) Representative electron micrographs and quantification in the CCs of 8-wk-old Cx3cr1+/+ and Cx3cr1+/− mice administered the regular diet, the CPZ diet for 4 wk, the CPZ diet for 6 wk, or the CPZ diet for 6 wk followed by the normal diet for 3 wk (n = 4 mice/group). Scale bars: 2 µm. Data are means ± SD. Statistics were calculated using two-way ANOVA with Tukey’s post hoc tests (A and D), unpaired two-tailed Student’s t test (B and C), and χ2 test (E). Data represent three independent experiments (B and C). The regions between the dashed lines indicate the CC (A and D). n.s., not significant; W, week.CC BY-NC-SA · PubMed Central
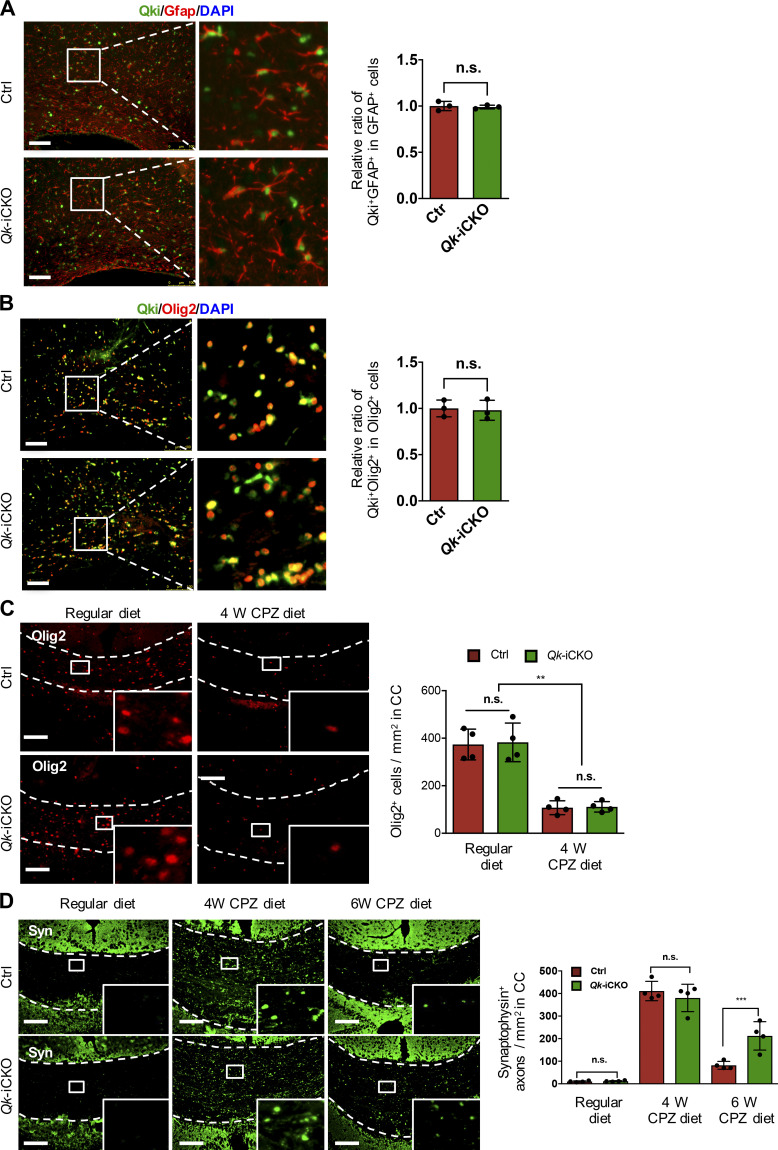
Figure S3. Depletion of Qki in microglia does not affect the expression of Qki in astrocytes and oligodendrocytes and CPZ-induced myelin damage. (A and B) Representative images of IF of Qki-Gfap (A) and Qki-Olig2 (B) in the CCs of Qk-iCKO mice and control (Ctrl) mice 1 wk after tamoxifen injection at P14. (C) Representative images of IF and quantification of oligodendrocyte lineage cells (Olig2-positive) in the CCs of 8-wk-old Qk-iCKO and control mice with tamoxifen injection followed by 4 wk of the CPZ diet or the regular diet. (D) Representative images of IF and quantification of synaptophysin (Syn) in the CCs of 8-wk-old Qk-iCKO and control mice with tamoxifen injection followed by 4- or 6-wk administration of the CPZ diet. n = 4 mice/group. Scale bars: 100 µm. Data are means ± SD. Statistics were calculated using unpaired two-tailed Student’s t test (A and B) and two-way ANOVA with Tukey’s post hoc tests (C and D). **, P < 0.01; ***, P < 0.001. The regions between the dashed lines indicate the CC (C and D). n.s., not significant.
Figure S3. Depletion of Qki in microglia does not affect the expression of Qki in astrocytes and oligodendrocytes and CPZ-induced myelin damage. (A and B) Representative images of IF of Qki-Gfap (A) and Qki-Olig2 (B) in the CCs of Qk-iCKO mice and control (Ctrl) mice 1 wk after tamoxifen injection at P14. (C) Representative images of IF and quantification of oligodendrocyte lineage cells (Olig2-positive) in the CCs of 8-wk-old Qk-iCKO and control mice with tamoxifen injection followed by 4 wk of the CPZ diet or the regular diet. (D) Representative images of IF and quantification of synaptophysin (Syn) in the CCs of 8-wk-old Qk-iCKO and control mice with tamoxifen injection followed by 4- or 6-wk administration of the CPZ diet. n = 4 mice/group. Scale bars: 100 µm. Data are means ± SD. Statistics were calculated using unpaired two-tailed Student’s t test (A and B) and two-way ANOVA with Tukey’s post hoc tests (C and D). **, P < 0.01; ***, P < 0.001. The regions between the dashed lines indicate the CC (C and D). n.s., not significant.CC BY-NC-SA · PubMed Central
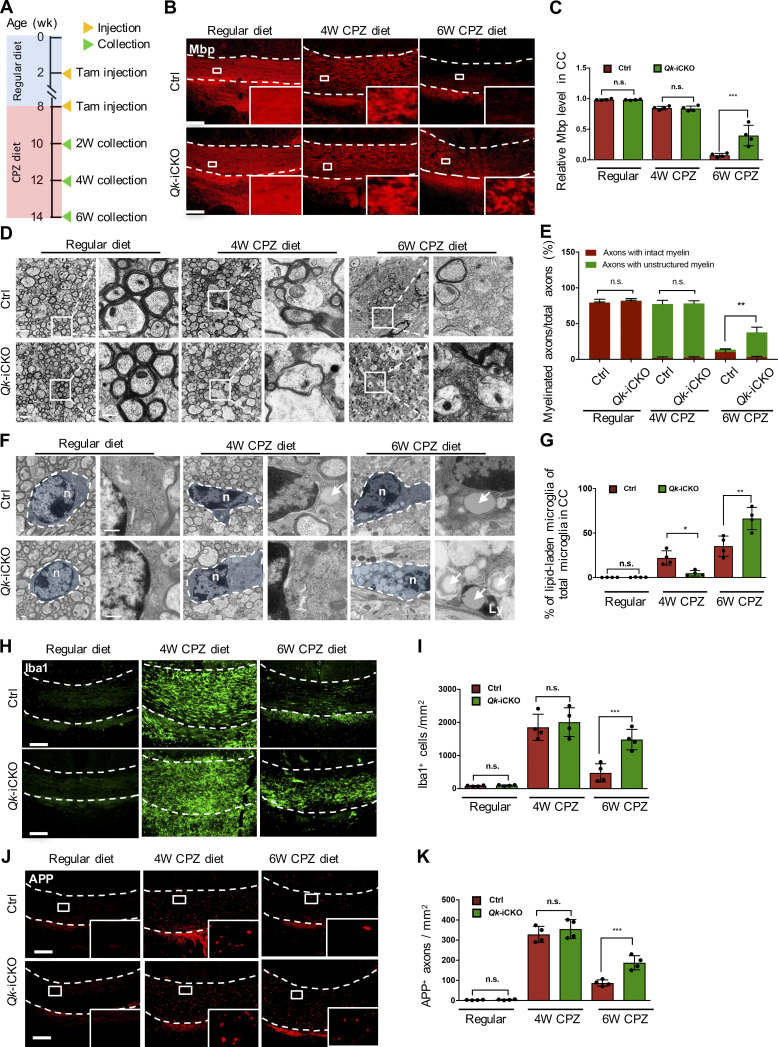
Figure 2. Depletion of Qki in microglia does not affect CPZ-induced myelin degeneration but impairs myelin debris removal. (A) Schema representing the experimental design for tamoxifen (Tam) injection, CPZ diet treatment, and sample collection. (B and C) Representative images of IF and quantification of Mbp in the CCs of 8-wk-old Qk-iCKO and control mice with tamoxifen injection followed by 4- or 6-wk administration of the CPZ diet (n = 4 mice/group). (D) Representative electron micrographs of myelin in the CCs of 8-wk-old Qk-iCKO and control mice with tamoxifen injection followed by 4- or 6-wk administration of the CPZ diet (n = 4 mice/group). (E) Quantification of the percentages of axons wrapped with intact myelin or unstructured myelin of the samples in D. (F) Representative electron micrographs showing the morphology and LLM in the samples in D (n = 4 mice/group). Arrows indicate lipid droplets. Ly, lysosome; n, nucleus. (G) Quantification of the percentages of LLM of the samples in F. (H and I) Representative images of IF and quantification of Iba1 in the CCs of 8-wk-old Qk-iCKO and control mice with tamoxifen injection followed by 4- or 6-wk administration of the CPZ diet (n = 4 mice/group). (J and K) Representative images of IF and quantification of APP in the CCs of 8-wk-old Qk-iCKO and control mice with tamoxifen injection followed by 4- or 6-wk administration of the CPZ diet (n = 4 mice/group). Scale bars: 100 µm in B, H, and J; 2 µm in D; and 500 nm in F. Data are means ± SD. Statistics were calculated using two-way ANOVA with Tukey’s post hoc tests (C, G, I, and K) and χ2 test (E). *, P < 0.05; **, P < 0.01; ***, P < 0.001. n.s., not significant. The regions between the dashed lines (B, H, and J) indicate the CC. Data are representative of three independent experiments (B, C, J, and K). Ctrl, control; W, week.
Figure 2. Depletion of Qki in microglia does not affect CPZ-induced myelin degeneration but impairs myelin debris removal. (A) Schema representing the experimental design for tamoxifen (Tam) injection, CPZ diet treatment, and sample collection. (B and C) Representative images of IF and quantification of Mbp in the CCs of 8-wk-old Qk-iCKO and control mice with tamoxifen injection followed by 4- or 6-wk administration of the CPZ diet (n = 4 mice/group). (D) Representative electron micrographs of myelin in the CCs of 8-wk-old Qk-iCKO and control mice with tamoxifen injection followed by 4- or 6-wk administration of the CPZ diet (n = 4 mice/group). (E) Quantification of the percentages of axons wrapped with intact myelin or unstructured myelin of the samples in D. (F) Representative electron micrographs showing the morphology and LLM in the samples in D (n = 4 mice/group). Arrows indicate lipid droplets. Ly, lysosome; n, nucleus. (G) Quantification of the percentages of LLM of the samples in F. (H and I) Representative images of IF and quantification of Iba1 in the CCs of 8-wk-old Qk-iCKO and control mice with tamoxifen injection followed by 4- or 6-wk administration of the CPZ diet (n = 4 mice/group). (J and K) Representative images of IF and quantification of APP in the CCs of 8-wk-old Qk-iCKO and control mice with tamoxifen injection followed by 4- or 6-wk administration of the CPZ diet (n = 4 mice/group). Scale bars: 100 µm in B, H, and J; 2 µm in D; and 500 nm in F. Data are means ± SD. Statistics were calculated using two-way ANOVA with Tukey’s post hoc tests (C, G, I, and K) and χ2 test (E). *, P < 0.05; **, P < 0.01; ***, P < 0.001. n.s., not significant. The regions between the dashed lines (B, H, and J) indicate the CC. Data are representative of three independent experiments (B, C, J, and K). Ctrl, control; W, week.CC BY-NC-SA · PubMed Central
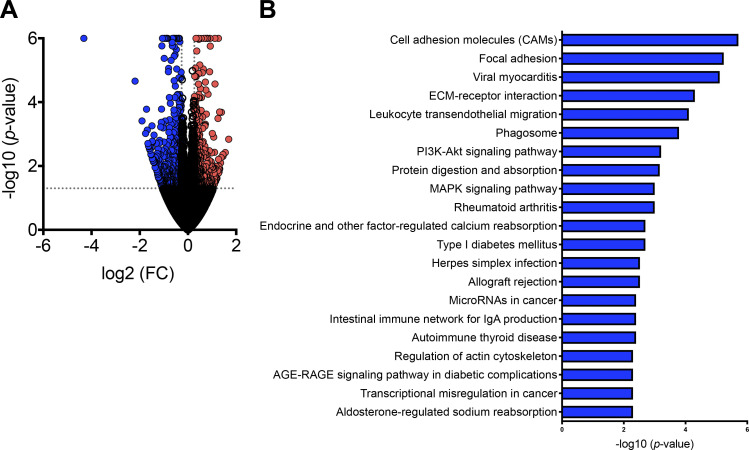
Figure S4. Depletion of Qki in microglia impaired alternative splicing of the genes involved in phagocytic activity. (A) Volcano plot showing the differentially expressed genes in microglia isolated from the CC of 8-wk-old Qk-iCKO mice and control mice injected with tamoxifen followed by 6-wk administration of the CPZ diet (n = 4/group). Red and blue represent genes whose expression were up-regulated and down-regulated, respectively, upon depletion of Qki. (B) Bar graph showing the top 21 enriched pathways based on the differentially spliced events in the samples in A (n = 4 samples/group). ECM, extracellular matrix.
Figure S4. Depletion of Qki in microglia impaired alternative splicing of the genes involved in phagocytic activity. (A) Volcano plot showing the differentially expressed genes in microglia isolated from the CC of 8-wk-old Qk-iCKO mice and control mice injected with tamoxifen followed by 6-wk administration of the CPZ diet (n = 4/group). Red and blue represent genes whose expression were up-regulated and down-regulated, respectively, upon depletion of Qki. (B) Bar graph showing the top 21 enriched pathways based on the differentially spliced events in the samples in A (n = 4 samples/group). ECM, extracellular matrix.CC BY-NC-SA · PubMed Central
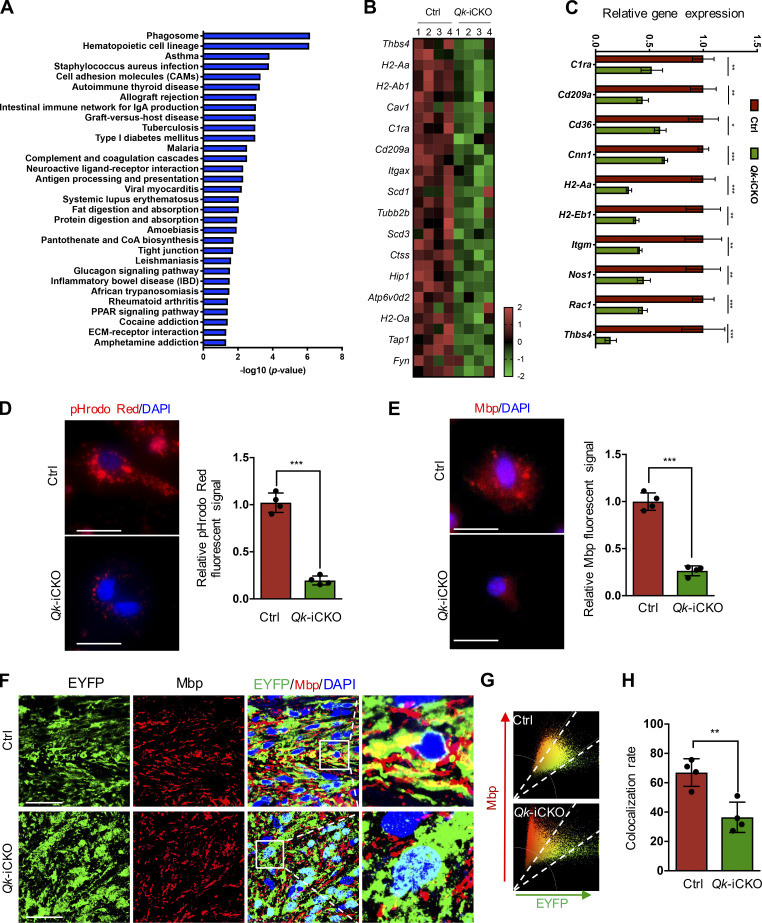
Figure 3. Depletion of Qki in microglia impaired its transcription of genes involved in phagocytic activity. (A) Bar graph showing the enriched pathways based on the differentially expressed genes in microglia isolated from 8-wk-old Qk-iCKO mice and control mice with tamoxifen injection followed by 6-wk administration of the CPZ diet (n = 4 samples/group). (B) Heatmap representing down-regulated genes involved in phagocytosis in microglia of the samples in A. (C) qPCR validation of the top 10 down-regulated genes involved in phagocytosis in microglia of the samples in A. (D) Representative images and quantification of the uptake of pHrodo Red E. coli BioParticles conjugates in isolated microglia from P21 Qk-iCKO and control mice injected with tamoxifen at P15 (n = 4 mice/group; at least 50 cells/mouse were counted and quantified). (E) Representative images and quantification of Mbp, an indicator for uptaken myelin debris in isolated microglia from P21 Qk-iCKO and control mice injected with tamoxifen at P15 (n = 4 mice/group; at least 50 cells/mouse were counted and quantified). (F) Representative images of IF of Mbp and EYFP in the CCs of 8-wk-old Qk-iCKO mice and control mice with tamoxifen injection followed by 4-wk administration of the CPZ diet (n = 4 mice/group). (G) Scatter plot showing the colocalization rates of Mbp and EYFP for the images in F; the signals with colocalization of Mbp and EYFP are indicated between the dashed lines. (H) Quantitative analyses of colocalization rate from the samples in F. Scale bars: 25 µm in D and E; 50 µm in F. Data are means ± SD. Statistics were calculated using unpaired two-tailed Student’s t test (C–E and H). *, P < 0.05; **, P < 0.01; ***, P < 0.001. Data are representative of three independent experiments (C, D, and E). Ctrl, control; CoA, coenzyme A; ECM, extracellular matrix; PPAR, peroxisome proliferator–activated receptor.
Figure 3. Depletion of Qki in microglia impaired its transcription of genes involved in phagocytic activity. (A) Bar graph showing the enriched pathways based on the differentially expressed genes in microglia isolated from 8-wk-old Qk-iCKO mice and control mice with tamoxifen injection followed by 6-wk administration of the CPZ diet (n = 4 samples/group). (B) Heatmap representing down-regulated genes involved in phagocytosis in microglia of the samples in A. (C) qPCR validation of the top 10 down-regulated genes involved in phagocytosis in microglia of the samples in A. (D) Representative images and quantification of the uptake of pHrodo Red E. coli BioParticles conjugates in isolated microglia from P21 Qk-iCKO and control mice injected with tamoxifen at P15 (n = 4 mice/group; at least 50 cells/mouse were counted and quantified). (E) Representative images and quantification of Mbp, an indicator for uptaken myelin debris in isolated microglia from P21 Qk-iCKO and control mice injected with tamoxifen at P15 (n = 4 mice/group; at least 50 cells/mouse were counted and quantified). (F) Representative images of IF of Mbp and EYFP in the CCs of 8-wk-old Qk-iCKO mice and control mice with tamoxifen injection followed by 4-wk administration of the CPZ diet (n = 4 mice/group). (G) Scatter plot showing the colocalization rates of Mbp and EYFP for the images in F; the signals with colocalization of Mbp and EYFP are indicated between the dashed lines. (H) Quantitative analyses of colocalization rate from the samples in F. Scale bars: 25 µm in D and E; 50 µm in F. Data are means ± SD. Statistics were calculated using unpaired two-tailed Student’s t test (C–E and H). *, P < 0.05; **, P < 0.01; ***, P < 0.001. Data are representative of three independent experiments (C, D, and E). Ctrl, control; CoA, coenzyme A; ECM, extracellular matrix; PPAR, peroxisome proliferator–activated receptor.CC BY-NC-SA · PubMed Central
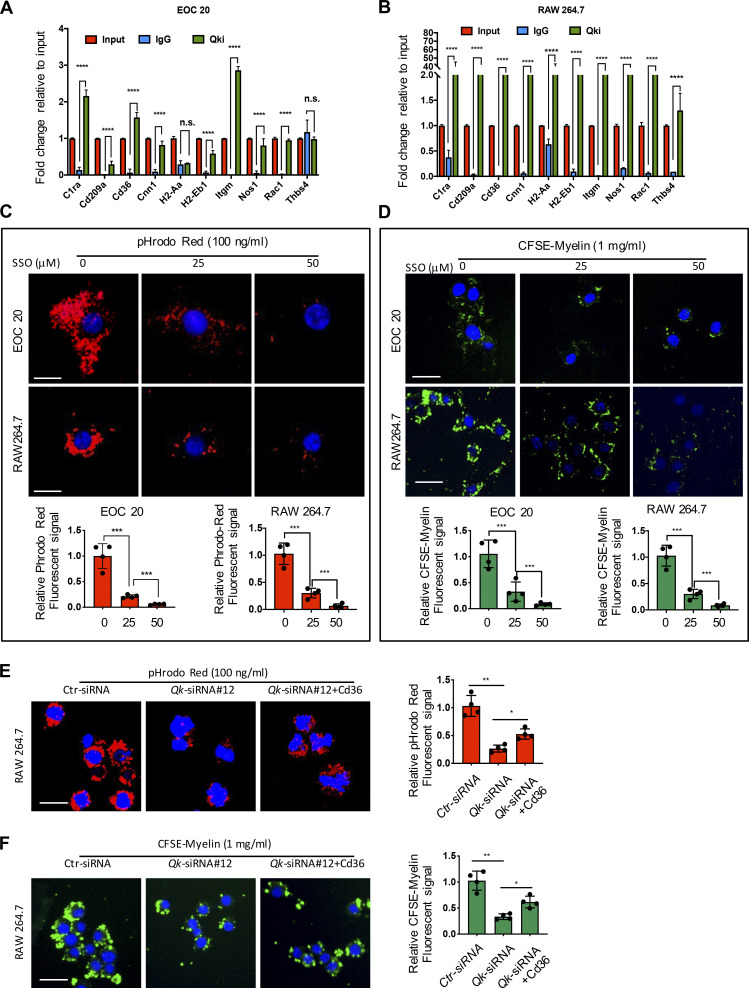
Figure 4. Qki regulates various genes involved in phagocytosis in microglia through interacting with their RNAs. (A and B) Qki target RNAs were immunoprecipitated with normal rabbit IgG or antibody against Qki following the RIP method in EOC 20 and RAW 264.7 cell lines, respectively. The abundance of immunoprecipitated RNAs was measured by qPCR and normalized against the levels of input. (C) Representative images and quantification of the uptake of pHrodo Red E. coli BioParticle Conjugates by EOC 20 and RAW 264.7 cells treated with Cd36 inhibitors (n = 4/group; at least 50 cells/slide were counted and quantified). (D) Representative images and quantification of the uptake of CFSE-labeled myelin debris by EOC 20 and RAW 264.7 cells treated with Cd36 inhibitors (n = 4/group; at least 50 cells/slide were counted and quantified). (E) Representative images and quantification of the uptake of pHrodo Red E. coli BioParticle conjugates by RAW 264.7 cells with knockdown of Qki and ectopic expression of Cd36 (n = 4/group; at least 50 cells/slide were counted and quantified). (F) Representative images and quantification of the uptake of CFSE-labeled myelin debris by RAW 264.7 cells with knockdown of Qki and ectopic expression of Cd36 (n = 4/group; at least 50 cells/slide were counted and quantified). Scale bars: 10 µm in C and 20 µm in D–F. Data are means ± SD. Statistics were calculated using unpaired two-tailed Student’s t test (A and B) and one-way ANOVA with Tukey’s post hoc tests (C–F). *, P < 0.05; **, P < 0.01; ***, P < 0.001; ****, P < 0.0001; Data are representative of three independent experiments (A–F). Ctr, control; n.s., not significant.
Figure 4. Qki regulates various genes involved in phagocytosis in microglia through interacting with their RNAs. (A and B) Qki target RNAs were immunoprecipitated with normal rabbit IgG or antibody against Qki following the RIP method in EOC 20 and RAW 264.7 cell lines, respectively. The abundance of immunoprecipitated RNAs was measured by qPCR and normalized against the levels of input. (C) Representative images and quantification of the uptake of pHrodo Red E. coli BioParticle Conjugates by EOC 20 and RAW 264.7 cells treated with Cd36 inhibitors (n = 4/group; at least 50 cells/slide were counted and quantified). (D) Representative images and quantification of the uptake of CFSE-labeled myelin debris by EOC 20 and RAW 264.7 cells treated with Cd36 inhibitors (n = 4/group; at least 50 cells/slide were counted and quantified). (E) Representative images and quantification of the uptake of pHrodo Red E. coli BioParticle conjugates by RAW 264.7 cells with knockdown of Qki and ectopic expression of Cd36 (n = 4/group; at least 50 cells/slide were counted and quantified). (F) Representative images and quantification of the uptake of CFSE-labeled myelin debris by RAW 264.7 cells with knockdown of Qki and ectopic expression of Cd36 (n = 4/group; at least 50 cells/slide were counted and quantified). Scale bars: 10 µm in C and 20 µm in D–F. Data are means ± SD. Statistics were calculated using unpaired two-tailed Student’s t test (A and B) and one-way ANOVA with Tukey’s post hoc tests (C–F). *, P < 0.05; **, P < 0.01; ***, P < 0.001; ****, P < 0.0001; Data are representative of three independent experiments (A–F). Ctr, control; n.s., not significant.CC BY-NC-SA · PubMed Central
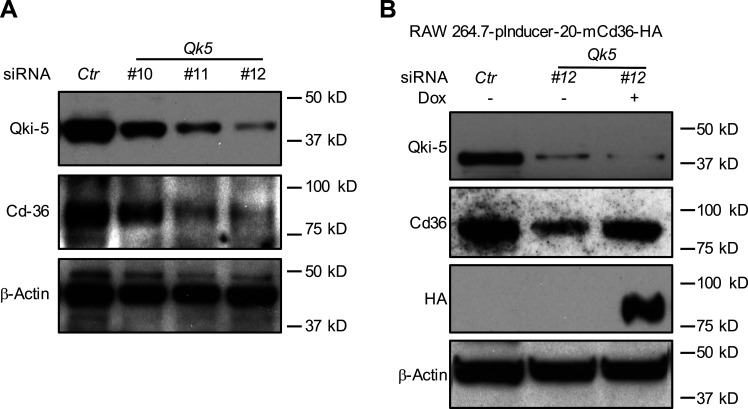
Figure S5. Cd36 mediates Qki-induced phagocytic activity in RAW 264.7 cells. (A and B) Stable cell line with ectopic expression of pInducer-20-mCd36-HA was generated in RAW 264.7 cells. (A) Qki was knocked down by ON-TARGETplus siRNA reagents (three individual siRNAs) in the stable cells. (B) Qki-5 was reintroduced by treatment of doxycycline (Dox). The expression of Qki and Cd36 was determined by Western blot as indicated. β-Actin was used as loading control (Ctr). Data represent three independent experiments.
Figure S5. Cd36 mediates Qki-induced phagocytic activity in RAW 264.7 cells. (A and B) Stable cell line with ectopic expression of pInducer-20-mCd36-HA was generated in RAW 264.7 cells. (A) Qki was knocked down by ON-TARGETplus siRNA reagents (three individual siRNAs) in the stable cells. (B) Qki-5 was reintroduced by treatment of doxycycline (Dox). The expression of Qki and Cd36 was determined by Western blot as indicated. β-Actin was used as loading control (Ctr). Data represent three independent experiments.CC BY-NC-SA · PubMed Central
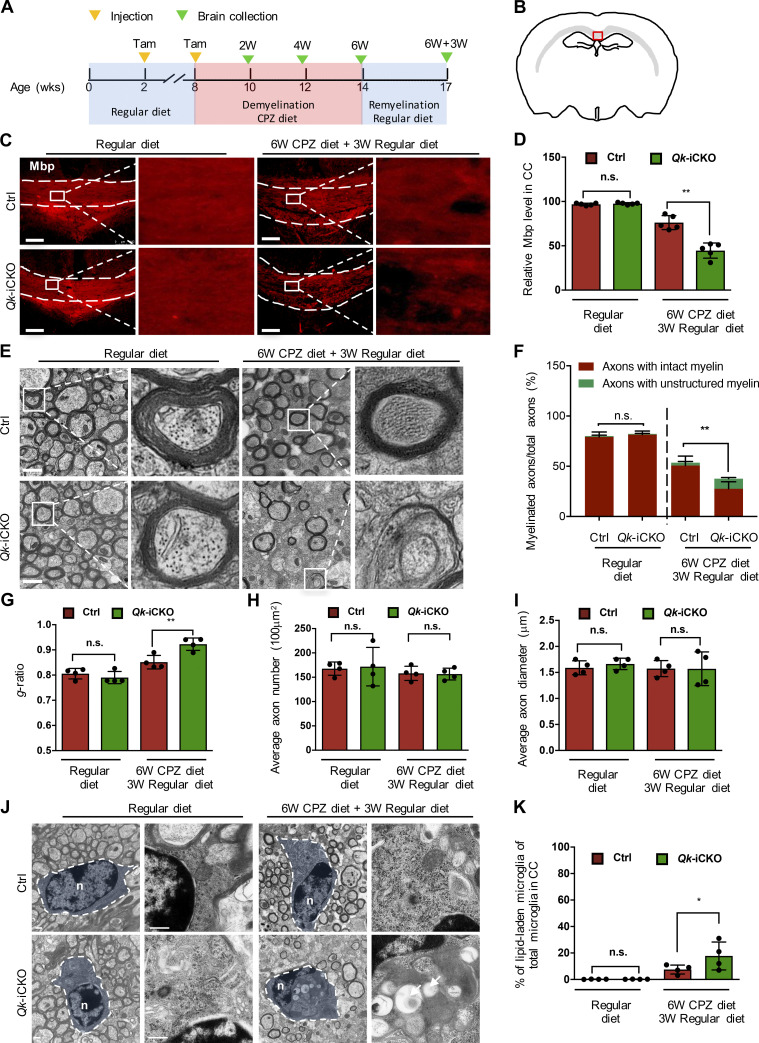
Figure 5. Persistent myelin debris impaired proper remyelination in Qki-depleted mice. (A) Schema representing the strategy of animal treatment and sample collection. Tam, tamoxifen. (B) Schema representing the examined coronal section of mouse brain. The red boxed area of the caudal CC was analyzed (modified from Sidman, High Resolution Mouse Brain Atlas; Sidman et al., 1999) in C, F, and J. (C and D) Representative images of IF and quantification of Mbp in the CCs of 8-wk-old Qk-iCKO mice and control mice with tamoxifen injection followed by 6-wk administration of the CPZ diet and 3 wk of the regular diet (n = 5 mice/group). (E) Representative electron micrographs of myelin in the CCs of 8-wk-old Qk-iCKO mice and control mice with tamoxifen injection followed by 6-wk administration of the CPZ diet and 3 wk of the regular diet (n = 4 mice/group). (F–I) Quantification of the percentages of axons wrapped with intact myelin and unstructured myelin among the total axons (F), the g-ratio (G), the axon density (H), and the axonal diameter (I) in the CCs of the samples in E (n = 4 mice/group). (J) Representative electron micrographs showing the morphology and LLM in the samples in E(n = 4 mice/group. Arrows indicate lipid droplets. n, nucleus. (K) Quantification of the percentages of LLM of the samples in J (n = 4 mice/group). Scale bars: 100 µm in C, 2 µm in E, and 500 nm in J. Data are means ± SD. Statistics were calculated using two-way ANOVA with Tukey’s post hoc tests (D, GI, and K) and χ2 test (F). *, P < 0.05; **, P < 0.01. Ctrl, control; n.s., not significant; W, week.
Figure 5. Persistent myelin debris impaired proper remyelination in Qki-depleted mice. (A) Schema representing the strategy of animal treatment and sample collection. Tam, tamoxifen. (B) Schema representing the examined coronal section of mouse brain. The red boxed area of the caudal CC was analyzed (modified from Sidman, High Resolution Mouse Brain Atlas; Sidman et al., 1999) in C, F, and J. (C and D) Representative images of IF and quantification of Mbp in the CCs of 8-wk-old Qk-iCKO mice and control mice with tamoxifen injection followed by 6-wk administration of the CPZ diet and 3 wk of the regular diet (n = 5 mice/group). (E) Representative electron micrographs of myelin in the CCs of 8-wk-old Qk-iCKO mice and control mice with tamoxifen injection followed by 6-wk administration of the CPZ diet and 3 wk of the regular diet (n = 4 mice/group). (F–I) Quantification of the percentages of axons wrapped with intact myelin and unstructured myelin among the total axons (F), the g-ratio (G), the axon density (H), and the axonal diameter (I) in the CCs of the samples in E (n = 4 mice/group). (J) Representative electron micrographs showing the morphology and LLM in the samples in E(n = 4 mice/group. Arrows indicate lipid droplets. n, nucleus. (K) Quantification of the percentages of LLM of the samples in J (n = 4 mice/group). Scale bars: 100 µm in C, 2 µm in E, and 500 nm in J. Data are means ± SD. Statistics were calculated using two-way ANOVA with Tukey’s post hoc tests (D, GI, and K) and χ2 test (F). *, P < 0.05; **, P < 0.01. Ctrl, control; n.s., not significant; W, week.CC BY-NC-SA · PubMed Central
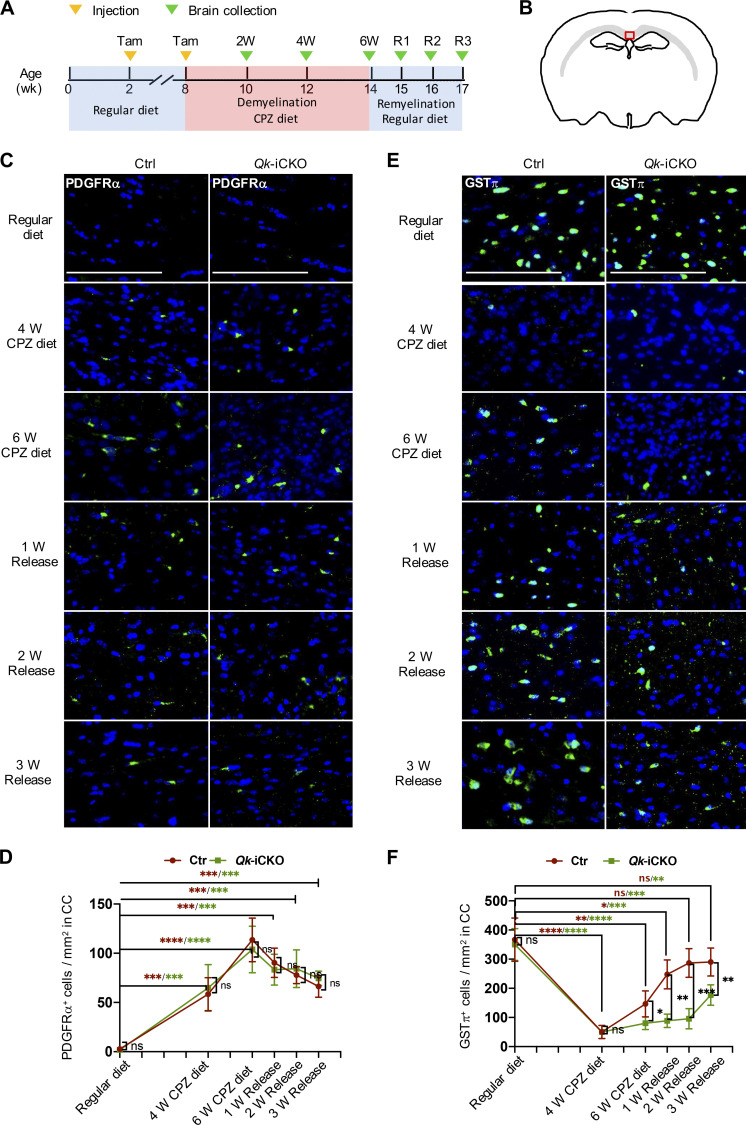
Figure 6. Persistent myelin debris in the Qki-depleted mice delays differentiation of OPCs to myelinating oligodendrocytes. (A) Schema representing the strategy of animal treatment and sample collection. Tam, tamoxifen. (B) Schema representing examined coronal section of the mouse brain. The red boxed area of the caudal CC was analyzed (modified from Sidman, High Resolution Mouse Brain Atlas; Sidman et al., 1999) in C–F. (C and D) Representative images of IF and quantification of PDGFRα in the CCs of 8-wk-old Qk-iCKO and control (Ctrl) mice with tamoxifen injection followed by either 4- or 6-wk administration of the CPZ diet or 6-wk administration of the CPZ diet and then 1, 2, or 3 wk of the regular diet. (E and F) Representative images of IF and quantification of GSTπ in the same regions described in C. n = 4/group. Scale bars: 100 µm. Data are means ± SD. Statistics were calculated using two-way ANOVA with Tukey’s post hoc tests (D and F). *, P < 0.05; **, P < 0.01; ***, P < 0.001; ****, P < 0.0001. ns, not significant.
Figure 6. Persistent myelin debris in the Qki-depleted mice delays differentiation of OPCs to myelinating oligodendrocytes. (A) Schema representing the strategy of animal treatment and sample collection. Tam, tamoxifen. (B) Schema representing examined coronal section of the mouse brain. The red boxed area of the caudal CC was analyzed (modified from Sidman, High Resolution Mouse Brain Atlas; Sidman et al., 1999) in C–F. (C and D) Representative images of IF and quantification of PDGFRα in the CCs of 8-wk-old Qk-iCKO and control (Ctrl) mice with tamoxifen injection followed by either 4- or 6-wk administration of the CPZ diet or 6-wk administration of the CPZ diet and then 1, 2, or 3 wk of the regular diet. (E and F) Representative images of IF and quantification of GSTπ in the same regions described in C. n = 4/group. Scale bars: 100 µm. Data are means ± SD. Statistics were calculated using two-way ANOVA with Tukey’s post hoc tests (D and F). *, P < 0.05; **, P < 0.01; ***, P < 0.001; ****, P < 0.0001. ns, not significant.CC BY-NC-SA · PubMed Central

Verification

Claims the paper makes

The claims and statistics of this paper haven’t been checked yet.

Run the check — free, no account needed. It reads the open-access text and checks the sources it cites.

A few free checks a day · papers already verified open instantly · results are public

Claims other papers make about this one

Each is checked against this paper’s own text: does it say what the citing paper says it does?

Self-check

Percentages, sums and reported differences re-computed from the paper’s own numbers.

The self-check needs the paper’s full text.

Citations

Cites

Research works printed but not linked: 48

  1. Åberg, 2006, Human QKI, a new candidate gene for schizophrenia involved in myelination, Am. J. Med. Genet. B. Neuropsychiatr. Genet, 141B, 84, 10.1002/ajmg.b.30243 · DOI
  2. Aguzzi, 2013, Microglia: scapegoat, saboteur, or something else?, Science, 339, 156, 10.1126/science.1227901 · DOI · Paper page
  3. Ajami, 2007, Local self-renewal can sustain CNS microglia maintenance and function throughout adult life, Nat. Neurosci, 10, 1538, 10.1038/nn2014 · DOI · Paper page
  4. Arandjelovic, 2015, Phagocytosis of apoptotic cells in homeostasis, Nat. Immunol, 16, 907, 10.1038/ni.3253 · DOI · Paper page
  5. Bhasin, 2007, Modulation of microglial/macrophage activation by macrophage inhibitory factor (TKP) or tuftsin (TKPR) attenuates the disease course of experimental autoimmune encephalomyelitis, BMC Immunol, 8, 10, 10.1186/1471-2172-8-10 · DOI
  6. Cantuti-Castelvetri, 2018, Defective cholesterol clearance limits remyelination in the aged central nervous system, Science, 359, 684, 10.1126/science.aan4183 · DOI · Paper page
  7. Chen, 2007, The selective RNA-binding protein quaking I (QKI) is necessary and sufficient for promoting oligodendroglia differentiation, J. Biol. Chem, 282, 23553, 10.1074/jbc.M702045200 · DOI
  8. Chen, 2012, STAR RNA-binding protein Quaking suppresses cancer via stabilization of specific miRNA, Genes Dev, 26, 1459, 10.1101/gad.189001.112 · DOI
  9. Chénard, 2008, New implications for the QUAKING RNA binding protein in human disease, J. Neurosci. Res, 86, 233, 10.1002/jnr.21485 · DOI
  10. Colonna, 2017, Microglia Function in the Central Nervous System During Health and Neurodegeneration, Annu. Rev. Immunol, 35, 441, 10.1146/annurev-immunol-051116-052358 · DOI · Paper page
  11. Conn, 2015, The RNA binding protein quaking regulates formation of circRNAs, Cell, 160, 1125, 10.1016/j.cell.2015.02.014 · DOI
  12. Darbelli, 2016, Emerging functions of the Quaking RNA-binding proteins and link to human diseases, Wiley Interdiscip. Rev. RNA, 7, 399, 10.1002/wrna.1344 · DOI
  13. de Bruin, 2016, Quaking promotes monocyte differentiation into pro-atherogenic macrophages by controlling pre-mRNA splicing and gene expression, Nat. Commun, 7, 10846, 10.1038/ncomms10846 · DOI
  14. Fu, 2012, The RNA-binding protein QKI5 is a direct target of C/EBPα and delays macrophage differentiation, Mol. Biol. Cell, 23, 1628, 10.1091/mbc.e11-05-0412 · DOI
  15. Fu, 2014, Phagocytosis of microglia in the central nervous system diseases, Mol. Neurobiol, 49, 1422, 10.1007/s12035-013-8620-6 · DOI
  16. Fujimoto, 2013, Imaging lipid droplets by electron microscopy, Methods Cell Biol, 116, 227, 10.1016/B978-0-12-408051-5.00012-7 · DOI
  17. Galarneau, 2005, Target RNA motif and target mRNAs of the Quaking STAR protein, Nat. Struct. Mol. Biol, 12, 691, 10.1038/nsmb963 · DOI
  18. Gao, 2011, Animal Models of MS Reveal Multiple Roles of Microglia in Disease Pathogenesis, Neurol. Res. Int, 2011, 10.1155/2011/383087 · DOI
  19. Han, 2012, Janus-like opposing roles of CD47 in autoimmune brain inflammation in humans and mice, J. Exp. Med, 209, 1325, 10.1084/jem.20101974 · DOI · Paper page
  20. Han, 2017, Contributions of triggering-receptor-expressed-on-myeloid-cells-2 to neurological diseases, Int. J. Neurosci, 127, 368, 10.1080/00207454.2016.1264072 · DOI · Paper page
  21. Janda, 2018, Microglial Phagocytosis and Its Regulation: A Therapeutic Target in Parkinson’s Disease?, Front. Mol. Neurosci, 11, 144, 10.3389/fnmol.2018.00144 · DOI
  22. Kondo, 1987, Blood-brain barrier permeability to horseradish peroxidase in twitcher and cuprizone-intoxicated mice, Brain Res, 425, 186, 10.1016/0006-8993(87)90499-9 · DOI · Paper page
  23. Krasemann, 2017, The TREM2-APOE Pathway Drives the Transcriptional Phenotype of Dysfunctional Microglia in Neurodegenerative Diseases, Immunity, 47, 566, 10.1016/j.immuni.2017.08.008 · DOI · Paper page
  24. Kuda, 2013, Sulfo-N-succinimidyl oleate (SSO) inhibits fatty acid uptake and signaling for intracellular calcium via binding CD36 lysine 164: SSO also inhibits oxidized low density lipoprotein uptake by macrophages, J. Biol. Chem, 288, 15547, 10.1074/jbc.M113.473298 · DOI
  25. Larocque, 2002, Nuclear retention of MBP mRNAs in the quaking viable mice, Neuron, 36, 815, 10.1016/S0896-6273(02)01055-3 · DOI
  26. Lenz, 2018, Microglia and Beyond: Innate Immune Cells As Regulators of Brain Development and Behavioral Function, Front. Immunol, 9, 698, 10.3389/fimmu.2018.00698 · DOI
  27. Li, 2018, Microglia and macrophages in brain homeostasis and disease, Nat. Rev. Immunol, 18, 225, 10.1038/nri.2017.125 · DOI · Paper page
  28. Li, 2000, Destabilization and mislocalization of myelin basic protein mRNAs in quaking dysmyelination lacking the QKI RNA-binding proteins, J. Neurosci, 20, 4944, 10.1523/JNEUROSCI.20-13-04944.2000 · DOI
  29. Linehan, 2014, Aging impairs peritoneal but not bone marrow-derived macrophage phagocytosis, Aging Cell, 13, 699, 10.1111/acel.12223 · DOI
  30. Liu, 2015, Microglial Hv1 proton channel promotes cuprizone-induced demyelination through oxidative damage, J. Neurochem, 135, 347, 10.1111/jnc.13242 · DOI
  31. Luo, 2017, The role of microglia in multiple sclerosis, Neuropsychiatr. Dis. Treat, 13, 1661, 10.2147/NDT.S140634 · DOI · Paper page
  32. Meerbrey, 2011, The pINDUCER lentiviral toolkit for inducible RNA interference in vitro and in vivo, Proc. Natl. Acad. Sci. USA, 108, 3665, 10.1073/pnas.1019736108 · DOI
  33. Miron, 2011, Cells of the oligodendroglial lineage, myelination, and remyelination, Biochim. Biophys. Acta, 1812, 184, 10.1016/j.bbadis.2010.09.010 · DOI
  34. Muzio, 2007, Multifaceted aspects of inflammation in multiple sclerosis: the role of microglia, J. Neuroimmunol, 191, 39, 10.1016/j.jneuroim.2007.09.016 · DOI
  35. Natrajan, 2015, Retinoid X receptor activation reverses age-related deficiencies in myelin debris phagocytosis and remyelination, Brain, 138, 3581, 10.1093/brain/awv289 · DOI
  36. Neumann, 2009, Debris clearance by microglia: an essential link between degeneration and regeneration, Brain, 132, 288, 10.1093/brain/awn109 · DOI · Paper page
  37. Parkhurst, 2013, Microglia promote learning-dependent synapse formation through brain-derived neurotrophic factor, Cell, 155, 1596, 10.1016/j.cell.2013.11.030 · DOI · Paper page
  38. Popescu, 2013, Pathology of multiple sclerosis: where do we stand?, Continuum (Minneap. Minn.), 19, 901
  39. Raine, 1981, Multiple sclerosis. Oligodendrocyte survival and proliferation in an active established lesion, Lab. Invest, 45, 534
  40. Rolfe, 2017, In Vitro Phagocytosis of Myelin Debris by Bone Marrow-Derived Macrophages, J. Vis. Exp, 10.3791/56322 · DOI
  41. Rosales, 2017, Phagocytosis: A Fundamental Process in Immunity, BioMed Res. Int, 2017, 10.1155/2017/9042851 · DOI
  42. Sardiello, 2009, A gene network regulating lysosomal biogenesis and function, Science, 325, 473, 10.1126/science.1174447 · DOI · Paper page
  43. Settembre, 2013, Signals from the lysosome: a control centre for cellular clearance and energy metabolism, Nat. Rev. Mol. Cell Biol, 14, 283, 10.1038/nrm3565 · DOI
  44. Shingu, 2017, Qki deficiency maintains stemness of glioma stem cells in suboptimal environment by downregulating endolysosomal degradation, Nat. Genet, 49, 75, 10.1038/ng.3711 · DOI
  45. Sidman, 1964, Mutant Mice (Quaking and Jimpy) with Deficient Myelination in the Central Nervous System, Science, 144, 309, 10.1126/science.144.3616.309 · DOI
  46. Uribe-Querol, 2017, Control of Phagocytosis by Microbial Pathogens, Front. Immunol, 8, 1368, 10.3389/fimmu.2017.01368 · DOI
  47. Wang, 2015, miR-29a promotes scavenger receptor A expression by targeting QKI (quaking) during monocyte-macrophage differentiation, Biochem. Biophys. Res. Commun, 464, 1, 10.1016/j.bbrc.2015.05.019 · DOI
  48. Zhou, 2020, Mature myelin maintenance requires Qki to coactivate PPARβ-RXRα-mediated lipid metabolism, J. Clin. Invest, 130, 2220, 10.1172/JCI131800 · DOI

Cited by

Sorted by citations

See all 36

Metadata

Authors
Ren, J., Dai, C., Zhou, X., Barnes, J. A., Chen, X., Wang, Y., Yuan, L., Shingu, T., Heimberger, A. B., Chen, Y., & Hu, J.
Affiliations
  • Department of Cancer Biology, The University of Texas MD Anderson Cancer Center, Houston, TX 1
  • Department of Melanoma Medical Oncology, The University of Texas MD Anderson Cancer Center, Houston, TX 5
  • Department of Neurosurgery, The University of Texas MD Anderson Cancer Center, Houston, TX 7
  • Department of Bioinformatics and Computational Biology, The University of Texas MD Anderson Cancer Center, Houston, TX 8
Venue
Journal of Experimental Medicine
Published
2020-10-06
Volume
218
Issue
1
ISSN
  • 0022-1007
  • 1540-9538
Cited by
36
References
17
Language
en
Funders
  • National Institutes of Health (CA120813)
  • National Cancer Institute (P30CA016672, R37CA214800)
  • National Multiple Sclerosis Society
  • Cancer Prevention and Research Institute of Texas (RP120348, RP170002)
  • American Cancer Society (RSG-17-029-01-CSM)
  • Sontag Foundation
  • Brockman Foundation
  • MD Anderson

About these checks

Registry, retraction, Cites and statistics results are computed, not judged, with one exception: a printed reference that no index lists is read once by a model before it counts as a citation error. Claims are extracted by a model and kept only when their quote appears verbatim in the text; each cited source is then checked, with a model’s help, for whether it says what the claim relies on. Those verdicts can be wrong — read the claim’s quote and the cited source before relying on one.

Statistics and arithmetic are recomputed, not judged.

Confidence bands are shown only for fields calibrated on our annotated test set. None is calibrated yet, so no band is shown.

What counts as a claim ›How we measure confidence ›How we check this ›

Are you an author, or do you see a problem with this page? Request a review