Cited by 75

The DOI matches its Crossref record; 2 of the 2 references it cites were found in a registry or an index.

Lineage‐specific regulation of inducible and constitutive mast cells in allergic airway inflammation

Derakhshan, Tahereh, Samuchiwal, Sachin K., Hallen, Nils, Bankova, Lora G., Boyce, Joshua A., Barrett, Nora A., Austen, K. Frank, Dwyer, Daniel F.·2021·Journal of Experimental Medicine

Abstract

Murine mast cells (MCs) contain two lineages: inducible bone marrow–derived mucosal MCs (MMCs) and constitutive embryonic-derived connective tissue MCs (CTMCs). Here, we use RNA sequencing, flow cytometry, and genetic deletion in two allergic lung inflammation models to define these two lineages. We found that inducible MCs, marked by β7 integrin expression, are highly distinct from airway CTMCs at rest and during inflammation and unaffected by targeted CTMC deletion. β7High MCs expand and mature during lung inflammation as part of a TGF-β–inducible transcriptional program that includes the MMC-associated proteases Mcpt1 and Mcpt2, the basophil-associated protease Mcpt8, granule components, and the epithelial-binding αE integrin. In vitro studies using bone marrow–derived MCs (BMMCs) identified a requirement for SCF in this TGF-β–mediated development and found that epithelial cells directly elicit TGF-β–dependent BMMC up-regulation of mMCP-1 and αE integrin. Thus, our findings characterize the expansion of a distinct inducible MC subset in C57BL/6 mice and highlight the potential for epithelium to direct MMC development.

Overview

The claims and statistics of this paper haven’t been checked yet.

Run the check — free, no account needed. It reads the open-access text and checks the sources it cites.

A few free checks a day · papers already verified open instantly · results are public

Integrity signals

Registry

Crossref · 10.1084/jem.20200321

Cites

2 of 2 references verified0 citation errors · 0 not checkable

Statistics

Figures

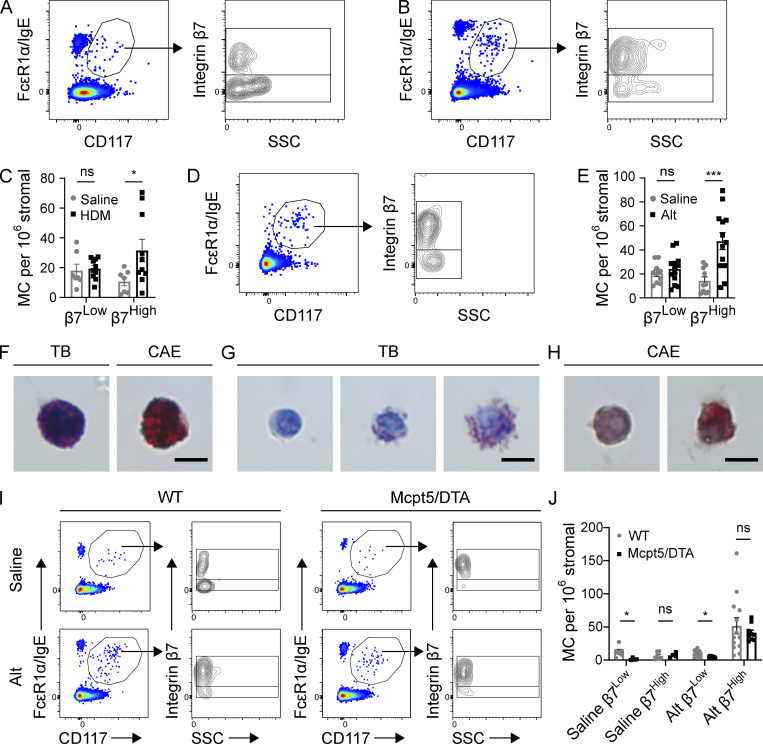
Figure 1. Aeroallergen challenges induce the expansion of β7High MCs in C57BL/6 mice. (A) Representative flow plots showing airway MCs in naive mice, pregated on CD45+ Lin− (CD4, CD8, CD19, CD11b, CD11c) cells (left), further subdivided by β7 integrin and SSC (right). Flow plots are representative of three independent experiments. (B) Representative flow plots showing airway MCs from the lungs of mice challenged twice per week for 3 wk with 3 µg HDM extract and sacrificed 24 h after the final challenge, pregated on CD45+ Lin− cells. Flow plots are representative of three independent experiments. (C) Quantification of β7Low and β7High MCs in mice challenged with saline ± HDM as in Fig. 1 B. Data from three independent experiments, n = 6–9 mice per group. *, P < 0.05 (t test); ns, not significant. (D) Representative flow plot showing composition of the MC compartment in the lungs of mice sensitized with 30 µg Alt on day 0, challenged twice with 3 µg Alt on days 9 and 10, and sacrificed 48 h after the final challenge. Flow plots are representative of three independent experiments. (E) Quantification of β7Low and β7High MCs in mice sensitized with either saline or 30 µg Alt and challenged twice with 3 µg Alt, as in Fig. 1 D. Data from three independent experiments, n = 6–9 mice per group. ***, P < 0.001 (t test). (F) Representative images of TB and CAE staining on β7Low airway MCs sorted from C57BL/6 mice following HDM challenge. Scale bar = 5 µm. (G) Representative images of TB staining for β7High airway MCs sorted from C57BL/6 mice following HDM challenge (multiple images shown to display heterogeneity). Scale bar = 5 µm. (H) Representative images of CAE staining for β7High MCs sorted from C57BL/6 mice following HDM challenge (multiple images shown to display heterogeneity). Scale bar = 5 µm. (I) Representative flow plots of airway MCs in littermate WT control or mMCP-5/DTA mice sensitized with either saline or 30 µg Alt, challenged twice with 3 µg Alt, and sacrificed 48 h after the final challenge. (J) Quantification of airway β7High and β7Low MCs in WT and Mcpt5/DTA mice relative to stromal cells in mice sensitized with either saline or 30 µg Alt and challenged twice with 3 µg Alt. Data from three independent experiments, n = 4–12 mice per group. *, P < 0.05 (t test).
Figure 1. Aeroallergen challenges induce the expansion of β7High MCs in C57BL/6 mice. (A) Representative flow plots showing airway MCs in naive mice, pregated on CD45+ Lin− (CD4, CD8, CD19, CD11b, CD11c) cells (left), further subdivided by β7 integrin and SSC (right). Flow plots are representative of three independent experiments. (B) Representative flow plots showing airway MCs from the lungs of mice challenged twice per week for 3 wk with 3 µg HDM extract and sacrificed 24 h after the final challenge, pregated on CD45+ Lin− cells. Flow plots are representative of three independent experiments. (C) Quantification of β7Low and β7High MCs in mice challenged with saline ± HDM as in Fig. 1 B. Data from three independent experiments, n = 6–9 mice per group. *, P < 0.05 (t test); ns, not significant. (D) Representative flow plot showing composition of the MC compartment in the lungs of mice sensitized with 30 µg Alt on day 0, challenged twice with 3 µg Alt on days 9 and 10, and sacrificed 48 h after the final challenge. Flow plots are representative of three independent experiments. (E) Quantification of β7Low and β7High MCs in mice sensitized with either saline or 30 µg Alt and challenged twice with 3 µg Alt, as in Fig. 1 D. Data from three independent experiments, n = 6–9 mice per group. ***, P < 0.001 (t test). (F) Representative images of TB and CAE staining on β7Low airway MCs sorted from C57BL/6 mice following HDM challenge. Scale bar = 5 µm. (G) Representative images of TB staining for β7High airway MCs sorted from C57BL/6 mice following HDM challenge (multiple images shown to display heterogeneity). Scale bar = 5 µm. (H) Representative images of CAE staining for β7High MCs sorted from C57BL/6 mice following HDM challenge (multiple images shown to display heterogeneity). Scale bar = 5 µm. (I) Representative flow plots of airway MCs in littermate WT control or mMCP-5/DTA mice sensitized with either saline or 30 µg Alt, challenged twice with 3 µg Alt, and sacrificed 48 h after the final challenge. (J) Quantification of airway β7High and β7Low MCs in WT and Mcpt5/DTA mice relative to stromal cells in mice sensitized with either saline or 30 µg Alt and challenged twice with 3 µg Alt. Data from three independent experiments, n = 4–12 mice per group. *, P < 0.05 (t test).CC BY-NC-SA · PubMed Central
Figure S1. Gating strategy used for the identification of MCs within the lower airways of C57BL/6 mice. After doublet exclusion, MCs were identified as CD45 positive, Lineage (CD4, CD8, CD19, CD11b, CD11c) negative, FcεR1α positive, and CD117 positive. FSC, forward scatter; SSC, side scatter.
Figure S1. Gating strategy used for the identification of MCs within the lower airways of C57BL/6 mice. After doublet exclusion, MCs were identified as CD45 positive, Lineage (CD4, CD8, CD19, CD11b, CD11c) negative, FcεR1α positive, and CD117 positive. FSC, forward scatter; SSC, side scatter.CC BY-NC-SA · PubMed Central
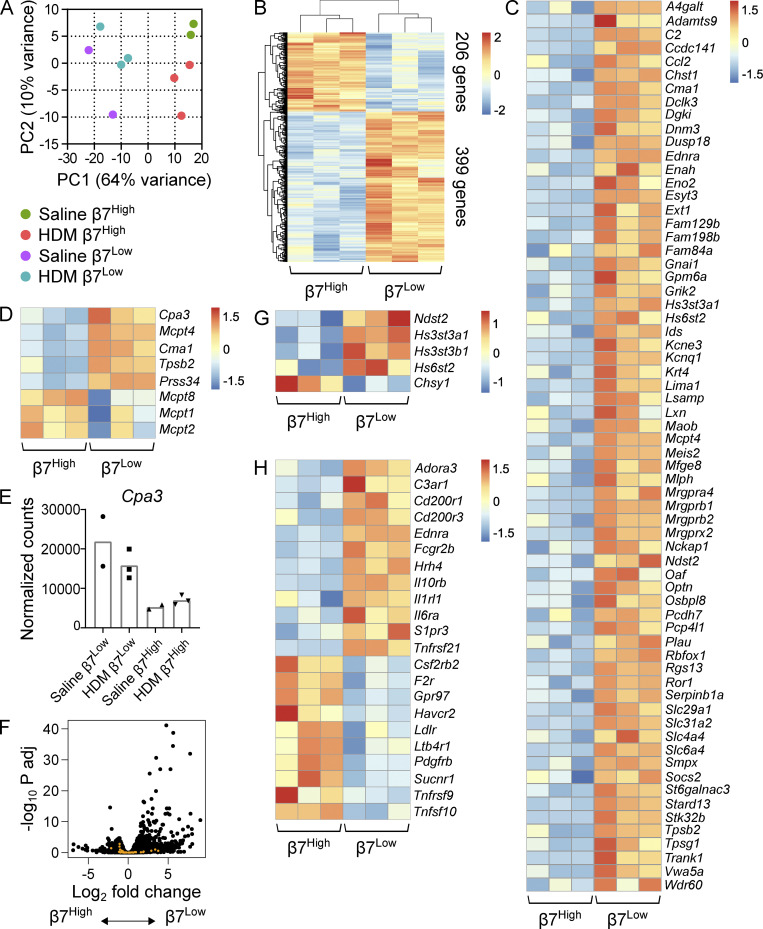
Figure 2. β7High MCs are transcriptionally distinct from constitutive β7Low MCs. (A) Principal component plot of β7Low and β7High MCs sorted from the combined lung and trachea of mice challenged with either saline or 3 µg HDM extract twice per week for 3 wk and sacrificed 24 h after the final challenge. Percentages indicate the level of variance described by each component. Colored circles denote biological replicates (two to three per group), with each replicate consisting of cells pooled from three mice to minimize individual variability. Each replicate is the result of an independent experiment. (B) Heatmap showing all transcripts differentially expressed between β7Low and β7High MCs following repeated HDM challenge (FDR < 0.1, DESeq2). Each replicate is pooled from three mice and derived from an independent experiment; scale bar indicates z score. (C) Heatmap showing transcripts found in the ImmGen CTMC signature that were differentially expressed between β7Low and β7High MCs following HDM challenge (FDR < 0.1, DESeq2). Each replicate is pooled from three mice and derived from an independent experiment; scale bar indicates z score. (D) Heatmap showing differentially expressed MCPs in sorted β7Low and β7High subsets following HDM challenge (FDR < 0.1 with the exception of Mcpt1 and Mcpt2, DESeq2). Each replicate is pooled from three mice and derived from an independent experiment; scale bar indicates z score. (E) Normalized counts indicating Cpa3 expression in constitutive β7Low MCs and inducible β7High MCs. (F) Volcano plot of differential gene expression between β7High and β7Low MCs (black) with overlay of ImmGen basophil signature genes (orange). (G) Heatmap representation of differentially expressed glycose-aminoglycan biosynthetic enzymes in sorted β7Low and β7High subsets following HDM challenge (FDR < 0.1). Each replicate is pooled from three mice and derived from an independent experiment. (H) Heatmap indicating differentially expressed cell surface receptors in sorted β7Low and β7High subsets following HDM challenge (FDR < 0.1, DESeq2). Each replicate is pooled from three mice and derived from an independent experiment; scale bar indicates z score.
Figure 2. β7High MCs are transcriptionally distinct from constitutive β7Low MCs. (A) Principal component plot of β7Low and β7High MCs sorted from the combined lung and trachea of mice challenged with either saline or 3 µg HDM extract twice per week for 3 wk and sacrificed 24 h after the final challenge. Percentages indicate the level of variance described by each component. Colored circles denote biological replicates (two to three per group), with each replicate consisting of cells pooled from three mice to minimize individual variability. Each replicate is the result of an independent experiment. (B) Heatmap showing all transcripts differentially expressed between β7Low and β7High MCs following repeated HDM challenge (FDR < 0.1, DESeq2). Each replicate is pooled from three mice and derived from an independent experiment; scale bar indicates z score. (C) Heatmap showing transcripts found in the ImmGen CTMC signature that were differentially expressed between β7Low and β7High MCs following HDM challenge (FDR < 0.1, DESeq2). Each replicate is pooled from three mice and derived from an independent experiment; scale bar indicates z score. (D) Heatmap showing differentially expressed MCPs in sorted β7Low and β7High subsets following HDM challenge (FDR < 0.1 with the exception of Mcpt1 and Mcpt2, DESeq2). Each replicate is pooled from three mice and derived from an independent experiment; scale bar indicates z score. (E) Normalized counts indicating Cpa3 expression in constitutive β7Low MCs and inducible β7High MCs. (F) Volcano plot of differential gene expression between β7High and β7Low MCs (black) with overlay of ImmGen basophil signature genes (orange). (G) Heatmap representation of differentially expressed glycose-aminoglycan biosynthetic enzymes in sorted β7Low and β7High subsets following HDM challenge (FDR < 0.1). Each replicate is pooled from three mice and derived from an independent experiment. (H) Heatmap indicating differentially expressed cell surface receptors in sorted β7Low and β7High subsets following HDM challenge (FDR < 0.1, DESeq2). Each replicate is pooled from three mice and derived from an independent experiment; scale bar indicates z score.CC BY-NC-SA · PubMed Central
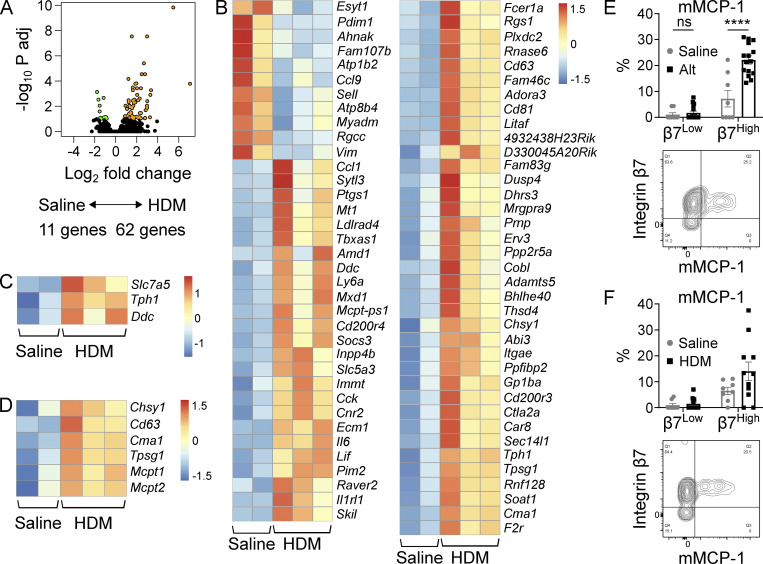
Figure 3. The β7High MC transcriptome dynamically changes in response to allergic inflammation. (A) Volcano plot indicating differentially expressed transcripts (FDR < 0.1) between β7High MCs isolated from the lungs of mice challenged twice per week for 3 wk with saline (n = 2) or HDM (n = 3). Transcripts highlighted in orange (62 genes) are enriched in MCs from HDM-challenged mice, and transcripts highlighted in green (11 genes) are enriched in MCs from saline-challenged mice. Adj, adjusted. (B) Heatmap showing differentially expressed transcripts between β7High MCs isolated from the lungs of mice challenged with saline or HDM (FDR < 0.1, DESeq2). Each replicate is pooled from three mice and derived from an independent experiment; scale bar indicates z score. (C) Heatmap showing differentially expressed serotonin biosynthetic components between β7High MCs isolated from the lungs of mice challenged with saline or HDM (FDR < 0.1, DESeq2). Each replicate is pooled from three mice and derived from an independent experiment; scale bar indicates z score. (D) Heatmap showing differentially expressed granule components and proteases between β7High MCs isolated from the lungs of mice challenged with saline or HDM (FDR < 0.1 with the exception of Mcpt1 and Mcpt2, DESeq2). Each replicate is pooled from three mice and derived from an independent experiment; scale bar indicates z score. (E) Quantification of mMCP-1 expression in β7Low and β7High airway MCs following sensitization with saline or 30 µg Alt on day 0 and challenge with 30 µg Alt on days 9 and 10, sacrificed 48 h after the final challenge (top), with representative flow plot (bottom). Data from three independent experiments, n = 8–15 mice per group. ****, P < 0.0001 (t test); ns, not significant. (F) Quantification of mMCP-1 expression in β7Low and β7High airway MCs following challenge with saline or 10 µg HDM twice per week for 3 wk (top) with representative flow plot (bottom). Data from four independent experiments, n = 8–11 mice per group. ns, not significant (t test).
Figure 3. The β7High MC transcriptome dynamically changes in response to allergic inflammation. (A) Volcano plot indicating differentially expressed transcripts (FDR < 0.1) between β7High MCs isolated from the lungs of mice challenged twice per week for 3 wk with saline (n = 2) or HDM (n = 3). Transcripts highlighted in orange (62 genes) are enriched in MCs from HDM-challenged mice, and transcripts highlighted in green (11 genes) are enriched in MCs from saline-challenged mice. Adj, adjusted. (B) Heatmap showing differentially expressed transcripts between β7High MCs isolated from the lungs of mice challenged with saline or HDM (FDR < 0.1, DESeq2). Each replicate is pooled from three mice and derived from an independent experiment; scale bar indicates z score. (C) Heatmap showing differentially expressed serotonin biosynthetic components between β7High MCs isolated from the lungs of mice challenged with saline or HDM (FDR < 0.1, DESeq2). Each replicate is pooled from three mice and derived from an independent experiment; scale bar indicates z score. (D) Heatmap showing differentially expressed granule components and proteases between β7High MCs isolated from the lungs of mice challenged with saline or HDM (FDR < 0.1 with the exception of Mcpt1 and Mcpt2, DESeq2). Each replicate is pooled from three mice and derived from an independent experiment; scale bar indicates z score. (E) Quantification of mMCP-1 expression in β7Low and β7High airway MCs following sensitization with saline or 30 µg Alt on day 0 and challenge with 30 µg Alt on days 9 and 10, sacrificed 48 h after the final challenge (top), with representative flow plot (bottom). Data from three independent experiments, n = 8–15 mice per group. ****, P < 0.0001 (t test); ns, not significant. (F) Quantification of mMCP-1 expression in β7Low and β7High airway MCs following challenge with saline or 10 µg HDM twice per week for 3 wk (top) with representative flow plot (bottom). Data from four independent experiments, n = 8–11 mice per group. ns, not significant (t test).CC BY-NC-SA · PubMed Central
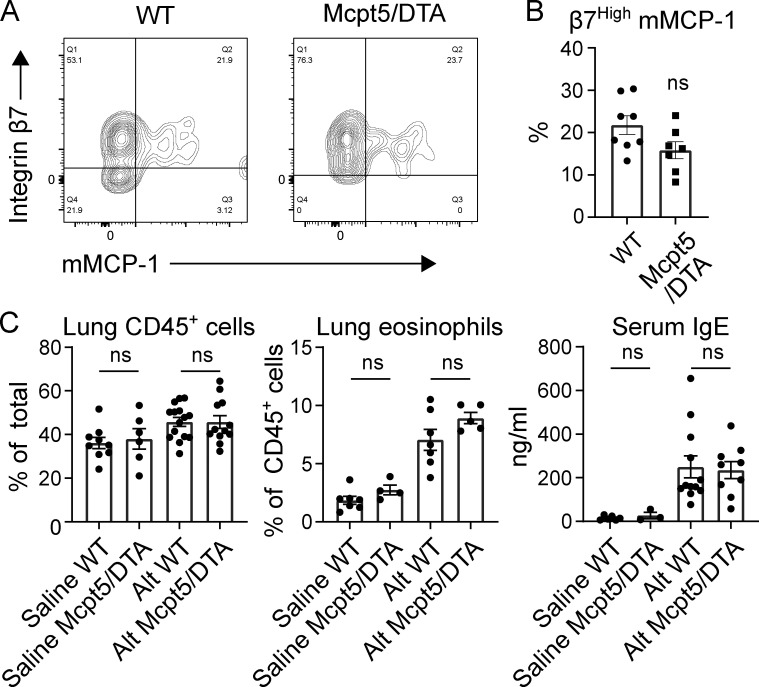
Figure 4. CTMC deletion does not affect β7High MC development or type 2 inflammatory state. (A) Representative flow plots of intracellular mMCP-1 expression in airway MCs in WT (left) versus littermate Mcpt5/DTA (right) mice following sensitization with saline or 30 µg Alt on day 0 and challenge with 3 µg Alt on days 9 and 10, sacrificed 48 h after the final challenge. Data are representative of three independent experiments. (B) Quantification of β7High MC mMCP-1 expression in WT versus Mcpt5/DTA mice sensitized and challenged with Alt as in Fig. 4 A. Data from three independent experiments, n = 7–8 mice per group. No significant difference was observed between genotypes. ns, not significant (t test). (C) Flow cytometric quantification of lung CD45+ cell concentration as a percentage of total cells (left), lung eosinophilia as a percentage of total CD45+ cells (center), and serum IgE concentration (right) in WT versus Mcpt5/DTA mice with saline or 30 µg Alt on day 0 and challenge with 3 µg Alt on days 9 and 10, sacrificed 48 h after the final challenge. Data from two (eosinophils) or three (CD45+, IgE) independent experiments, n = 3–15 mice per group. ns, not significant (t test).
Figure 4. CTMC deletion does not affect β7High MC development or type 2 inflammatory state. (A) Representative flow plots of intracellular mMCP-1 expression in airway MCs in WT (left) versus littermate Mcpt5/DTA (right) mice following sensitization with saline or 30 µg Alt on day 0 and challenge with 3 µg Alt on days 9 and 10, sacrificed 48 h after the final challenge. Data are representative of three independent experiments. (B) Quantification of β7High MC mMCP-1 expression in WT versus Mcpt5/DTA mice sensitized and challenged with Alt as in Fig. 4 A. Data from three independent experiments, n = 7–8 mice per group. No significant difference was observed between genotypes. ns, not significant (t test). (C) Flow cytometric quantification of lung CD45+ cell concentration as a percentage of total cells (left), lung eosinophilia as a percentage of total CD45+ cells (center), and serum IgE concentration (right) in WT versus Mcpt5/DTA mice with saline or 30 µg Alt on day 0 and challenge with 3 µg Alt on days 9 and 10, sacrificed 48 h after the final challenge. Data from two (eosinophils) or three (CD45+, IgE) independent experiments, n = 3–15 mice per group. ns, not significant (t test).CC BY-NC-SA · PubMed Central
Figure S2. Gating strategy used for the identification of eosinophils within the lower airways of WT and MCpt5/DTA mice during allergic lung inflammation. Eos, eosinophils; FSC, forward scatter; SSC, side scatter.
Figure S2. Gating strategy used for the identification of eosinophils within the lower airways of WT and MCpt5/DTA mice during allergic lung inflammation. Eos, eosinophils; FSC, forward scatter; SSC, side scatter.CC BY-NC-SA · PubMed Central
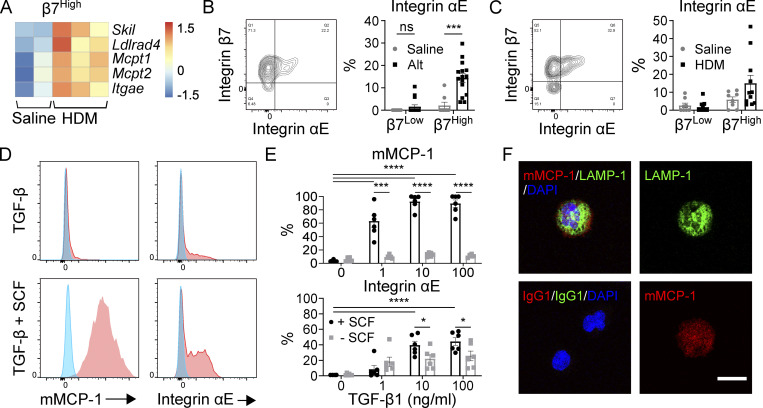
Figure 5. The β7High MC maturation phenotype can be elicited in vitro through SCF-dependent TGF-β stimulus of BMMCs. (A) Heatmap of TGF-β target genes up-regulated in β7High MCs from the lungs of saline-challenged versus HDM-challenged mice. Skil, Ldlrad4, and Itgae are significantly differentially expressed with an FDR < 0.1; all transcripts are differentially expressed with P < 0.05 (DESeq2). Each replicate is pooled from three mice and derived from an independent experiment. (B) Representative flow plot of MC surface αE integrin (left) and quantification of αE integrin expression in β7Low and β7High MCs (right) following sensitization with saline or 30 µg Alt on day 0 and challenge with 30 µg Alt on days 9 and 10, sacrificed 48 h after the final challenge. Data from three independent experiments, n = 8–15. ***, P < 0.001 (t test); ns, not significant. (C) Representative flow plot of MC surface αE integrin (left) and quantification of αE integrin expression in β7Low and β7High MCs (right) following twice-weekly challenge with saline or 10 µg HDM. Dots are from four independent experiments, n = 8–11 mice per group. (D) Representative flow plots of mMCP-1 (left) and αE integrin (right) expression in BMMCs grown and maintained in IL-3 following treatment with saline (blue) or 10 ng/ml TGF-β1 (red) in the absence of SCF (top) or in combination with 100 ng/ml SCF (bottom) for 7 d. Data are representative of three independent experiments. (E) Quantification of BMMC mMCP-1 protein expression (top) and αE integrin expression (bottom) in response to a dose range of TGF-β1 treatments with or without 100 ng/ml SCF. Data from two independent experiments, n = 6. *, P < 0.05; ***, P < 0.001; ****, P < 0.0001 (Dunnett’s multiple comparisons test used to compare all doses to zero; t test used to evaluate influence of SCF at each dose of TGF-β1). (F) Confocal assessment of BMMC expression of the lysosome and granule-associated protein LAMP-1 (green) and mMCP-1 (red) with nucleus (blue) in BMMCs grown and maintained in IL-3 following treatment with 10 ng/ml TGF-β1 in combination with 100 ng/ml SCF for 7 d. Merged channels (upper left), isotype control (lower left), individual fluorescence channel for LAMP-1 (upper right), and mMCP-1 (lower right) are shown. Scale bar = 10 µm. Data representative of two independent experiments.
Figure 5. The β7High MC maturation phenotype can be elicited in vitro through SCF-dependent TGF-β stimulus of BMMCs. (A) Heatmap of TGF-β target genes up-regulated in β7High MCs from the lungs of saline-challenged versus HDM-challenged mice. Skil, Ldlrad4, and Itgae are significantly differentially expressed with an FDR < 0.1; all transcripts are differentially expressed with P < 0.05 (DESeq2). Each replicate is pooled from three mice and derived from an independent experiment. (B) Representative flow plot of MC surface αE integrin (left) and quantification of αE integrin expression in β7Low and β7High MCs (right) following sensitization with saline or 30 µg Alt on day 0 and challenge with 30 µg Alt on days 9 and 10, sacrificed 48 h after the final challenge. Data from three independent experiments, n = 8–15. ***, P < 0.001 (t test); ns, not significant. (C) Representative flow plot of MC surface αE integrin (left) and quantification of αE integrin expression in β7Low and β7High MCs (right) following twice-weekly challenge with saline or 10 µg HDM. Dots are from four independent experiments, n = 8–11 mice per group. (D) Representative flow plots of mMCP-1 (left) and αE integrin (right) expression in BMMCs grown and maintained in IL-3 following treatment with saline (blue) or 10 ng/ml TGF-β1 (red) in the absence of SCF (top) or in combination with 100 ng/ml SCF (bottom) for 7 d. Data are representative of three independent experiments. (E) Quantification of BMMC mMCP-1 protein expression (top) and αE integrin expression (bottom) in response to a dose range of TGF-β1 treatments with or without 100 ng/ml SCF. Data from two independent experiments, n = 6. *, P < 0.05; ***, P < 0.001; ****, P < 0.0001 (Dunnett’s multiple comparisons test used to compare all doses to zero; t test used to evaluate influence of SCF at each dose of TGF-β1). (F) Confocal assessment of BMMC expression of the lysosome and granule-associated protein LAMP-1 (green) and mMCP-1 (red) with nucleus (blue) in BMMCs grown and maintained in IL-3 following treatment with 10 ng/ml TGF-β1 in combination with 100 ng/ml SCF for 7 d. Merged channels (upper left), isotype control (lower left), individual fluorescence channel for LAMP-1 (upper right), and mMCP-1 (lower right) are shown. Scale bar = 10 µm. Data representative of two independent experiments.CC BY-NC-SA · PubMed Central
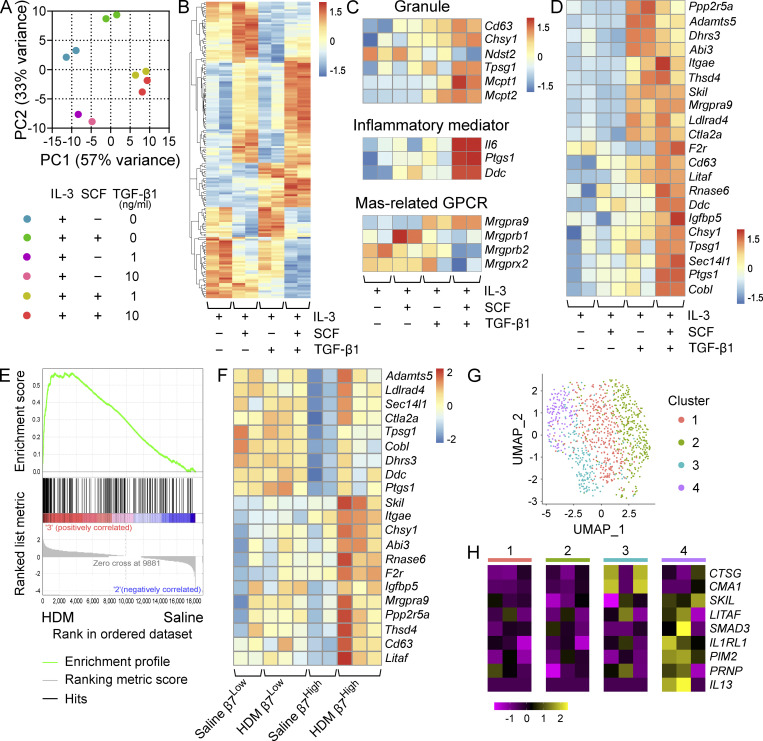
Figure 6. TGF-β signaling induces a MMC-like transcriptional profile in BMMCs. (A) PCA of BMMCs grown and maintained in IL-3 and treated with SCF alone, TGF-β1 alone, or SCF in combination with TGF-β1 at the indicated concentrations for 72 h. Replicates are from two independent experiments with separate donors. (B) Heatmap showing the 100 most variable genes in BMMCs grown and maintained in IL-3 and treated with SCF alone, TGF-β1 alone, or SCF in combination with TGF-β1 at 10 ng/ml. All transcripts are significantly differentially expressed, with an FDR < 0.1 (DESeq2). Columns indicate biological replicates from two independent experiments (red, high; blue, low). (C) Heatmap analysis of MC granule-associated proteins and proteases (top) inflammatory mediator transcripts (middle) and MRGPR-family genes (bottom) differentially expressed (FDR < 0.1, DESeq2) between BMMCs grown and maintained in IL-3 and treated with SCF or SCF in combination with TGF-β1 at 10 ng/ml. Samples maintained in IL-3 alone or treated with TGF-β1 alone are shown for reference. Columns indicate biological replicates from two independent experiments (red, high; blue, low). (D) Heatmap analysis of transcripts significantly up-regulated in β7High MCs from HDM-challenged mice relative to saline treatment (FDR < 0.1, DESeq2) expressed by BMMCs grown and maintained in IL-3 and treated with SCF or SCF in combination with TGF-β1 at 10 ng/ml. Columns indicate biological replicates from two independent experiments (red, high; blue, low). Samples maintained in IL-3 alone or treated with TGF-β1 alone are shown for reference. (E) Gene set enrichment analysis plot evaluating β7High MCs from HDM-challenged versus saline-challenged mice for a set of transcripts significantly up-regulated in BMMCs treated with SCF and TGF-β1 relative to SCF alone (FDR < 0.1, DESeq2). P = 0 (below the lower limit of reporting for gene set enrichment analysis). (F) Heatmap analysis of TGF-β-target transcripts identified in D in β7High and β7Low MCs from saline or HDM-challenged mice. All transcripts are significantly up-regulated in β7High MCs (FDR < 0.1, DESeq2), while none show significant changes in β7Low MCs. Columns indicate biological replicates from two independent experiments (red, high; blue, low). (G) Uniform manifold approximation and projection embedding of human distal lung MCs computationally pooled from three healthy donors, identifying four clusters of distal lung MCs. (H) Heatmap showing expression of MCTC-associated transcripts significantly enriched (Wilcoxon test) in cluster 3 (blue; CTSG: FDR < 3 × 10−79, CMA1: FDR < 7 × 10⁻¹⁵); select TGF-β–induced transcripts enriched in cluster 4 (purple; LITAF: FDR < 2 × 10⁻⁸, SKIL: P < 0.001, SMAD3: FDR < 5.2 × 10⁻⁵); transcripts up-regulated in murine β7High MCs enriched in cluster 4 (purple) in relation to all other clusters (IL1RL1: FDR < 2 × 10⁻¹⁴, PIM2: P < 5 × 10⁻⁵, PRNP: P < 10−6); and IL13, which although not statistically significant is presented because expression was not detected outside of cluster 4. Columns indicate average expression levels for each individual donor.
Figure 6. TGF-β signaling induces a MMC-like transcriptional profile in BMMCs. (A) PCA of BMMCs grown and maintained in IL-3 and treated with SCF alone, TGF-β1 alone, or SCF in combination with TGF-β1 at the indicated concentrations for 72 h. Replicates are from two independent experiments with separate donors. (B) Heatmap showing the 100 most variable genes in BMMCs grown and maintained in IL-3 and treated with SCF alone, TGF-β1 alone, or SCF in combination with TGF-β1 at 10 ng/ml. All transcripts are significantly differentially expressed, with an FDR < 0.1 (DESeq2). Columns indicate biological replicates from two independent experiments (red, high; blue, low). (C) Heatmap analysis of MC granule-associated proteins and proteases (top) inflammatory mediator transcripts (middle) and MRGPR-family genes (bottom) differentially expressed (FDR < 0.1, DESeq2) between BMMCs grown and maintained in IL-3 and treated with SCF or SCF in combination with TGF-β1 at 10 ng/ml. Samples maintained in IL-3 alone or treated with TGF-β1 alone are shown for reference. Columns indicate biological replicates from two independent experiments (red, high; blue, low). (D) Heatmap analysis of transcripts significantly up-regulated in β7High MCs from HDM-challenged mice relative to saline treatment (FDR < 0.1, DESeq2) expressed by BMMCs grown and maintained in IL-3 and treated with SCF or SCF in combination with TGF-β1 at 10 ng/ml. Columns indicate biological replicates from two independent experiments (red, high; blue, low). Samples maintained in IL-3 alone or treated with TGF-β1 alone are shown for reference. (E) Gene set enrichment analysis plot evaluating β7High MCs from HDM-challenged versus saline-challenged mice for a set of transcripts significantly up-regulated in BMMCs treated with SCF and TGF-β1 relative to SCF alone (FDR < 0.1, DESeq2). P = 0 (below the lower limit of reporting for gene set enrichment analysis). (F) Heatmap analysis of TGF-β-target transcripts identified in D in β7High and β7Low MCs from saline or HDM-challenged mice. All transcripts are significantly up-regulated in β7High MCs (FDR < 0.1, DESeq2), while none show significant changes in β7Low MCs. Columns indicate biological replicates from two independent experiments (red, high; blue, low). (G) Uniform manifold approximation and projection embedding of human distal lung MCs computationally pooled from three healthy donors, identifying four clusters of distal lung MCs. (H) Heatmap showing expression of MCTC-associated transcripts significantly enriched (Wilcoxon test) in cluster 3 (blue; CTSG: FDR < 3 × 10−79, CMA1: FDR < 7 × 10⁻¹⁵); select TGF-β–induced transcripts enriched in cluster 4 (purple; LITAF: FDR < 2 × 10⁻⁸, SKIL: P < 0.001, SMAD3: FDR < 5.2 × 10⁻⁵); transcripts up-regulated in murine β7High MCs enriched in cluster 4 (purple) in relation to all other clusters (IL1RL1: FDR < 2 × 10⁻¹⁴, PIM2: P < 5 × 10⁻⁵, PRNP: P < 10−6); and IL13, which although not statistically significant is presented because expression was not detected outside of cluster 4. Columns indicate average expression levels for each individual donor.CC BY-NC-SA · PubMed Central
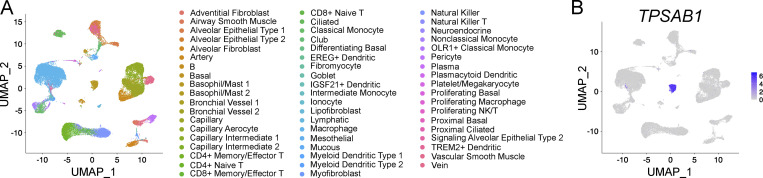
Figure S3. ScRNA-seq analysis of human distal lung tissue. (A) Sequencing results for distal lung tissue from three healthy donors generated by Travaglini et al. (2020) were computationally combined using Harmony, and previously described cluster designations were applied. (B) Independent confirmation that tryptase (TPSAB1) expression was restricted to a single cluster, encompassing both previously identified MC clusters.
Figure S3. ScRNA-seq analysis of human distal lung tissue. (A) Sequencing results for distal lung tissue from three healthy donors generated by Travaglini et al. (2020) were computationally combined using Harmony, and previously described cluster designations were applied. (B) Independent confirmation that tryptase (TPSAB1) expression was restricted to a single cluster, encompassing both previously identified MC clusters.CC BY-NC-SA · PubMed Central
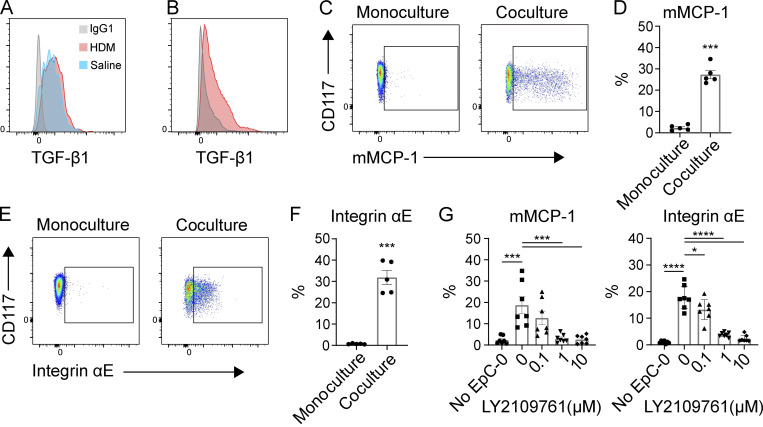
Figure 7. Epithelial cells induce an MMC-like phenotype through TGF-β signaling. (A) Representative flow plot of TGF-β1 expression by murine pulmonary epithelial cells (EPCAM+, Thy1−, CD90−, CD31−) in vivo from mice challenged with HDM (red) and saline (blue) relative to isotype control (gray). Results representative of three experiments with n = 2–4 mice per group in each experiment. (B) Representative flow plot of TGF-β1 expression by primary mouse tracheal epithelial cells expanded ex vivo (red) relative to isotype control (gray). Results representative of two independent experiments. (C) Representative flow plots of mMCP-1 expression by IL-3–supplemented BMMCs cultured on Matrigel alone (left) or in coculture with mouse airway epithelial cells (right) for 7 d. (D) Quantification of intracellular mMCP-1 expression by IL-3–supplemented BMMCs cultured alone or in coculture with mouse airway epithelial cells on Matrigel for 7 d. Results are from three independent experiments, with each replicate showing a unique combination of epithelial and MC biological donors. ***, P < 0.001 (t test). (E) Representative flow plots of αE integrin expression by BMMCs cultured on Matrigel alone (left) or in coculture with mouse airway epithelial cells (right) for 7 d. (F) Quantification of αE-integrin expression by BMMCs cultured on Matrigel alone or in coculture with mouse airway epithelial cells for 7 d. Results are from three independent experiments, with each replicate showing a unique biological combination of epithelial and MC cultures. ***, P < 0.001 (t test). (G) Expression of mMCP-1 and αE integrin by BMMCs cultured on Matrigel alone or in coculture with mouse airway epithelial cells for 7 d in conjunction with the indicated concentration of the TGF-β R1/R2 dual inhibitor LY2109761. Results are from three independent experiments, with each replicate showing a unique biological combination of epithelial and MC cultures. *, P < 0.05; ***, P < 0.001; ****, P < 0.0001 (Dunnett’s multiple comparisons test).
Figure 7. Epithelial cells induce an MMC-like phenotype through TGF-β signaling. (A) Representative flow plot of TGF-β1 expression by murine pulmonary epithelial cells (EPCAM+, Thy1−, CD90−, CD31−) in vivo from mice challenged with HDM (red) and saline (blue) relative to isotype control (gray). Results representative of three experiments with n = 2–4 mice per group in each experiment. (B) Representative flow plot of TGF-β1 expression by primary mouse tracheal epithelial cells expanded ex vivo (red) relative to isotype control (gray). Results representative of two independent experiments. (C) Representative flow plots of mMCP-1 expression by IL-3–supplemented BMMCs cultured on Matrigel alone (left) or in coculture with mouse airway epithelial cells (right) for 7 d. (D) Quantification of intracellular mMCP-1 expression by IL-3–supplemented BMMCs cultured alone or in coculture with mouse airway epithelial cells on Matrigel for 7 d. Results are from three independent experiments, with each replicate showing a unique combination of epithelial and MC biological donors. ***, P < 0.001 (t test). (E) Representative flow plots of αE integrin expression by BMMCs cultured on Matrigel alone (left) or in coculture with mouse airway epithelial cells (right) for 7 d. (F) Quantification of αE-integrin expression by BMMCs cultured on Matrigel alone or in coculture with mouse airway epithelial cells for 7 d. Results are from three independent experiments, with each replicate showing a unique biological combination of epithelial and MC cultures. ***, P < 0.001 (t test). (G) Expression of mMCP-1 and αE integrin by BMMCs cultured on Matrigel alone or in coculture with mouse airway epithelial cells for 7 d in conjunction with the indicated concentration of the TGF-β R1/R2 dual inhibitor LY2109761. Results are from three independent experiments, with each replicate showing a unique biological combination of epithelial and MC cultures. *, P < 0.05; ***, P < 0.001; ****, P < 0.0001 (Dunnett’s multiple comparisons test).CC BY-NC-SA · PubMed Central

Verification

Claims the paper makes

The claims and statistics of this paper haven’t been checked yet.

Run the check — free, no account needed. It reads the open-access text and checks the sources it cites.

A few free checks a day · papers already verified open instantly · results are public

Claims other papers make about this one

Each is checked against this paper’s own text: does it say what the citing paper says it does?

Self-check

Percentages, sums and reported differences re-computed from the paper’s own numbers.

The self-check needs the paper’s full text.

Citations

Cites

Show all 2 references

Research works printed but not linked: 64

  1. Abonia, 2006, Alpha-4 integrins and VCAM-1, but not MAdCAM-1, are essential for recruitment of mast cell progenitors to the inflamed lung, Blood, 108, 1588, 10.1182/blood-2005-12-012781 · DOI
  2. Anders, 2015, HTSeq--a Python framework to work with high-throughput sequencing data, Bioinformatics, 31, 166, 10.1093/bioinformatics/btu638 · DOI · Paper page
  3. Austen, 1961, Anaphylaxis in chopped guinea pig lung. II. Enhancement of the anaphylactic release of histamine and slow reacting substance by certain dibasic aliphatic acids and inhibition by monobasic fatty acids, J. Exp. Med, 113, 541, 10.1084/jem.113.3.541 · DOI
  4. Bankova, 2015, Maturation of mast cell progenitors to mucosal mast cells during allergic pulmonary inflammation in mice, Mucosal Immunol, 8, 596, 10.1038/mi.2014.91 · DOI · Paper page
  5. Braga, 2007, Serglycin proteoglycan is required for secretory granule integrity in mucosal mast cells, Biochem. J, 403, 49, 10.1042/BJ20061257 · DOI
  6. Burton, 2014, Immunoglobulin E signal inhibition during allergen ingestion leads to reversal of established food allergy and induction of regulatory T cells, Immunity, 41, 141, 10.1016/j.immuni.2014.05.017 · DOI
  7. Butler, 2018, Integrating single-cell transcriptomic data across different conditions, technologies, and species, Nat. Biotechnol, 36, 411, 10.1038/nbt.4096 · DOI · Paper page
  8. Chen, 2015, Induction of Interleukin-9-Producing Mucosal Mast Cells Promotes Susceptibility to IgE-Mediated Experimental Food Allergy, Immunity, 43, 788, 10.1016/j.immuni.2015.08.020 · DOI
  9. Crowle, 1983, Mucosal mast cell reconstitution and Nippostrongylus brasiliensis rejection by W/Wv mice, J. Parasitol, 69, 66, 10.2307/3281276 · DOI
  10. Dahlin, 2016, Lin- CD34hi CD117int/hi FcεRI+ cells in human blood constitute a rare population of mast cell progenitors, Blood, 127, 383, 10.1182/blood-2015-06-650648 · DOI
  11. Deheuninck, 2009, Ski and SnoN, potent negative regulators of TGF-beta signaling, Cell Res, 19, 47, 10.1038/cr.2008.324 · DOI
  12. Dobin, 2013, STAR: ultrafast universal RNA-seq aligner, Bioinformatics, 29, 15, 10.1093/bioinformatics/bts635 · DOI · Paper page
  13. Dudeck, 2011, Mast cells are key promoters of contact allergy that mediate the adjuvant effects of haptens, Immunity, 34, 973, 10.1016/j.immuni.2011.03.028 · DOI
  14. Dudeck, 2015, Mast-Cell-Derived TNF Amplifies CD8(+) Dendritic Cell Functionality and CD8(+) T Cell Priming, Cell Rep, 13, 399, 10.1016/j.celrep.2015.08.078 · DOI
  15. Dwyer, 2016, Expression profiling of constitutive mast cells reveals a unique identity within the immune system, Nat. Immunol, 17, 878, 10.1038/ni.3445 · DOI
  16. Eenjes, 2018, A novel method for expansion and differentiation of mouse tracheal epithelial cells in culture, Sci. Rep, 8, 7349, 10.1038/s41598-018-25799-6 · DOI
  17. Eklund, 1993, Induction by IL-9 and suppression by IL-3 and IL-4 of the levels of chromosome 14-derived transcripts that encode late-expressed mouse mast cell proteases, J. Immunol, 151, 4266, 10.4049/jimmunol.151.8.4266 · DOI
  18. Feyerabend, 2011, Cre-mediated cell ablation contests mast cell contribution in models of antibody- and T cell-mediated autoimmunity, Immunity, 35, 832, 10.1016/j.immuni.2011.09.015 · DOI
  19. Friend, 1996, Mast cells that reside at different locations in the jejunum of mice infected with Trichinella spiralis exhibit sequential changes in their granule ultrastructure and chymase phenotype, J. Cell Biol, 135, 279, 10.1083/jcb.135.1.279 · DOI
  20. Gentek, 2018, Hemogenic Endothelial Fate Mapping Reveals Dual Developmental Origin of Mast Cells, Immunity, 48, 1160, 10.1016/j.immuni.2018.04.025 · DOI · Paper page
  21. Gessner, 2005, Mast cells, basophils, and eosinophils acquire constitutive IL-4 and IL-13 transcripts during lineage differentiation that are sufficient for rapid cytokine production, J. Immunol, 174, 1063, 10.4049/jimmunol.174.2.1063 · DOI
  22. Ghildyal, 1992, Transcriptional regulation of the mucosal mast cell-specific protease gene, MMCP-2, by interleukin 10 and interleukin 3, J. Biol. Chem., 267, 8473, 10.1016/S0021-9258(18)42469-6 · DOI
  23. Ghildyal, 1992, IL-10 induces transcription of the gene for mouse mast cell protease-1, a serine protease preferentially expressed in mucosal mast cells of Trichinella spiralis-infected mice, J. Immunol., 149, 2123, 10.4049/jimmunol.149.6.2123 · DOI
  24. Gurish, 2001, Intestinal mast cell progenitors require CD49dbeta7 (alpha4beta7 integrin) for tissue-specific homing, J. Exp. Med, 194, 1243, 10.1084/jem.194.9.1243 · DOI · Paper page
  25. Heavey, 1988, Generation of leukotriene C4, leukotriene B4, and prostaglandin D2 by immunologically activated rat intestinal mucosa mast cells, J. Immunol, 140, 1953, 10.4049/jimmunol.140.6.1953 · DOI
  26. Honjo, 2017, Pharmacologic inhibition of Notch signaling suppresses food antigen-induced mucosal mast cell hyperplasia, J. Allergy Clin. Immunol, 139, 987, 10.1016/j.jaci.2016.05.046 · DOI
  27. Kasakura, 2020, Cooperative Regulation of the Mucosal Mast Cell-Specific Protease Genes Mcpt1 and Mcpt2 by GATA and Smad Transcription Factors, J. Immunol, 204, 1641, 10.4049/jimmunol.1900094 · DOI
  28. Kim, 2013, TopHat2: accurate alignment of transcriptomes in the presence of insertions, deletions and gene fusions, Genome Biol, 14, R36, 10.1186/gb-2013-14-4-r36 · DOI · Paper page
  29. Kitamura, 1979, Presence of mast cell precursors in peripheral blood of mice demonstrated by parabiosis, Blood, 53, 1085, 10.1182/blood.V53.6.1085.1085 · DOI · Paper page
  30. Knight, 2000, Delayed expulsion of the nematode Trichinella spiralis in mice lacking the mucosal mast cell-specific granule chymase, mouse mast cell protease-1, J. Exp. Med, 192, 1849, 10.1084/jem.192.12.1849 · DOI · Paper page
  31. Knight, 2002, Enteric expression of the integrin alpha(v)beta(6) is essential for nematode-induced mucosal mast cell hyperplasia and expression of the granule chymase, mouse mast cell protease-1, Am. J. Pathol, 161, 771, 10.1016/S0002-9440(10)64236-8 · DOI
  32. Koivisto, 2018, Integrin αvβ6: Structure, function and role in health and disease, Int. J. Biochem. Cell Biol, 99, 186, 10.1016/j.biocel.2018.04.013 · DOI
  33. Leyva-Castillo, 2019, Mechanical Skin Injury Promotes Food Anaphylaxis by Driving Intestinal Mast Cell Expansion, Immunity, 50, 1262, 10.1016/j.immuni.2019.03.023 · DOI
  34. Li, 2018, Adult Connective Tissue-Resident Mast Cells Originate from Late Erythro-Myeloid Progenitors, Immunity, 49, 640, 10.1016/j.immuni.2018.09.023 · DOI · Paper page
  35. Lilla, 2011, Reduced mast cell and basophil numbers and function in Cpa3-Cre; Mcl-1fl/fl mice, Blood, 118, 6930, 10.1182/blood-2011-03-343962 · DOI · Paper page
  36. Liu, 2015, Aspirin-Exacerbated Respiratory Disease Involves a Cysteinyl Leukotriene-Driven IL-33-Mediated Mast Cell Activation Pathway, J. Immunol, 195, 3537, 10.4049/jimmunol.1500905 · DOI
  37. Love, 2014, Moderated estimation of fold change and dispersion for RNA-seq data with DESeq2, Genome Biol, 15, 550, 10.1186/s13059-014-0550-8 · DOI · Paper page
  38. Meixiong, 2019, Activation of Mast-Cell-Expressed Mas-Related G-Protein-Coupled Receptors Drives Non-histaminergic Itch, Immunity, 50, 1163, 10.1016/j.immuni.2019.03.013 · DOI
  39. Melisi, 2008, LY2109761, a novel transforming growth factor beta receptor type I and type II dual inhibitor, as a therapeutic approach to suppressing pancreatic cancer metastasis, Mol. Cancer Ther, 7, 829, 10.1158/1535-7163.MCT-07-0337 · DOI
  40. Miller, 1999, A novel function for transforming growth factor-beta1: upregulation of the expression and the IgE-independent extracellular release of a mucosal mast cell granule-specific beta-chymase, mouse mast cell protease-1, Blood, 93, 3473, 10.1182/blood.V93.10.3473.410k01_3473_3486 · DOI
  41. Mukai, 2018, Mast cells as sources of cytokines, chemokines, and growth factors, Immunol. Rev, 282, 121, 10.1111/imr.12634 · DOI
  42. Nakano, 2014, C18 ORF1, a novel negative regulator of transforming growth factor-β signaling, J. Biol. Chem, 289, 12680, 10.1074/jbc.M114.558981 · DOI
  43. Öhrvik, 2016, Mast cells promote melanoma colonization of lungs, Oncotarget, 7, 68990, 10.18632/oncotarget.11837 · DOI · Paper page
  44. Orinska, 2007, IL-15 constrains mast cell-dependent antibacterial defenses by suppressing chymase activities, Nat. Med, 13, 927, 10.1038/nm1615 · DOI
  45. Otsuka, 2011, Requirement of interaction between mast cells and skin dendritic cells to establish contact hypersensitivity, PLoS One, 6, 10.1371/journal.pone.0025538 · DOI
  46. Pejler, 2010, Mast cell proteases: multifaceted regulators of inflammatory disease, Blood, 115, 4981, 10.1182/blood-2010-01-257287 · DOI
  47. Pemberton, 2006, Anaphylactic release of mucosal mast cell granule proteases: role of serpins in the differential clearance of mouse mast cell proteases-1 and -2, J. Immunol, 176, 899, 10.4049/jimmunol.176.2.899 · DOI
  48. Razin, 1984, Interleukin 3: A differentiation and growth factor for the mouse mast cell that contains chondroitin sulfate E proteoglycan, J. Immunol, 132, 1479, 10.4049/jimmunol.132.3.1479 · DOI
  49. Reber, 2014, Contribution of mast cell-derived interleukin-1β to uric acid crystal-induced acute arthritis in mice, Arthritis Rheumatol, 66, 2881, 10.1002/art.38747 · DOI
  50. Reber, 2017, Imaging protective mast cells in living mice during severe contact hypersensitivity, JCI Insight, 2, 10.1172/jci.insight.92900 · DOI
  51. Sjöberg, 2017, Interleukin 33 exacerbates antigen driven airway hyperresponsiveness, inflammation and remodeling in a mouse model of asthma, Sci. Rep, 7, 4219, 10.1038/s41598-017-03674-0 · DOI
  52. Smith, 1994, Murine M290 integrin expression modulated by mast cell activation, Immunity, 1, 393, 10.1016/1074-7613(94)90070-1 · DOI
  53. Sonoda, 1983, Presence of mast cell precursors in the yolk sac of mice, Dev. Biol, 97, 89, 10.1016/0012-1606(83)90066-0 · DOI · Paper page
  54. Sugimoto, 2012, The αvβ6 integrin modulates airway hyperresponsiveness in mice by regulating intraepithelial mast cells, J. Clin. Invest, 122, 748, 10.1172/JCI58815 · DOI
  55. Sullivan, 2011, Genetic analysis of basophil function in vivo, Nat. Immunol, 12, 527, 10.1038/ni.2036 · DOI · Paper page
  56. Trapnell, 2012, Differential gene and transcript expression analysis of RNA-seq experiments with TopHat and Cufflinks, Nat. Protoc, 7, 562, 10.1038/nprot.2012.016 · DOI
  57. Travaglini, 2020, A molecular cell atlas of the human lung from single cell RNA sequencing, bioRxiv.
  58. Trombetta, 2014, Preparation of Single-Cell RNA-Seq Libraries for Next Generation Sequencing, Curr. Protoc. Mol. Biol, 107, 1, 10.1002/0471142727.mb0422s107 · DOI
  59. Tsai, 2015, Testing the ‘toxin hypothesis of allergy’: mast cells, IgE, and innate and acquired immune responses to venoms, Curr. Opin. Immunol, 36, 80, 10.1016/j.coi.2015.07.001 · DOI
  60. Wada, 2010, Selective ablation of basophils in mice reveals their nonredundant role in acquired immunity against ticks, J. Clin. Invest, 120, 2867, 10.1172/JCI42680 · DOI · Paper page
  61. Wastling, 1998, Histochemical and ultrastructural modification of mucosal mast cell granules in parasitized mice lacking the beta-chymase, mouse mast cell protease-1, Am. J. Pathol, 153, 491, 10.1016/S0002-9440(10)65592-7 · DOI
  62. Wright, 2002, Transforming growth factor-beta1 mediates coexpression of the integrin subunit alphaE and the chymase mouse mast cell protease-1 during the early differentiation of bone marrow-derived mucosal mast cell homologues, Clin. Exp. Allergy, 32, 315, 10.1046/j.1365-2222.2002.01233.x · DOI
  63. Xing, 2011, Protease phenotype of constitutive connective tissue and of induced mucosal mast cells in mice is regulated by the tissue, Proc. Natl. Acad. Sci. USA, 108, 14210, 10.1073/pnas.1111048108 · DOI
  64. Yu, 2006, Mast cells can promote the development of multiple features of chronic asthma in mice, J. Clin. Invest, 116, 1633, 10.1172/JCI25702 · DOI

Cited by

Sorted by citations

Metadata

Authors
Derakhshan, T., Samuchiwal, S. K., Hallen, N., Bankova, L. G., Boyce, J. A., Barrett, N. A., Austen, K. F., & Dwyer, D. F.
Affiliations
Jeff and Penny Vinik Center for Allergic Disease Research, Division of Allergy and Clinical Immunology, Brigham and Women’s Hospital, Boston, MA 1
Venue
Journal of Experimental Medicine
Published
2020-09-18
Volume
218
Issue
1
ISSN
  • 0022-1007
  • 1540-9538
Cited by
75
References
2
Language
en
Funders
  • National Institutes of Health (R37AI052353, R01AI136041, R01AI130109, R01HL136209, U19 AI095219, R01HL120952, R01AI134989, U19AI095219, T32 AI007306, K22 AI146281)
  • Steven and Judy Kaye Young
  • AADCRC Opportunity Fund (U19AI070535)
  • Vinik family

About these checks

Registry, retraction, Cites and statistics results are computed, not judged, with one exception: a printed reference that no index lists is read once by a model before it counts as a citation error. Claims are extracted by a model and kept only when their quote appears verbatim in the text; each cited source is then checked, with a model’s help, for whether it says what the claim relies on. Those verdicts can be wrong — read the claim’s quote and the cited source before relying on one.

Statistics and arithmetic are recomputed, not judged.

Confidence bands are shown only for fields calibrated on our annotated test set. None is calibrated yet, so no band is shown.

What counts as a claim ›How we measure confidence ›How we check this ›

Are you an author, or do you see a problem with this page? Request a review