

The DOI matches its Crossref record; 38 of the 40 references it cites were found in a registry or an index.
Activation of Ca2+-Dependent K+ Channels Contributes to Rhythmic Firing of Action Potentials in Mouse Pancreatic β Cells
Open accessAbstract
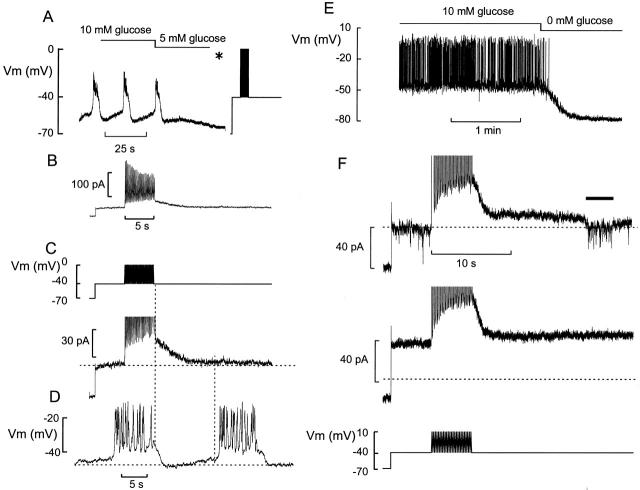
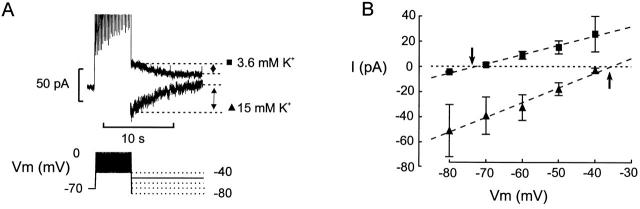
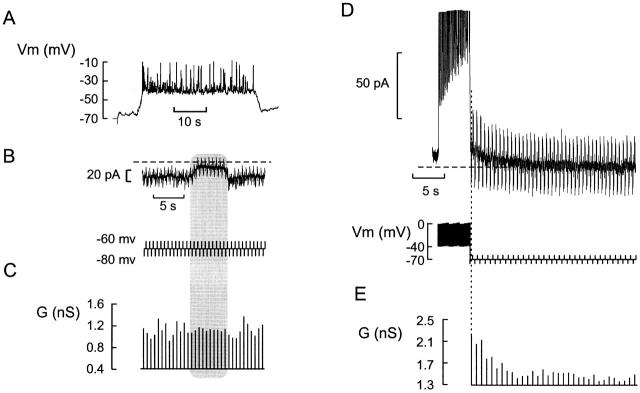
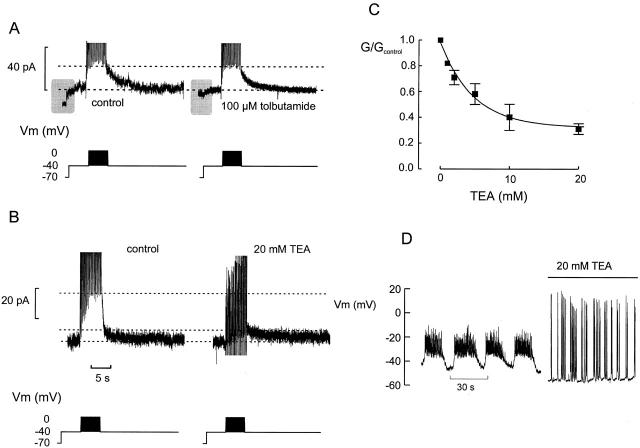
We have applied the perforated patch whole-cell technique to β cells within intact pancreatic islets to identify the current underlying the glucose-induced rhythmic firing of action potentials. Trains of depolarizations (to simulate glucose-induced electrical activity) resulted in the gradual (time constant: 2.3 s) development of a small (<0.8 nS) K+ conductance. The current was dependent on Ca2+ influx but unaffected by apamin and charybdotoxin, two blockers of Ca2+-activated K+ channels, and was insensitive to tolbutamide (a blocker of ATP-regulated K+ channels) but partially (>60%) blocked by high (10–20 mM) concentrations of tetraethylammonium. Upon cessation of electrical stimulation, the current deactivated exponentially with a time constant of 6.5 s. This is similar to the interval between two successive bursts of action potentials. We propose that this Ca2+-activated K+ current plays an important role in the generation of oscillatory electrical activity in the β cell.
Overview
The claims and statistics of this paper haven’t been checked yet.
Run the check — free, no account needed. It reads the open-access text and checks the sources it cites.
Integrity signals
Registry
Cites
Statistics
Figures
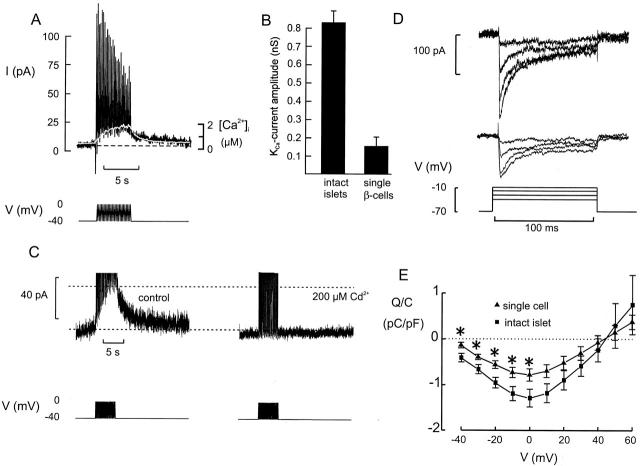
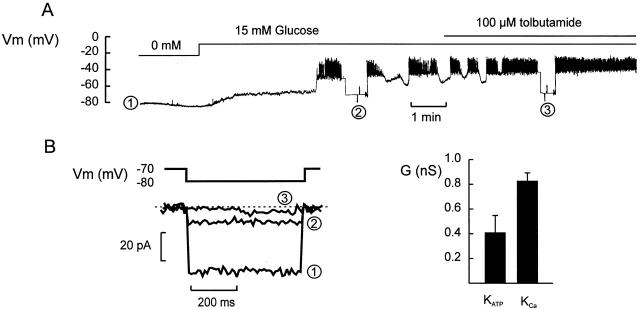
Verification
Claims the paper makes
The claims and statistics of this paper haven’t been checked yet.
Run the check — free, no account needed. It reads the open-access text and checks the sources it cites.
Claims other papers make about this one
Each is checked against this paper’s own text: does it say what the citing paper says it does?
The source backs part of the claim, not all of it — or backs it for a different population, condition or comparison.
In the citing paper
“The existence of a KATP channel-independent component of Kslow (contributed by SK channels) might explain the paradox that slow waves persist in islets of SUR1 knockout mice, which lack functional KATP channels (157, 223).”
From Pancreatic β-Cell Electrical Activity and Insulin Secretion: Of Mice and Men (2018) · cites this paper as [223]
Experimental — accuracy not yet measuredThe source backs part of the claim, not all of it — or backs it for a different population, condition or comparison.
In the citing paper
“The reduced exocytotic capacity of β-cells in intact islets is likewise not the consequence of reduced Ca2+ entry: if anything, the Ca2+ channel density is greater in β-cells in intact islets (223).”
From Pancreatic β-Cell Electrical Activity and Insulin Secretion: Of Mice and Men (2018) · cites this paper as [223]
Experimental — accuracy not yet measuredThe cited source says what the claim attributes to it.
In the citing paper
“It is also blocked by TEA with an IC50 of ~5 mM (223) and by UCL1684.”
From Pancreatic β-Cell Electrical Activity and Insulin Secretion: Of Mice and Men (2018) · cites this paper as [223]
The cited source says what the claim attributes to it.
In the citing paper
“Thus Kslow likely contributes to the pacemaker current.”
From Pancreatic β-Cell Electrical Activity and Insulin Secretion: Of Mice and Men (2018) · cites this paper as [223]
The cited source says what the claim attributes to it.
In the citing paper
“which may account for the loss of normal oscillatory electrical activity seen in this preparation (but see (217)).”
From Pancreatic β-Cell Electrical Activity and Insulin Secretion: Of Mice and Men (2018) · cites this paper as [223]
The cited source says what the claim attributes to it.
In the citing paper
“It has been reported that Kslow is reduced in dispersed β-cells maintained in tissue culture (223) which may account for the loss of normal oscillatory electrical activity seen in this preparation (but see (217)).”
From Pancreatic β-Cell Electrical Activity and Insulin Secretion: Of Mice and Men (2018) · cites this paper as [223]
The cited source says what the claim attributes to it.
In the citing paper
“An early report that apamin is without effect on either glucose-induced electrical activity (374) or the amplitude of the Kslow current (12, 223) was therefore surprising (although see (669)).”
From Pancreatic β-Cell Electrical Activity and Insulin Secretion: Of Mice and Men (2018) · cites this paper as [223]
The cited source says what the claim attributes to it.
In the citing paper
“The time and voltage-dependence of activation of Kslow echoes the changes in [Ca2+]i associated with (simulated) electrical activity (223).”
From Pancreatic β-Cell Electrical Activity and Insulin Secretion: Of Mice and Men (2018) · cites this paper as [223]
The cited source says what the claim attributes to it.
In the citing paper
“Following cessation of electrical activity, the current deactivates with a time course similar to the slow depolarization between two successive bursts of action potentials (223).”
From Pancreatic β-Cell Electrical Activity and Insulin Secretion: Of Mice and Men (2018) · cites this paper as [223]
Self-check
Percentages, sums and reported differences re-computed from the paper’s own numbers.
The self-check needs the paper’s full text.
Citations
Cites
Muscarinic activation of ionic currents measured by a new whole-cell recording method.
Horn, R., & Marty, A. (1988) · The Journal of general physiology · doi:10.1085/jgp.92.2.145 · Cited by 1,338
Electrophysiology of the pancreatic β-cell
Ashcroft, F. M., & Rorsman, P. (1989) · Progress in Biophysics and Molecular Biology · doi:10.1016/0079-6107(89)90013-8 · Cited by 1,122
Self-citationLow access resistance perforated patch recordings using amphotericin B
Rae, J. L., Cooper, K. E., Gates, P., & Watsky, M. A. (1991) · Journal of Neuroscience Methods · doi:10.1016/0165-0270(91)90017-t · Cited by 917
Marrion, N. V., & Tavalin, S. J. (1998) · Nature · doi:10.1038/27674 · Cited by 546
Rorsman, P., & Trube, G. (1986) · The Journal of Physiology · doi:10.1113/jphysiol.1986.sp016096 · Cited by 362
Self-citationSantos, R. M., Rosario, L. M., Nadal, A., Garcia-Sancho, J., Soria, B., & Valdeolmillos, M. (1991) · Pfl�gers Archiv European Journal of Physiology · doi:10.1007/bf00550880 · Cited by 350
Henquin, J. C., & Meissner, H. P. (1984) · Experientia · doi:10.1007/bf01971450 · Cited by 324
Electrical Activity in Pancreatic Islet Cells
Dean, P. M., & Matthews, E. K. (1968) · Nature · doi:10.1038/219389a0 · Cited by 307
Bokvist, K. B., Eliasson, L., Ämmälä, C., Renström, E., & Rorsman, P. (1995) · The EMBO Journal · doi:10.1002/j.1460-2075.1995.tb06974.x · Cited by 291
Self-citationAmmälä, C., Eliasson, L., Bokvist, K., Larsson, O., Ashcroft, F. M., & Rorsman, P. (1993) · The Journal of Physiology · doi:10.1113/jphysiol.1993.sp019966 · Cited by 270
Self-citation
Research works printed but not linked: 2
- Göpel, 1998, Activation of a Ca2+-activated K+-conductance terminates the burst of action potentials in insulin-secreting pancreatic B-cells, Diabetologia., 41, 540
- Satin, 1994, Electrical bursting in β-cell of the pancreatic islets of Langerhans, Endocrine, 2, 677
Cited by
Sorted by citations
Islet Amyloid Polypeptide, Islet Amyloid, and Diabetes Mellitus
Westermark, P., Andersson, A., & Westermark, G. T. (2011) · Physiological Reviews · doi:10.1152/physrev.00042.2009 · Cited by 1,044
Pancreatic β-Cell Electrical Activity and Insulin Secretion: Of Mice and Men
Rorsman, P., & Ashcroft, F. M. (2018) · Physiological Reviews · doi:10.1152/physrev.00008.2017 · Cited by 793
Self-citationRegulation of Insulin Secretion in Human Pancreatic Islets
Rorsman, P., & Braun, M. (2013) · Annual Review of Physiology · doi:10.1146/annurev-physiol-030212-183754 · Cited by 599
Self-citationPancreatic β-cell identity, glucose sensing and the control of insulin secretion
Rutter, G. A., Pullen, T. J., Hodson, D. J., & Martínez-Sánchez, A. (2015) · Biochemical Journal · doi:10.1042/bj20141384 · Cited by 355
KATP channels and islet hormone secretion: new insights and controversies
Ashcroft, F. M., & Rorsman, P. (2013) · Nature Reviews Endocrinology · doi:10.1038/nrendo.2013.166 · Cited by 272
Self-citation
Metadata
- Authors
- Göpel, S. O., Kanno, T., Barg, S., Eliasson, L., Galvanovskis, J., Renström, E., & Rorsman, P.
- Affiliations
- Lund University (SE)
- Venue
- The Journal of General Physiology
- Publisher
- Rockefeller University Press
- Published
- 1999-11-15
- Volume
- 114
- Issue
- 6
- Pages
- 759-770
- ISSN
- 0022-1295 (ISSN-L)
- 1540-7748
- PMC
- PMC2230648
- OpenAlex
- W2065171939
- Cited by
- 137
- References
- 40
- Citations by year
- 2026: 1 · 2025: 1 · 2024: 3 · 2023: 1 · 2022: 4 · 2021: 4 · 2020: 2 · 2019: 3 · 2018: 3 · 2017: 2 · 2016: 1 · 2015: 7 · 2014: 10 · 2013: 7 · 2012: 5
- FWCI
- 4.91
- Type
- journal article
- Language
- en
- Open access
- green
- europepmc.org
- Licence
- cc-by-nc-sa
- Locations
- The Journal of General Physiology (publishedVersion)
- Europe PMC (PubMed Central) (publishedVersion, cc-by-nc-sa)
- PubMed Central (publishedVersion, cc-by-nc-sa)
- PubMed (publishedVersion)
- Lund University Publications (Lund University) (submittedVersion)
- Topics
- Health Sciences › Medicine › Endocrinology, Diabetes and Metabolism › Pancreatic function and diabetes
- Life Sciences › Biochemistry, Genetics and Molecular Biology › Molecular Biology › Ion channel regulation and function
- Health Sciences › Medicine › Cardiology and Cardiovascular Medicine › Cardiac electrophysiology and arrhythmias
- Keywords
- calcium-activated potassium channels, pancreatic beta cells, pancreatic islets, tetraethylammonium, ATP-sensitive potassium channels, apamin, charybdotoxin, tolbutamide, potassium conductance, bursting oscillations
- MeSH terms
- Action Potentials, Animals, Electrophysiology, Hypoglycemic Agents, Islets of Langerhans, Membrane Potentials, Tolbutamide, Potassium Channels, Patch-Clamp Techniques, ATP-Binding Cassette Transporters, Potassium Channels, Inwardly Rectifying, Potassium Channels, Calcium-Activated, Potassium Channel Blockers, Large-Conductance Calcium-Activated Potassium Channels, Mice, KATP Channels, In Vitro Techniques
About these checks
Registry, retraction, Cites and statistics results are computed, not judged, with one exception: a printed reference that no index lists is read once by a model before it counts as a citation error. Claims are extracted by a model and kept only when their quote appears verbatim in the text; each cited source is then checked, with a model’s help, for whether it says what the claim relies on. Those verdicts can be wrong — read the claim’s quote and the cited source before relying on one.
Statistics and arithmetic are recomputed, not judged.
Confidence bands are shown only for fields calibrated on our annotated test set. None is calibrated yet, so no band is shown.
What counts as a claim ›How we measure confidence ›How we check this ›
Are you an author, or do you see a problem with this page? Request a review
