

The DOI matches its Crossref record; 46 of the 46 references it cites were found in a registry or an index.
The AAA-ATPase p97 is essential for outer mitochondrial membrane protein turnover
Open accessAbstract
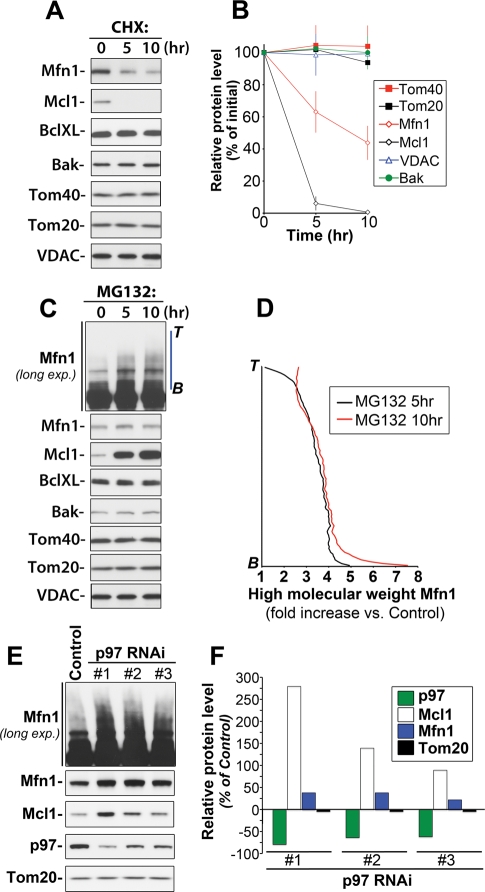
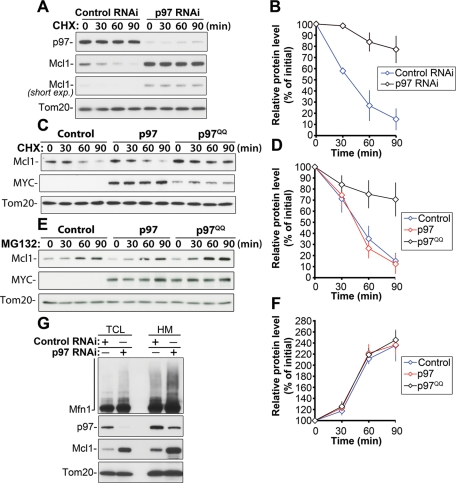
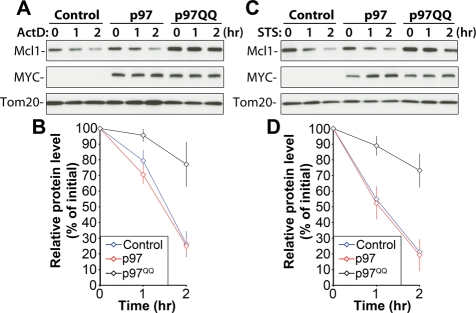
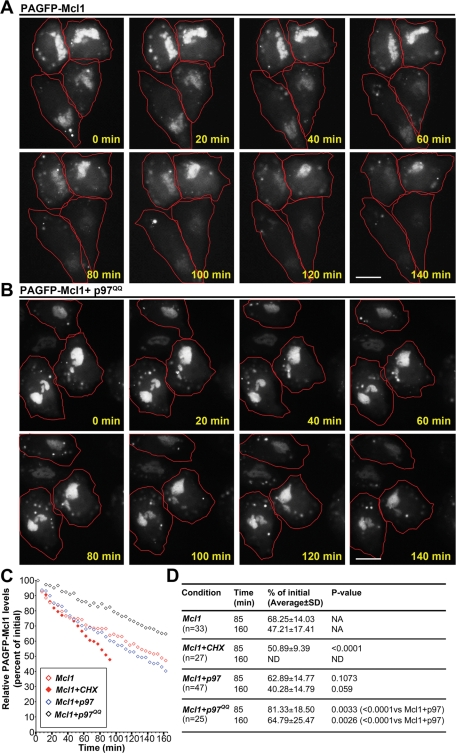
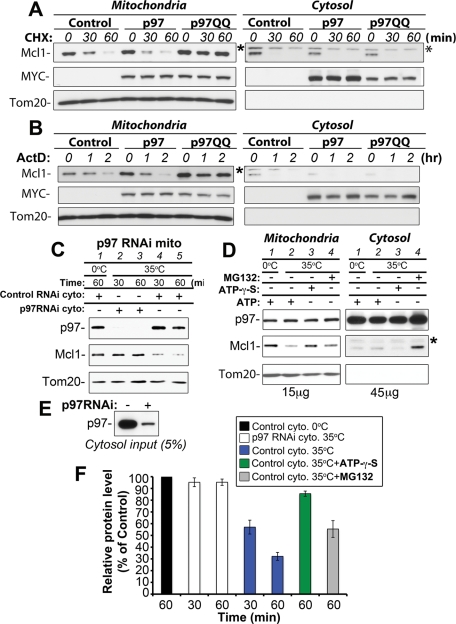
Recent studies have revealed a role for the ubiquitin/proteasome system in the regulation and turnover of outer mitochondrial membrane (OMM)-associated proteins. Although several molecular components required for this process have been identified, the mechanism of proteasome-dependent degradation of OMM-associated proteins is currently unclear. We show that an AAA-ATPase, p97, is required for the proteasomal degradation of Mcl1 and Mfn1, two unrelated OMM proteins with short half-lives. A number of biochemical assays, as well as imaging of changes in localization of photoactivable GFP-fused Mcl1, revealed that p97 regulates the retrotranslocation of Mcl1 from mitochondria to the cytosol, prior to, or concurrent with, proteasomal degradation. Mcl1 retrotranslocation from the OMM depends on the activity of the ATPase domain of p97. Furthermore, p97-mediated retrotranslocation of Mcl1 can be recapitulated in vitro, confirming a direct mitochondrial role for p97. Our results establish p97 as a novel and essential component of the OMM-associated protein degradation pathway.
Overview
The claims and statistics of this paper haven’t been checked yet.
Run the check — free, no account needed. It reads the open-access text and checks the sources it cites.
Integrity signals
Registry
Cites
Statistics
Figures
Verification
Claims the paper makes
The claims and statistics of this paper haven’t been checked yet.
Run the check — free, no account needed. It reads the open-access text and checks the sources it cites.
Claims other papers make about this one
Each is checked against this paper’s own text: does it say what the citing paper says it does?
The source backs part of the claim, not all of it — or backs it for a different population, condition or comparison.
In the citing paper
“p97/VCP is critical in the retrotranslocation and degradation of endoplasmic reticulum-associated proteins (ERAD) [47] and mitochondrial proteins ( MAD) [49, 50].”
From The connection between the dynamic remodeling of the mitochondrial network and the regulation of muscle mass (2021) · cites this paper as [50]
Experimental — accuracy not yet measuredIn the citing paper
“p97 provides the driving force to extract Mfn1, Mfn2, and the anti-apoptotic protein MCL1 from the OMM and chaperone them to the proteasome [49, 50].”
From The connection between the dynamic remodeling of the mitochondrial network and the regulation of muscle mass (2021) · cites this paper as [50]
Self-check
Percentages, sums and reported differences re-computed from the paper’s own numbers.
The self-check needs the paper’s full text.
Citations
Cites
Parkin is recruited selectively to impaired mitochondria and promotes their autophagy
Narendra, D., Tanaka, A., Suen, D.-F., & Youle, R. J. (2008) · The Journal of Cell Biology · doi:10.1083/jcb.200809125 · Cited by 4,026
A Photoactivatable GFP for Selective Photolabeling of Proteins and Cells
Patterson, G. H., & Lippincott‐Schwartz, J. (2002) · Science · doi:10.1126/science.1074952 · Cited by 1,612
The AAA ATPase Cdc48/p97 and its partners transport proteins from the ER into the cytosol
Ye, Y., Meyer, H. H., & Rapoport, T. A. (2001) · Nature · doi:10.1038/414652a · Cited by 1,099
A membrane protein complex mediates retro-translocation from the ER lumen into the cytosol
Ye, Y., Shibata, Y., Yun, C., Ron, D., & Rapoport, T. A. (2004) · Nature · doi:10.1038/nature02656 · Cited by 963
Regulation of mitochondrial morphology through proteolytic cleavage of OPA1
Ishihara, N., Fujita, Y., Oka, T., & Mihara, K. (2006) · The EMBO Journal · doi:10.1038/sj.emboj.7601184 · Cited by 899
Zhong, Q., Gao, W., Du, F., & Wang, X. (2005) · Cell · doi:10.1016/j.cell.2005.06.009 · Cited by 844
Drosophila Parkin requires PINK1 for mitochondrial translocation and ubiquitinates Mitofusin
Ziviani, E., Tao, R. N., & Whitworth, A. J. (2010) · Proceedings of the National Academy of Sciences · doi:10.1073/pnas.0913485107 · Cited by 735
Characterization of the human heart mitochondrial proteome
Taylor, S. W., Fahy, E., Zhang, B., Glenn, G. M., Warnock, D. E., Wiley, S. E., Murphy, A. N., Gaucher, S. P., Capaldi, R., Gibson, B. W., et al. (2003) · Nature Biotechnology · doi:10.1038/nbt793 · Cited by 713
Deubiquitinase USP9X stabilizes MCL1 and promotes tumour cell survival
Schwickart, M., Huang, X., Lill, J. R., Liu, J., Ferrando, R., French, D. M., Maecker, H., O’Rourke, K., Bazan, F., Eastham-Anderson, J., et al. (2010) · Nature · doi:10.1038/nature08646 · Cited by 628
Elimination of Mcl-1 is required for the initiation of apoptosis following ultraviolet irradiationPreprint
Nijhawan, D., Fang, M., Traer, E. A., Zhong, Q., Gao, W., Du, F., & Wang, X. (2003) · Genes & Development · doi:10.1101/gad.1093903 · Cited by 611
Research works printed but not linked: 1
- Bar-Nun S, 2005, Curr Top Microbiol Immunol, 300, 95
Cited by
Sorted by citations
Mitochondria: In Sickness and in Health
Nunnari, J., & Suomalainen, A. (2012) · Cell · doi:10.1016/j.cell.2012.02.035 · Cited by 3,479
“We provide a current view of how mitochondrial functions impinge on health and disease.”
BackgroundMitophagy and Quality Control Mechanisms in Mitochondrial Maintenance
Pickles, S., Vigié, P., & Youle, R. J. (2018) · Current Biology · doi:10.1016/j.cub.2018.01.004 · Cited by 2,081
Mitochondrial form and function
Friedman, J. R., & Nunnari, J. (2014) · Nature · doi:10.1038/nature12985 · Cited by 1,803
Mitochondrial Dynamics — Mitochondrial Fission and Fusion in Human Diseases
Archer, S. L. (2013) · New England Journal of Medicine · doi:10.1056/nejmra1215233 · Cited by 1,120
Mitochondrial dynamics and inheritance during cell division, development and disease
Mishra, P., & Chan, D. C. (2014) · Nature Reviews Molecular Cell Biology · doi:10.1038/nrm3877 · Cited by 1,076
A new pathway for mitochondrial quality control: Mitochondrial-derived vesicles
Sugiura, A., McLelland, G., Fon, E. A., & McBride, H. M. (2014) · The EMBO Journal · doi:10.15252/embj.201488104 · Cited by 862
“Some outer membrane proteins are ubiquitinated and degraded by p97-dependent retrotranslocation and delivery to the cytosolic proteasome (Heo et al, 2010; Tanaka et al, 2010; Chan et al, 2011; Xu et al, 2011).”
BackgroundEmerging functions of the VCP/p97 AAA-ATPase in the ubiquitin system
Meyer, H. H., Bug, M., & Bremer, S. (2012) · Nature Cell Biology · doi:10.1038/ncb2407 · Cited by 832
Yoshii, S. R., Kishi, C., Ishihara, N., & Mizushima, N. (2011) · Journal of Biological Chemistry · doi:10.1074/jbc.m110.209338 · Cited by 612
Mitochondria: The Next (Neurode)Generation
Schon, E. A., & Przedborski, S. (2011) · Neuron · doi:10.1016/j.neuron.2011.06.003 · Cited by 568
Aggrephagy: Selective Disposal of Protein Aggregates by Macroautophagy
Lamark, T., & Johansen, T. (2012) · International Journal of Cell Biology · doi:10.1155/2012/736905 · Cited by 514
“Whether substrates can be transported out of the nucleus for degradation by autophagy is an open question.”
BackgroundQuality control of the mitochondrial proteome
Song, J., Herrmann, J. M., & Becker, T. (2020) · Nature Reviews Molecular Cell Biology · doi:10.1038/s41580-020-00300-2 · Cited by 501
Quality control of the mitochondrion
Ng, M. Y. W., Wai, T., & Simonsen, A. (2021) · Developmental Cell · doi:10.1016/j.devcel.2021.02.009 · Cited by 468
Mitochondrial quality control and muscle mass maintenance.
Romanello, V., & Sandri, M. (2016) · Frontiers in Physiology · doi:10.3389/fphys.2015.00422 · Cited by 434
“Then, the ubiquitinated proteins can be recognized by the adaptors p62/SQSTM1, Optineurin (OPTN), and NPD52 to initiate mitophagy. proteins from both the ER (Ye et al., 2001, 2003) and OMM (Heo et al., 2010; Tanaka et al., 2010; Xu et al., 2011).”
BackgroundMechanisms of Selective Autophagy
Lamark, T., & Johansen, T. (2021) · Annual Review of Cell and Developmental Biology · doi:10.1146/annurev-cellbio-120219-035530 · Cited by 429
Guerriero, C. J., & Brodsky, J. L. (2012) · Physiological Reviews · doi:10.1152/physrev.00027.2011 · Cited by 429
“Also, some factors that comprise the ERAD machinery also function to recognize, extract, and destroy components that reside in the mitochondrial membrane (86, 199, 558).”
VCP/p97-Mediated Unfolding as a Principle in Protein Homeostasis and Signaling
van den Boom, J., & Meyer, H. H. (2017) · Molecular Cell · doi:10.1016/j.molcel.2017.10.028 · Cited by 415
“In a process resembling its function in ERAD, p97 also extracts ubiquitin-modified proteins from mitochondrial outer membrane in a process termed mitochondria-associated degradation (MAD) (Heo et al., 2010; Xu et al., 2011; Karbowski and Youle, 2011).”
BackgroundCleaning up in the endoplasmic reticulum: ubiquitin in charge
Christianson, J. C., & Ye, Y. (2014) · Nature Structural & Molecular Biology · doi:10.1038/nsmb.2793 · Cited by 400
Covalent and allosteric inhibitors of the ATPase VCP/p97 induce cancer cell death
Magnaghi, P., D’Alessio, R., Valsasina, B., Avanzi, N. R., Rizzi, S., Asa, D., Gasparri, F., Cozzi, L., Cucchi, U., Orrenius, C., et al. (2013) · Nature Chemical Biology · doi:10.1038/nchembio.1313 · Cited by 381
Mitochondrial Quality Control Mediated by PINK1 and Parkin: Links to ParkinsonismPreprint
Narendra, D. P., Walker, J. E., & Youle, R. J. (2012) · Cold Spring Harbor Perspectives in Biology · doi:10.1101/cshperspect.a011338 · Cited by 360
“…that accumulate on mitochondria concurrent with Parkin translocation and ubiquitination of mitochondrial substrates include p97 and proteasome subunits consistent with an ERAD type pathway of mitochondrial outer membrane protein degradation by the proteasome (Tanaka et al. 2010; Xu et al. 2011).”
BackgroundRegulation of Mitochondrial ATP Production: Ca2+ Signaling and Quality Control
Boyman, L., Karbowski, M., & Lederer, W. J. (2019) · Trends in Molecular Medicine · doi:10.1016/j.molmed.2019.10.007 · Cited by 310
Self-citationMitochondrial degradation: Mitophagy and beyond
Uoselis, L., Nguyen, T. N., & Lazarou, M. (2023) · Molecular Cell · doi:10.1016/j.molcel.2023.08.021 · Cited by 270
Chloroplast Biogenesis Is Regulated by Direct Action of the Ubiquitin-Proteasome System
Ling, Q., Huang, W., Baldwin, A. J., & Jarvis, P. (2012) · Science · doi:10.1126/science.1225053 · Cited by 265
Regulating mitochondrial outer membrane proteins by ubiquitination and proteasomal degradation
Karbowski, M., & Youle, R. J. (2011) · Current Opinion in Cell Biology · doi:10.1016/j.ceb.2011.05.007 · Cited by 256
Self-citationSchellenberg, B., Wang, P., Keeble, J. A., Rodriguez-Enriquez, R., Walker, S., Owens, T. W., Foster, F., Tanianis-Hughes, J., Brennan, K., Streuli, C. H., et al. (2013) · Molecular Cell · doi:10.1016/j.molcel.2012.12.022 · Cited by 237
“The Bax TA appears to constitutively retrotranslocate, which might be controlled by enzymes such as p97VCP, an AAA+ adenosine triphosphatase (ATPase) that can remove membrane-inserted ER (Zhong et al., 2004) and mitochondrial proteins (Tanaka et al., 2010; Xu et al., 2011).”
BackgroundBrodsky, J. L., & Skach, W. R. (2011) · Current Opinion in Cell Biology · doi:10.1016/j.ceb.2011.05.004 · Cited by 250
Mitochondrial Dysfunction as a Driver of Cognitive Impairment in Alzheimer’s Disease
Sharma, C., Kim, S., Nam, Y., Jung, U. J., & Kim, S. R. (2021) · International Journal of Molecular Sciences · doi:10.3390/ijms22094850 · Cited by 253
“Here, damaged OM proteins are retro-translocated from the membrane with the help of the AAA+ ATPase p97, and then degraded by the cytoplasmic proteasome system [105].”
BackgroundDetection and Clearance of Damaged Lysosomes by the Endo-Lysosomal Damage Response and Lysophagy
Papadopoulos, C., & Meyer, H. (2017) · Current Biology · doi:10.1016/j.cub.2017.11.012 · Cited by 230
Dysfunctional Mitochondria and Mitophagy as Drivers of Alzheimer’s Disease Pathogenesis
Chakravorty, A., Jetto, C. T., & Manjithaya, R. R. (2019) · Frontiers in Aging Neuroscience · doi:10.3389/fnagi.2019.00311 · Cited by 225
“Here, the damaged outer mitochondrial membrane (OMM) proteins are retro-translocated from the membrane with the help of p97, an AAA+ ATPase, and are degraded by the cytoplasmic proteasome system (Tanaka et al., 2010; Xu et al., 2011).”
BackgroundChen, Y., Umanah, G. K. E., Dephoure, N., Andrabi, S. A., Gygi, S. P., Dawson, T. M., Dawson, V. L., & Rutter, J. P. (2014) · The EMBO Journal · doi:10.15252/embj.201487943 · Cited by 219
“The topology of TA proteins precludes them from being targeted by the canonical co-translational signal recognition particle pathway that is used by the vast majority of membrane proteins (Kutay et al, 1995; Steel et al, 2002; Yabal et al, 2003; Brambillasca et al, 2005).”
BackgroundMaharjan, S., Oku, M., Tsuda, M., Hoseki, J., & Sakai, Y. (2014) · Scientific Reports · doi:10.1038/srep05896 · Cited by 212
Li, S., Xu, S., Roelofs, B. A., Boyman, L., Lederer, W. J., Sesaki, H., & Karbowski, M. (2014) · The Journal of Cell Biology · doi:10.1083/jcb.201404050 · Cited by 214
“Western blot Cells were harvested, and total cell protein lysates were prepared as previously described (Xu et al., 2011).”
Self-citationGuo, X., Sun, X., Hu, D., Wang, Y.-J., Fujioka, H., Vyas, R., Chakrapani, S., Joshi, A. U., Luo, Y., Mochly-Rosen, D., et al. (2016) · Nature Communications · doi:10.1038/ncomms12646 · Cited by 200
Self-citationTruban, D., Hou, X., Caulfield, T. R., Fiesel, F. C., & Springer, W. (2016) · Journal of Parkinson’s Disease · doi:10.3233/jpd-160989 · Cited by 237
“However, inside mitochondria, PINK1 has been implicated in the phosphorylation of different proteins, although for some of them it is unclear whether this occurs directly.”
BackgroundRomanello, V., & Sandri, M. (2021) · Cellular and Molecular Life Sciences · doi:10.1007/s00018-020-03662-0 · Cited by 197
Mitochondrial protein quality control during biogenesis and aging
Baker, B. M., & Haynes, C. M. (2011) · Trends in Biochemical Sciences · doi:10.1016/j.tibs.2011.01.004 · Cited by 195
Sulkshane, P., Ram, J., Thakur, A., Reis, N., Kleifeld, O., & Glickman, M. H. (2021) · Redox Biology · doi:10.1016/j.redox.2021.102047 · Cited by 201
“VCP/p97 is a AAA ATPase that catalyzes extraction of OMM proteins during MAD for proteolytic destruction [55] including even MFN2 [56], and FKBP8 plays an important role in stress-induced Parkin-independent mitophagy [57,58].”
Recent advances in p97/VCP/Cdc48 cellular functions
Yamanaka, K., Sasagawa, Y., & Ogura, T. (2011) · Biochimica et Biophysica Acta (BBA) - Molecular Cell Research · doi:10.1016/j.bbamcr.2011.07.001 · Cited by 196
“reported that p97 is required for the proteasomal degradation of Mcl1 and Mfn1 (an Fzo1 homologue) and that the ATPase activity of p97 is required for the retrotranslocation of Mcl1 from mitochondria to the cytosol [91].”
BackgroundControl of mitochondrial biogenesis and function by the ubiquitin–proteasome system
Brągoszewski, P., Turek, M., & Chacińska, A. (2017) · Open Biology · doi:10.1098/rsob.170007 · Cited by 193
A Mighty “Protein Extractor” of the Cell: Structure and Function of the p97/CDC48 ATPase
Ye, Y., Tang, W. K., Zhang, T., & Xia, D. (2017) · Frontiers in Molecular Biosciences · doi:10.3389/fmolb.2017.00039 · Cited by 189
“It has also been demonstrated that p97 can facilitate mitochondria-associated degradation (MAD) by extracting polypeptides from mitochondrial outer membrane (Heo et al., 2010; Xu et al., 2011; Hemion et al., 2014).”
BackgroundNeurodegeneration as a consequence of failed mitochondrial maintenance
Karbowski, M., & Neutzner, A. (2011) · Acta Neuropathologica · doi:10.1007/s00401-011-0921-0 · Cited by 187
“It was recently shown that p97 is involved in the retrotranslocation of ubiquitinated proteins from mitochondria [135].”
BackgroundSelf-citationMitochondrial quality control by the ubiquitin–proteasome system
Taylor, E. B., & Rutter, J. P. (2011) · Biochemical Society Transactions · doi:10.1042/bst0391509 · Cited by 188
Song, W., Yi, Y., Sutovsky, M., Meyers, S. A., & Šutovský, P. (2016) · Proceedings of the National Academy of Sciences · doi:10.1073/pnas.1605844113 · Cited by 181
“Protein dislocase VCP is an ATPase involved in the extraction of ubiquitinated proteins from the outer mitochondrial membrane and their subsequent presentation to the 26S proteasome for proteasomal degradation of the mitochondrial proteins in somatic cells (35).”
BackgroundBlythe, E. E., Olson, K. C., Chau, V., & Deshaies, R. J. (2017) · Proceedings of the National Academy of Sciences · doi:10.1073/pnas.1706205114 · Cited by 178
USP30 deubiquitylates mitochondrial Parkin substrates and restricts apoptotic cell death
Liang, J. R., Martinez, A., Lane, J. D., Mayor, U., Clague, M. J., & Urbé, S. (2015) · EMBO Reports · doi:10.15252/embr.201439820 · Cited by 174
Structure and function of the AAA+ ATPase p97/Cdc48p
Xia, D., Tang, W. K., & Ye, Y. (2016) · Gene · doi:10.1016/j.gene.2016.02.042 · Cited by 168
“In mammalian cells, p97 is localized mainly to the cytoplasm with a fraction associated with the membranes of subcellular organelles such as the ER, Golgi, mitochondria, and endosomes (Acharya et al., 1995; Latterich et al., 1995; Rabouille et al., 1995; Ramanathan and Ye, 2012; Xu et al., 2011).”
Ubiquitin-dependent chloroplast-associated protein degradation in plants
Ling, Q., Broad, W. J., Trösch, R., Töpel, M., Demiral, T., Lymperopoulos, P., Baldwin, A. J., & Jarvis, P. (2019) · Science · doi:10.1126/science.aav4467 · Cited by 162
“To address the hypothesis that CDC48 is similarly involved in the extraction of substrates from the chloroplast OEM, we conducted retrotranslocation assays by using two complementary methodologies (23, 30, 31).”
MethodHänzelmann, P., & Schindelin, H. (2017) · Frontiers in Molecular Biosciences · doi:10.3389/fmolb.2017.00021 · Cited by 160
“, 2011; Wolf and Stolz, 2012) and similarly translocates damaged mitochondrial proteins into the cytosol in a process called outer mitochondrial membrane associated degradation (OMMAD; Heo et al., 2010; Xu et al., 2011; Hemion et al., 2014); p97 is also part of the ribosome-quality control complex (RQC), which is invo…”
BackgroundA Futile Battle? Protein Quality Control and the Stress of Aging
Higuchi‐Sanabria, R., Frankino, P. A., Paul, J. W., Tronnes, S. U., & Dillin, A. G. (2018) · Developmental Cell · doi:10.1016/j.devcel.2017.12.020 · Cited by 153
“These ubiquitinated proteins recruit p97 (Cdc48p in yeast), which extracts the ubiquitinated proteins from the mitochondria and presents them to the proteasome for degradation, reminiscent of the process of ERassociated degradation (ERAD) described below (Chatenay-Lapointe and Shadel, 2010; Xu et al., 2011).”
BackgroundXu, S., Cherok, E., Das, S., Li, S., Roelofs, B. A., Ge, S. X., Polster, B. M., Boyman, L., Lederer, W. J., Wang, C., et al. (2015) · Molecular Biology of the Cell · doi:10.1091/mbc.e15-09-0678 · Cited by 146
“Bioenergetic dysfunctions can also induce mitochondrial fragmentation, mostly through abnormal processing of Opa1 and consequent inhibition of mitochondrial fusion (for a review, see Karbowski, 2010; Chan, 2012).”
BackgroundMethodInfluentialSelf-citationUbiquitin-Dependent Degradation of Mitochondrial Proteins Regulates Energy Metabolism
Lavie, J., Belvalet, H. D., Sonon, S., Ion, A. M., Dumon, E., Melser, S., Lacombe, D., Dupuy, J., Lalou, C., & Bénard, G. (2018) · Cell Reports · doi:10.1016/j.celrep.2018.05.013 · Cited by 136
Mitochondrial quality control pathways as determinants of metabolic health
Held, N. M., & Houtkooper, R. H. (2015) · BioEssays · doi:10.1002/bies.201500013 · Cited by 133
“In brief, mutations in the key proteins that regulate fusion and fission are associated with neurological disorders in which mutations in Mfn2 and Opa1 cause Charcot-MarieTooth neuropathy type 2A and autosomal dominant optic atrophy, respectively [90–92], and mutations in Drp1 cause a combined mitochondrial and peroxi…”
BackgroundInfluentialGolgi organization is regulated by proteasomal degradation
Eisenberg‐Lerner, A., Benyair, R., Hizkiahou, N., Nudel, N., Maor, R., Kramer, M. P., Shmueli, M. D., Zigdon, I., Lev, M. C., Ulman, A., et al. (2020) · Nature Communications · doi:10.1038/s41467-019-14038-9 · Cited by 128
Self-citationControl of membrane fluidity: the OLE pathway in focus
Ballweg, S., & Ernst, R. (2016) · Biological Chemistry · doi:10.1515/hsz-2016-0277 · Cited by 119
ULK1 promotes mitophagy via phosphorylation and stabilization of BNIP3
Poole, L. P., Bock-Hughes, A., Berardi, D. E., & Macleod, K. F. (2021) · Scientific Reports · doi:10.1038/s41598-021-00170-4 · Cited by 116
Ross, J. M., Olson, L., & Coppotelli, G. (2015) · International Journal of Molecular Sciences · doi:10.3390/ijms160819458 · Cited by 113
“Similarly with what has been described in the ERAD pathway, the Cdc48/p97 complex (cdc48: cell division control protein 48) seems to be required for the extraction of mitochondrial proteins in the MAD system [58].”
BackgroundTollip coordinates Parkin‐dependent trafficking of mitochondrial‐derived vesicles
Ryan, T. A., Phillips, E. O., Collier, C. L., Robinson, A., Routledge, D., Wood, R. E., Assar, E. A., & Tumbarello, D. A. (2020) · The EMBO Journal · doi:10.15252/embj.2019102539 · Cited by 114
“…number of alternative mitochondrial quality control pathways exist that require distinct membrane sources and are separate from canonical mitophagy (Xu et al , 2011; Soubannier et al , 2012; Abelio-vich et al , 2013; McLelland et al , 2014, 2016; Lazarou et al , 2015; Hughes et al , 2016; Burman…”
Segref, A., Kevei, É., Pokrzywa, W., Schmeißer, K., Mansfeld, J., Livnat‐Levanon, N., Ensenauer, R. E., Glickman, M. H., Ristow, M., & Hoppe, T. (2014) · Cell Metabolism · doi:10.1016/j.cmet.2014.01.016 · Cited by 106
“However, the levels of the OMM proteins mitofusin 2 (Mfn2) and Mcl1, important for mitochondrial fusion and apoptosis (Chan et al., 2011; Tanaka et al., 2010; Xu et al., 2011), did not increase in c.IVS4+2T > C patient cells (Figure 6F).”
Structure, Dynamics and Function of the 26S Proteasome
Mao, Y. (2020) · Sub-cellular biochemistry/Subcellular biochemistry · doi:10.1007/978-3-030-58971-4_1 · Cited by 111
Proteolytic control of mitochondrial function and morphogenesis
Anand, R., Langer, T., & Baker, M. J. (2012) · Biochimica et Biophysica Acta (BBA) - Molecular Cell Research · doi:10.1016/j.bbamcr.2012.06.025 · Cited by 113
The small GTPase Arf1 modulates mitochondrial morphology and function
Ackema, K. B., Hench, J., Böckler, S., Wang, S. C., Sauder, U., Mergentaler, H., Westermann, B., Bard, F., Frank, S., & Spang, A. (2014) · The EMBO Journal · doi:10.15252/embj.201489039 · Cited by 103
“Consistently, the mammalian Cdc48 homologue p97 promotes ubiquitylation and proteasome-dependent degradation of the mitofusins Mfn1 and Mfn2 (Tanaka et al, 2010).”
Cdc48: A Swiss Army Knife of Cell Biology
Baek, G. H., Cheng, H., Choe, V., Bao, X. R., Shao, J., Luo, S., & Rao, H. (2013) · Journal of Amino Acids · doi:10.1155/2013/183421 · Cited by 105
“The mitophagy involvement of Cdc48 is deemed to be indirect so far since Cdc48 is required for proteasome-mediated degradation of two GTPases Mfn1 and Mfn2 mitofusin that mediate mitochondria fusion [101, 102].”
BackgroundMutations in the Human AAA+ Chaperone p97 and Related Diseases
Tang, W. K., & Xia, D. (2016) · Frontiers in Molecular Biosciences · doi:10.3389/fmolb.2016.00079 · Cited by 99
“It does so by undergoing ATP-dependent conformational changes to generate mechanical forces necessary for substrate extraction (Acharya et al., 1995; Latterich et al., 1995; Rabouille et al., 1995; Xu et al., 2011; Ramanathan and Ye, 2012; Xia et al., 2016).”
BackgroundPINK1/Parkin-Dependent Mitochondrial Surveillance: From Pleiotropy to Parkinson's Disease
Mouton‐Liger, F., Jacoupy, M., Corvol, J., & Corti, O. (2017) · Frontiers in Molecular Neuroscience · doi:10.3389/fnmol.2017.00120 · Cited by 100
“The proteasome intervenes in cooperation with the AAA-ATPase p97/VCP/Cdc48 to degrade outer mitochondrial membrane proteins (Xu et al., 2011).”
Mitochondria-Associated Proteostasis
Ruan, L., Wang, Y., Zhang, X., Tomaszewski, A., McNamara, J. T., & Li, R. (2020) · Annual Review of Biophysics · doi:10.1146/annurev-biophys-121219-081604 · Cited by 95
Self-citationTurn-ON fluorescent affinity labeling using a small bifunctional O-nitrobenzoxadiazole unit
Yamaguchi, T., Asanuma, M., Nakanishi, S., Saito, Y., Okazaki, M., Dodo, K., & Sodeoka, M. (2013) · Chemical Science · doi:10.1039/c3sc52704b · Cited by 96
Mitochondrial Protein Quality Control: The Mechanisms Guarding Mitochondrial Health
Bohovych, I., Chan, S. S. L., & Khalimonchuk, O. (2014) · Antioxidants and Redox Signaling · doi:10.1089/ars.2014.6199 · Cited by 98
“The AAA + protein VCP/p97/Cdc48 complex is involved in multiple cellular processes but plays a key role in the extraction of ubiquitylated ER-and OM-anchored proteins for proteasomal degradation (37, 88, 193).”
Cherok, E., Xu, S., Li, S., Das, S., Meltzer, W. A., Zalzman, M., Wang, C., & Karbowski, M. (2016) · Molecular Biology of the Cell · doi:10.1091/mbc.e16-04-0208 · Cited by 94
“We also gratefully acknowledge financial support from the National Institute of General Medical Science (Grant RO1 GM083131 to M.K.).”
BackgroundMethodInfluentialSelf-citationDuncan, O., Taylor, N. L., Carrie, C., Eubel, H., Kubiszewski-Jakubiak, S., Zhang, B., Narsai, R., Millar, A. H., & Whelan, J. (2011) · PLANT PHYSIOLOGY · doi:10.1104/pp.111.183160 · Cited by 94
“7) but has been shown to be among the most stress-inducible transcripts encoding mitochondrial proteins (Van Aken et al., 2009), it may have a more specific role in the repair of proteins following a wide variety of stresses (Xu et al., 2011).”
BackgroundThe Role of the Transmembrane RING Finger Proteins in Cellular and Organelle Function
Nakamura, N. (2011) · Membranes · doi:10.3390/membranes1040354 · Cited by 92
“VCP, a critical mediator of ERAD, is recruited on mitochondria and contributes to proteasomal degradation of the MOM proteins MFN1, MFN2 and myeloid cell leukemia sequence-1 (MCL1) [237,239].”
BackgroundCheng, M., Liu, L., Lao, Y., Liao, W., Liao, M., Luo, X., Wu, J., Xie, W., Zhang, Y., & Xu, N. (2016) · Oncotarget · doi:10.18632/oncotarget.9786 · Cited by 92
“Previous studies have shown that ubiquitination of mitofusins MFN1 is induced by Parkin E3 ligase upon membrane depolarization and leads to the degradation in a proteasome-dependent manner upstream of mitophagy [36-38].”
BackgroundThe p97/VCP ATPase is critical in muscle atrophy and the accelerated degradation of muscle proteins
Piccirillo, R., & Goldberg, A. L. (2012) · The EMBO Journal · doi:10.1038/emboj.2012.178 · Cited by 85
“…and degradation of endoplasmic reticulum-associated proteins (ERAD) (Rape et al , 2001; Ye et al , 2001) as well as of mitochondrial proteins (Xu et al , 2011), membrane fusion events (Ye, 2006), myofibril biogenesis (Kim et al , 2008), chromatin dynamics (Ramadan et al , 2007) and autophagy…”
Deruyffelaere, C., Purkrtová, Z. H., Bouchez, I., Collet, B., Cacas, J., Chardot, T., Gallois, J., & d’Andrea, S. (2018) · The Plant Cell · doi:10.1105/tpc.18.00275 · Cited by 91
“The interaction between the MADS box transcription factors DEFICIENS and GLOBOSA was used as a positive control and performed by coinfiltration with the pBIFP2-DEF and pBIFP3-GLO constructs (Ferrario et al., 2003).”
BackgroundInfluentialParkin is a disease modifier in the mutant SOD1 mouse model of ALS
Palomo, G. M., Granatiero, V., Kawamata, H., Konràd, C., Kim, M. J., Arreguin, A. J., Zhao, D., Milner, T. A., & Manfredi, G. (2018) · EMBO Molecular Medicine · doi:10.15252/emmm.201808888 · Cited by 88
Doa1 targets ubiquitinated substrates for mitochondria-associated degradation
Wu, X., Li, L., & Jiang, H. (2016) · The Journal of Cell Biology · doi:10.1083/jcb.201510098 · Cited by 99
Zhang, T., Mishra, P., Hay, B. A., Chan, D. C., & Guo, M. (2017) · eLife · doi:10.7554/elife.17834 · Cited by 85
“In Hela cells, VCP promotes Mfn 1 degradation (Xu et al., 2011).”
BackgroundMitochondrial dismissal in mammals, from protein degradation to mitophagy
Campello, S., Strappazzon, F., & Cecconi, F. (2013) · Biochimica et Biophysica Acta (BBA) - Bioenergetics · doi:10.1016/j.bbabio.2013.11.010 · Cited by 88
“to the cytosol, prior to, or concurrent with, proteasomal degradation, in a p97 ATPase domain-dependent manner [75].”
BackgroundMitochondrial Quality Control and Cellular Proteostasis: Two Sides of the Same Coin
Quiles, J. M., & Gustafsson, Å. B. (2020) · Frontiers in Physiology · doi:10.3389/fphys.2020.00515 · Cited by 86
“The AAA-ATPase p97 is required for the extraction of specific substrates such as MCL1 (Xu et al., 2011) and the general degradation of oxidized OMM proteins (Hemion et al.”
BackgroundProteomics of muscle chronological ageing in post-menopausal women
Gueugneau, M., Coudy‐Gandilhon, C., Gourbeyre, O., Chambon, C., Combaret, L., Polge, C., Taillandier, D., Attaix, D., Friguet, B., Maier, A. B., et al. (2014) · BMC Genomics · doi:10.1186/1471-2164-15-1165 · Cited by 82
“and mitochondrial membrane proteins [105].”
Aishwarya, R., Alam, S., Abdullah, C. S., Morshed, M., Nitu, S. S., Panchatcharam, M., Miriyala, S., Kevil, C. G., & Bhuiyan, M. S. (2020) · Redox Biology · doi:10.1016/j.redox.2020.101660 · Cited by 82
“We also observed a significant decrease in the expression of AAA-ATPase VCP (valosin-containing protein), which is essential for outer mitochondrial membrane protein turnover [31], and small Rab GTPase Rab24 (Ras-related protein Rab-24), which is involved in mitochondrial fission and activation [32].”
BackgroundUllah, H., Minno, A. D., Santarcangelo, C., Khan, H. Z., & Daglia, M. (2021) · Antioxidants · doi:10.3390/antiox10040546 · Cited by 81
“Mitofusins could be targeted to prevent refusion of impaired mitochondria within healthy networks, and these are eliminated by valosin-containing protein via mitochondria-associated degradation by 26 S proteosome [65,66].”
BackgroundDargemont, C., & Ossareh‐Nazari, B. (2011) · Biochimica et Biophysica Acta (BBA) - Molecular Cell Research · doi:10.1016/j.bbamcr.2011.07.011 · Cited by 81
Ubiquitin-dependent mitochondrial protein degradation
Heo, J.-M., & Rutter, J. P. (2011) · The International Journal of Biochemistry & Cell Biology · doi:10.1016/j.biocel.2011.06.002 · Cited by 76
“Consistent with this idea, several studies have shown that Cdc48 (the yeast ortholog of p97 or VCP in mammals) participates in such an activity (Tanaka et al., 2010; Xu et al., 2011; Heo et al., 2010).”
BackgroundChatty Mitochondria: Keeping Balance in Cellular Protein Homeostasis
Topf, U., Wróbel, L., & Chacińska, A. (2016) · Trends in Cell Biology · doi:10.1016/j.tcb.2016.03.002 · Cited by 76
The Amazing Ubiquitin-Proteasome System: Structural Components and Implication in Aging
Tsakiri, E. N., & Trougakos, I. P. (2014) · International review of cytology · doi:10.1016/bs.ircmb.2014.09.002 · Cited by 81
Emerging roles of mitochondria in the evolution, biogenesis, and function of peroxisomes
Mohanty, A., & McBride, H. M. (2013) · Frontiers in Physiology · doi:10.3389/fphys.2013.00268 · Cited by 76
Exploring new pathways of neurodegeneration in ALS: The role of mitochondria quality control
Palomo, G. M., & Manfredi, G. (2014) · Brain Research · doi:10.1016/j.brainres.2014.09.065 · Cited by 81
Erjavec, N., Bayot, A., Gareil, M., Camougrand, N. M., Nyström, T., Friguet, B., & Bulteau, A. (2012) · Free Radical Biology and Medicine · doi:10.1016/j.freeradbiomed.2012.11.019 · Cited by 67
Swerdlow, N., & Wilkins, H. (2020) · International Journal of Molecular Sciences · doi:10.3390/ijms21249661 · Cited by 66
“Damaged mitochondrial proteins can also be targeted specifically for proteasome degradation by p97 through the proteasome [38].”
BackgroundVDAC3 As a Potential Marker of Mitochondrial Status Is Involved in Cancer and Pathology
Reina, S., Guarino, F., Magrì, A., & Pinto, V. D. (2016) · Frontiers in Oncology · doi:10.3389/fonc.2016.00264 · Cited by 68
“Also, the ERAD (69, 70), where the endoplasmic reticulum faces accumulation of mis-folded or unfolded proteins, was found well represented with proteins like chaperones, oxidases, and thiolisomerases (i.e., protein disulfide isomerases, calreticulin) (62).”
BackgroundInfluentialZhao, N., Zhang, A., Worthen, C., Knutson, M. D., & Enns, C. A. (2014) · Proceedings of the National Academy of Sciences · doi:10.1073/pnas.1405355111 · Cited by 66
“Recent studies show that p97 is also involved in extracting the mitochondrial outer membrane proteins, Mcl1 and Mfn1 (33, 34).”
BackgroundMitochondrial Quality Control Governed by Ubiquitin
Ravanelli, S., den Brave, F., & Hoppe, T. (2020) · Frontiers in Cell and Developmental Biology · doi:10.3389/fcell.2020.00270 · Cited by 66
A protein quality control pathway at the mitochondrial outer membrane
Metzger, M. B., Scales, J. L., Dunklebarger, M., Lončarek, J., & Weissman, A. M. (2020) · eLife · doi:10.7554/elife.51065 · Cited by 62
AAA+ ATPases in Protein Degradation: Structures, Functions and Mechanisms
Zhang, S., & Mao, Y. (2020) · Biomolecules · doi:10.3390/biom10040629 · Cited by 64
Munkácsy, E., Khan, M. H., Lane, R. K., Borror, M. B., Park, J. H., Bokov, A. F., Fisher, A. L., Link, C. D., & Rea, S. L. (2016) · PLoS Genetics · doi:10.1371/journal.pgen.1006133 · Cited by 60
“The MAD pathway functions analogously to the endoplasmic reticulum-associated degradation (ERAD) pathway [85] to retrieve and degrade dysfunctional OMM proteins [86, 87].”
BackgroundDynamic survey of mitochondria by ubiquitin
Escobar‐Henriques, M., & Langer, T. (2014) · EMBO Reports · doi:10.1002/embr.201338225 · Cited by 61
Role of autophagy in muscle disease
Franco‐Romero, A., & Sandri, M. (2021) · Molecular Aspects of Medicine · doi:10.1016/j.mam.2021.101041 · Cited by 65
Saladi, S., Boos, F., Poglitsch, M., Meyer, H., Sommer, F., Mühlhaus, T., Schroda, M., Schuldiner, M., Madeo, F., & Herrmann, J. M. (2019) · Molecular Cell · doi:10.1016/j.molcel.2019.09.027 · Cited by 56
Song, W., Ballard, J. W. O., Yi, Y., & Šutovský, P. (2014) · BioMed Research International · doi:10.1155/2014/981867 · Cited by 63
“The degradation of OMM-associated proteins, such as Mfn1 and Mcl2, is mediated by 26S proteasome in VCP-dependent manner [126, 127].”
Chen, J., Bassot, A., Giuliani, F., & Simmen, T. (2021) · Cells · doi:10.3390/cells10071789 · Cited by 58
“The VCP gene product acts as a ubiquitin-specific chaperone, controlling proteasomal protein degradation at the ER [157], mitochondria [158] and lysosomes [159].”
BackgroundA non‐canonical role of the p97 complex in RIG‐I antiviral signaling
Qian, H., Jiao, S., Shi, Z., Li, C., Meng, X., Zhang, Z., Wang, Y., Song, X., Wang, W., Zhang, R., et al. (2015) · The EMBO Journal · doi:10.15252/embj.201591888 · Cited by 57
“…ER-and mitochondria-associated degradation (Ye et al , 2001; Jarosch et al , 2002; Rabinovich et al , 2002; Heo et al , 2010; Tanaka et al , 2010; Xu et al , 2011), autophagy (Ju et al , 2009; Vesa et al , 2009; Krick et al , 2010; Tresse et al , 2010), membrane reassembly (Latterich et al ,…”
Self-citation
Metadata
- Authors
- Xu, S., Peng, G., Wang, Y., Fang, S., & Karbowski, M.
- Affiliations
- University of Maryland, Baltimore (US)
- Corresponding author
- Karbowski, Mariusz
- Venue
- Molecular Biology of the Cell
- Published
- 2011-02
- Volume
- 22
- Issue
- 3
- Pages
- 291-300
- ISSN
- 1059-1524 (ISSN-L)
- 1939-4586
- PMC
- PMC3031461
- OpenAlex
- W2082069715
- Cited by
- 243
- References
- 46
- Citations by year
- 2026: 5 · 2025: 6 · 2024: 12 · 2023: 14 · 2022: 12 · 2021: 16 · 2020: 21 · 2019: 16 · 2018: 17 · 2017: 15 · 2016: 23 · 2015: 15 · 2014: 23 · 2013: 19 · 2012: 16
- FWCI
- 6.26
- Type
- journal article
- Language
- en
- Open access
- green
- www.ncbi.nlm.nih.gov
- Licence
- cc-by-nc-sa
- Locations
- Molecular Biology of the Cell (publishedVersion)
- Europe PMC (PubMed Central) (publishedVersion, cc-by-nc-sa)
- PubMed Central (publishedVersion, cc-by-nc-sa)
- PubMed (publishedVersion)
- Funders
- National Institute of General Medical Sciences (R01GM083131)
- Topics
- Life Sciences › Biochemistry, Genetics and Molecular Biology › Molecular Biology › Ubiquitin and proteasome pathways
- Life Sciences › Biochemistry, Genetics and Molecular Biology › Cell Biology › Autophagy in Disease and Therapy
- Life Sciences › Biochemistry, Genetics and Molecular Biology › Molecular Biology › Heat shock proteins research
- Keywords
- VCP, AAA+ ATPase, mitochondrial outer membrane, protein turnover, proteasomal degradation, Mcl-1, Mfn1, retrotranslocation, ubiquitin-proteasome system, mitochondrial protein degradation, ATPase domain
- MeSH terms
- Adenosine Triphosphatases, Cytosol, HeLa Cells, Humans, Nuclear Proteins, Recombinant Fusion Proteins, Protein Structure, Tertiary, Proto-Oncogene Proteins c-bcl-2, GTP Phosphohydrolases, Protein Transport, Mitochondrial Proteins, Membrane Transport Proteins, Mitochondrial Membrane Transport Proteins, Proteasome Endopeptidase Complex, Green Fluorescent Proteins, Mitochondrial Membranes, Protein Stability, Myeloid Cell Leukemia Sequence 1 Protein
About these checks
Registry, retraction, Cites and statistics results are computed, not judged, with one exception: a printed reference that no index lists is read once by a model before it counts as a citation error. Claims are extracted by a model and kept only when their quote appears verbatim in the text; each cited source is then checked, with a model’s help, for whether it says what the claim relies on. Those verdicts can be wrong — read the claim’s quote and the cited source before relying on one.
Statistics and arithmetic are recomputed, not judged.
Confidence bands are shown only for fields calibrated on our annotated test set. None is calibrated yet, so no band is shown.
What counts as a claim ›How we measure confidence ›How we check this ›
Are you an author, or do you see a problem with this page? Request a review
