

The DOI matches its Crossref record; 19 of the 19 references it cites were found in a registry or an index.
Impaired glymphatic function and clearance of tau in an Alzheimer’s disease model
Abstract
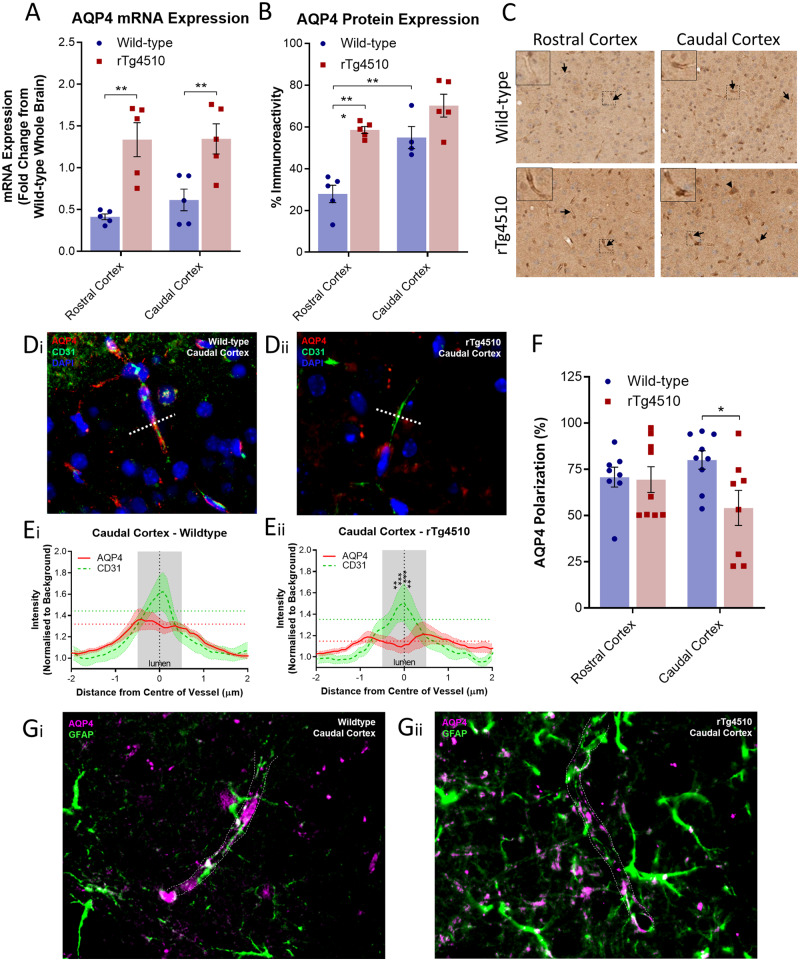
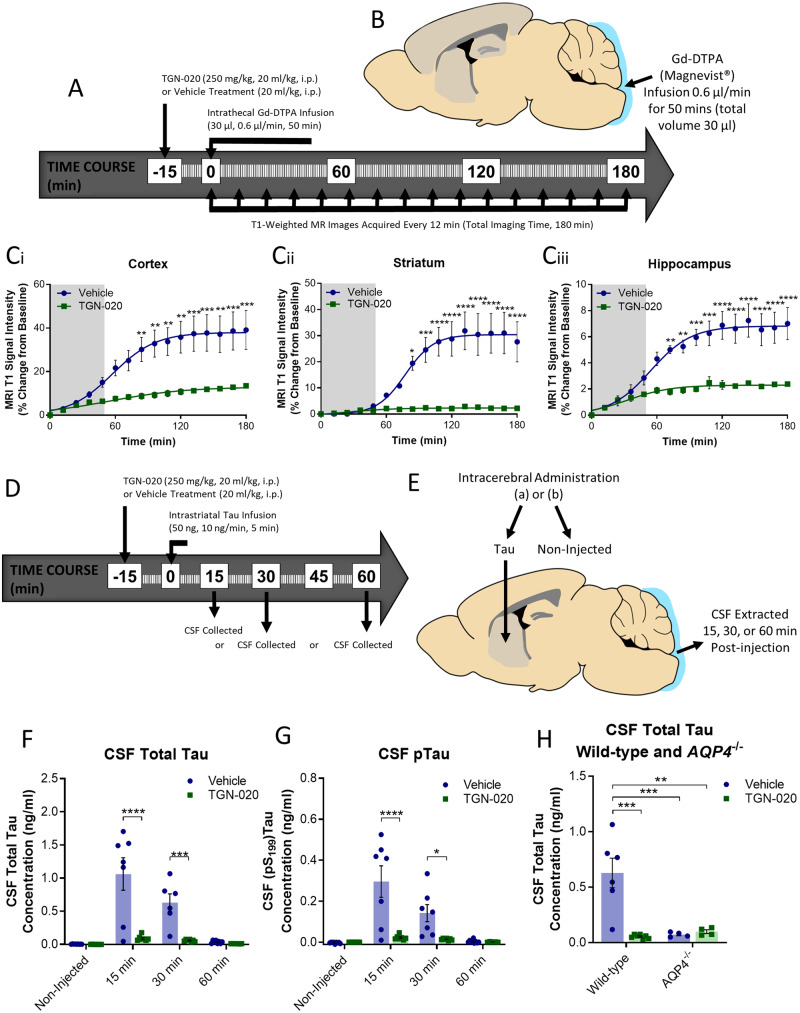
The glymphatic system, that is aquaporin 4 (AQP4) facilitated exchange of CSF with interstitial fluid (ISF), may provide a clearance pathway for protein species such as amyloid-β and tau, which accumulate in the brain in Alzheimer’s disease. Further, tau protein transference via the extracellular space, the compartment that is cleared by the glymphatic pathway, allows for its neuron-to-neuron propagation, and the regional progression of tauopathy in the disorder. The glymphatic system therefore represents an exciting new target for Alzheimer’s disease. Here we aim to understand the involvement of glymphatic CSF-ISF exchange in tau pathology. First, we demonstrate impaired CSF-ISF exchange and AQP4 polarization in a mouse model of tauopathy, suggesting that this clearance pathway may have the potential to exacerbate or even induce pathogenic accumulation of tau. Subsequently, we establish the central role of AQP4 in the glymphatic clearance of tau from the brain; showing marked impaired glymphatic CSF-ISF exchange and tau protein clearance using the novel AQP4 inhibitor, TGN-020. As such, we show that this system presents as a novel druggable target for the treatment of Alzheimer’s disease, and possibly other neurodegenerative diseases alike.
Overview
The claims and statistics of this paper haven’t been checked yet.
Run the check — free, no account needed. It reads the open-access text and checks the sources it cites.
Integrity signals
Registry
Cites
Statistics
Figures
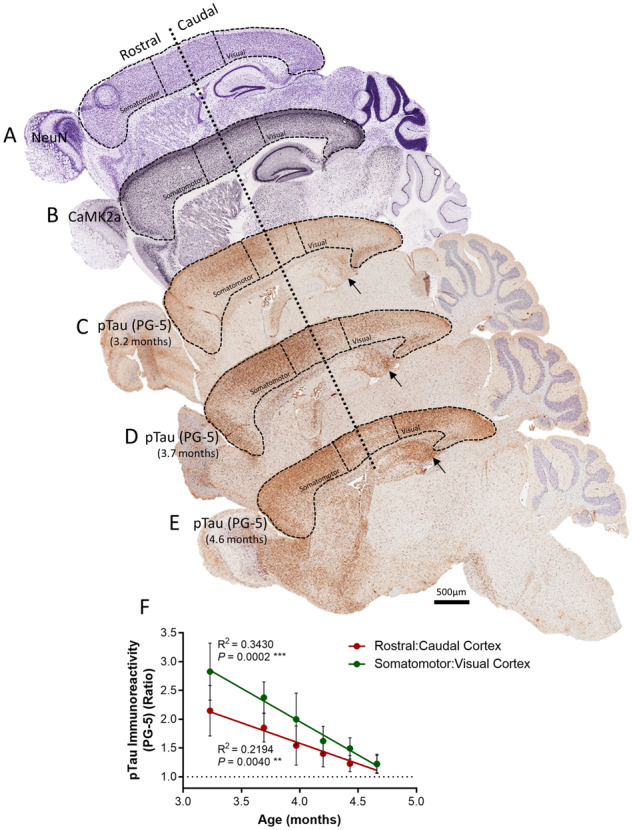
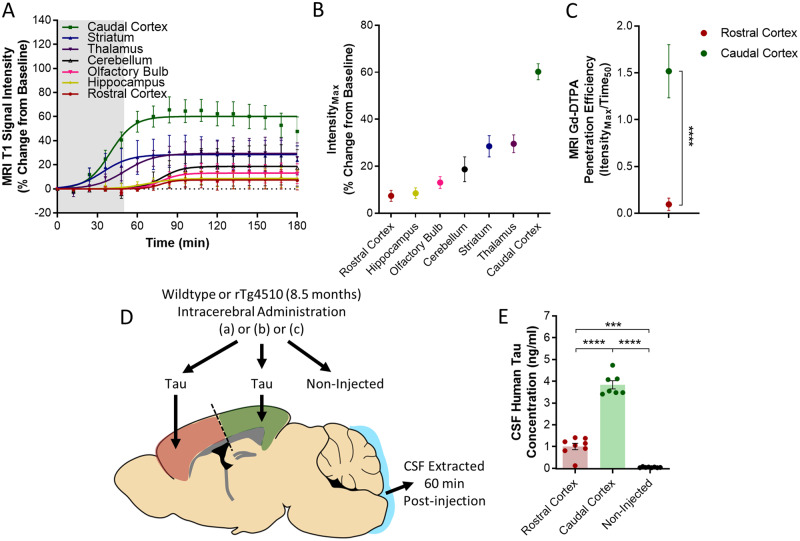
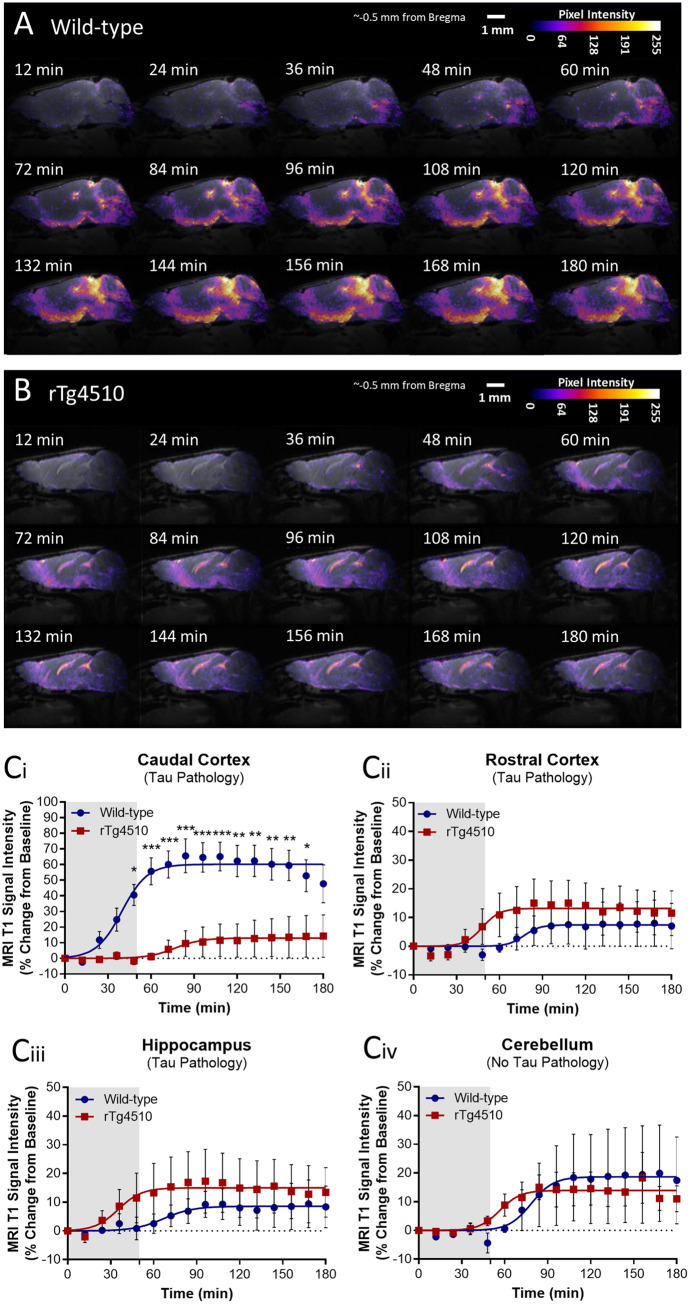
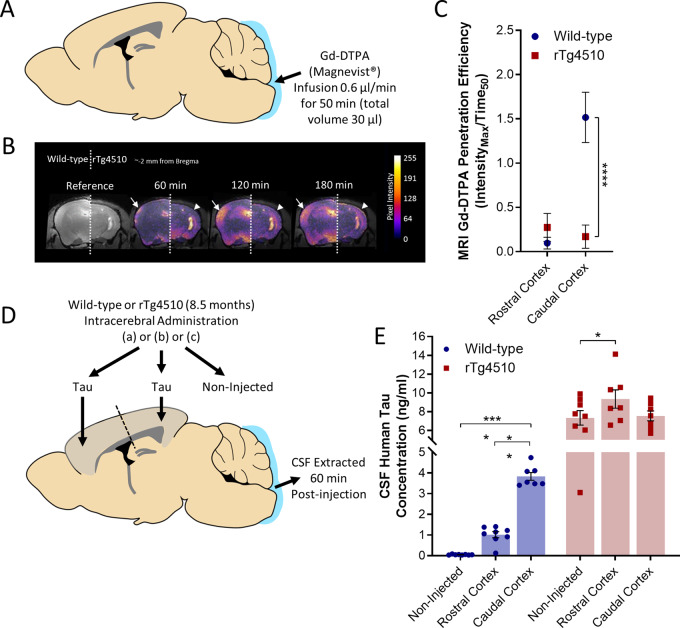
Verification
Claims the paper makes
The claims and statistics of this paper haven’t been checked yet.
Run the check — free, no account needed. It reads the open-access text and checks the sources it cites.
Claims other papers make about this one
Each is checked against this paper’s own text: does it say what the citing paper says it does?
The source backs part of the claim, not all of it — or backs it for a different population, condition or comparison.
In the citing paper
“Aquaporin-4 (Aqp4) is upregulated in the rTg4510 model of tauopathy, but exhibits reduced polarization towards astrocytic endfeet in reactive astrocytes in response to tau pathology (Harrison et al., 2020).”
From Selective removal of astrocytic APOE4 strongly protects against tau-mediated neurodegeneration and decreases synaptic phagocytosis by microglia (2021) · cites this paper as Harrison et al., 2020
Experimental — accuracy not yet measured
Self-check
Percentages, sums and reported differences re-computed from the paper’s own numbers.
The self-check needs the paper’s full text.
Citations
Cites
Amyloid oligomers exacerbate tau pathology in a mouse model of tauopathy
Selenica, M.-L. B., Brownlow, M., Jimenez, J. P., Lee, D. C., Pena, G., Dickey, C. A., Gordon, M. N., & Morgan, D. (2013) · Neurodegenerative Diseases · doi:10.1159/000337230 · Cited by 10,359
Iliff, J. J., Wang, M., Liao, Y., Plogg, B. A., Peng, W., Gundersen, G. A., Benveniste, H., Vates, G. E., Deane, R., Goldman, S. A., et al. (2012) · Science Translational Medicine · doi:10.1126/scitranslmed.3003748 · Cited by 5,824
Self-citationSleep Drives Metabolite Clearance from the Adult Brain
Xie, L., Kang, H., Xu, Q., Chen, M. J., Liao, Y., Thiyagarajan, M., O’Donnell, J., Christensen, D. J., Nicholson, C., Iliff, J. J., et al. (2013) · Science · doi:10.1126/science.1241224 · Cited by 5,411
Structural and functional features of central nervous system lymphatic vessels
Louveau, A., Smirnov, I., Keyes, T. J., Eccles, J. D., Rouhani, S. J., Peske, J. D., Derecki, N. C., Castle, D., Mandell, J. W., Lee, K. S., et al. (2015) · Nature · doi:10.1038/nature14432 · Cited by 4,413
The glymphatic system: a beginner's guide
Jessen, N. A., Munk, A. S. F., Lundgaard, I., & Nedergaard, M. (2015) · Neurochemical Research · doi:10.1007/s11064-015-1581-6 · Cited by 2,075
Impairment of paravascular clearance pathways in the aging brain
Kress, B. T., Iliff, J. J., Xia, M., Wang, M., Wei, H. S., Zeppenfeld, D., Xie, L., Kang, H., Xu, Q., Liew, J. A., et al. (2014) · Annals of Neurology · doi:10.1002/ana.24271 · Cited by 1,521 · cited 8×
“Reactive astrogliosis, though common place in degenerative Alzheimer’s disease phenotypes, is associated with increased AQP4 expression, and reduced AQP4 polarization (Iliff et al., 2014; Kress et al., 2014).”
BackgroundMethodInfluentialCerebral Arterial Pulsation Drives Paravascular CSF–Interstitial Fluid Exchange in the Murine Brain
Iliff, J. J., Wang, M., Zeppenfeld, D. M., Venkataraman, A., Plog, B. A., Liao, Y., Deane, R., & Nedergaard, M. (2013) · The Journal of Neuroscience · doi:10.1523/jneurosci.1592-13.2013 · Cited by 1,319
Brain-wide pathway for waste clearance captured by contrast-enhanced MRI
Iliff, J. J., Lee, H., Yu, M., Feng, T., Logan, J., Nedergaard, M., & Benveniste, H. (2013) · Journal of Clinical Investigation · doi:10.1172/jci67677 · Cited by 1,148
Goldstein, L. E., Fisher, A. M., Tagge, C. A., Zhang, X.-L., Velisek, L., Sullivan, J. A., Upreti, C., Kracht, J. M., Ericsson, M., Wojnarowicz, M. W., et al. (2012) · Science Translational Medicine · doi:10.1126/scitranslmed.3003716 · Cited by 958
Self-citationPhysiological Roles of Aquaporin-4 in Brain
Nagelhus, E. A., & Ottersen, O. P. (2013) · Physiological Reviews · doi:10.1152/physrev.00011.2013 · Cited by 766
Self-citation
Research works printed but not linked: 41
- Achariyar, 2016, Glymphatic distribution of CSF-derived apoE into brain is isoform specific and suppressed during sleep deprivation, Mol Neurodegener, 11, 74, 10.1186/s13024-016-0138-8 · DOI
- Ahmed, 2014, A novel in vivo model of tau propagation with rapid and progressive neurofibrillary tangle pathology: the pattern of spread is determined by connectivity, not proximity, Acta Neuropathol, 127, 667, 10.1007/s00401-014-1254-6 · DOI
- Amiry-Moghaddam, 2004, Anchoring of aquaporin-4 in brain: molecular mechanisms and implications for the physiology and pathophysiology of water transport, Neuroscience, 129, 997, 10.1016/j.neuroscience.2004.08.049 · DOI
- Amiry-Moghaddam, 2003, An α-syntrophin-dependent pool of AQP4 in astroglial end-feet confers bidirectional water flow between blood and brain, Proc Natl Acad Sci USA, 100, 2106, 10.1073/pnas.0437946100 · DOI · Paper page
- Bedussi, 2016, Paravascular channels, cisterns, and the subarachnoid space in the rat brain: a single compartment with preferential pathways, J Cereb Blood Flow Metab, 37, 1374, 10.1177/0271678X16655550 · DOI
- Bloch, 2006, Accelerated progression of Kaolin-induced hydrocephalus in aquaporin-4-deficient mice, J Cereb Blood Flow Metab, 26, 1527, 10.1038/sj.jcbfm.9600306 · DOI
- Braak, 1995, Staging of Alzheimer’s disease-related neurofibrillary changes, Neurobiol Aging, 16, 271, 10.1016/0197-4580(95)00021-6 · DOI · Paper page
- Camassa, 2015, Mechanisms underlying AQP4 accumulation in astrocyte endfeet, Glia, 63, 2073, 10.1002/glia.22878 · DOI
- Chesser, 2013, Tau clearance mechanisms and their possible role in the pathogenesis of Alzheimer disease, Front Neurol, 4
- Gaberel, 2014, Impaired glymphatic perfusion after strokes revealed by contrast-enhanced MRI: a new target for fibrinolysis?, Stroke, 45, 3092, 10.1161/STROKEAHA.114.006617 · DOI
- Giannakopoulos, 2003, Tangle and neuron numbers, but not amyloid load, predict cognitive status in Alzheimer’s disease, Neurology, 60, 1495, 10.1212/01.WNL.0000063311.58879.01 · DOI · Paper page
- Glabe, 2001, Intracellular mechanisms of amyloid accumulation and pathogenesis in Alzheimer’s disease, J Mol Neurosci, 17, 137, 10.1385/JMN:17:2:137 · DOI · Paper page
- Goedert, 2017, Propagation of tau aggregates and neurodegeneration, Annu Rev Neurosci, 40, 189, 10.1146/annurev-neuro-072116-031153 · DOI · Paper page
- Hadjihambi, 2019, Impaired brain glymphatic flow in experimental hepatic encephalopathy, J Hepatol, 70, 40, 10.1016/j.jhep.2018.08.021 · DOI
- Hawkes, 2014, Failure of perivascular drainage of β-amyloid in cerebral amyloid angiopathy, Brain Pathol, 24, 396, 10.1111/bpa.12159 · DOI
- Holmes, 2016, Imaging the accumulation and suppression of tau pathology using multiparametric MRI, Neurobiol Aging, 39, 184, 10.1016/j.neurobiolaging.2015.12.001 · DOI · Paper page
- Holter, 2017, Interstitial solute transport in 3D reconstructed neuropil occurs by diffusion rather than bulk flow, Proc Natl Acad Sci USA, 114, 9894, 10.1073/pnas.1706942114 · DOI · Paper page
- Huber, 2009, Identification of aquaporin 4 inhibitors using in vitro and in silico methods, Bioorg Med Chem, 17, 411, 10.1016/j.bmc.2007.12.040 · DOI
- Igarashi, 2013, Inhibition of aquaporin-4 significantly increases regional cerebral blood flow, Neuroreport, 24, 324, 10.1097/WNR.0b013e32835fc827 · DOI
- Iliff, 2014, Impairment of glymphatic pathway function promotes tau pathology after traumatic brain injury, J Neurosci, 34, 16180, 10.1523/JNEUROSCI.3020-14.2014 · DOI · Paper page
- Lewis, 2016, Propagation of tau pathology: hypotheses, discoveries, and yet unresolved questions from experimental and human brain studies, Acta Neuropathol, 131, 27, 10.1007/s00401-015-1507-z · DOI
- Louveau, 2017, Understanding the functions and relationships of the glymphatic system and meningeal lymphatics, J Clin Invest, 127, 3210, 10.1172/JCI90603 · DOI · Paper page
- Lundgaard, 2016, Glymphatic clearance controls state-dependent changes in brain lactate concentration, J Cereb Blood Flow Metab, 37, 2112, 10.1177/0271678X16661202 · DOI
- Matarin, 2015, A genome-wide gene-expression analysis and database in transgenic mice during development of amyloid or tau pathology, Cell Rep, 10, 633, 10.1016/j.celrep.2014.12.041 · DOI · Paper page
- Medina, 2014, The role of extracellular Tau in the spreading of neurofibrillary pathology, Front Cell Neurosci, 8, 113, 10.3389/fncel.2014.00113 · DOI · Paper page
- Mestre, 2018, Aquaporin-4-dependent glymphatic solute transport in the rodent brain, eLife, 7, e40070, 10.7554/eLife.40070 · DOI · Paper page
- Nedergaard, 2013, Garbage truck of the brain, Science, 340, 1529, 10.1126/science.1240514 · DOI · Paper page
- Peng, 2016, Suppression of glymphatic fluid transport in a mouse model of Alzheimer’s disease, Neurobiol Dis, 93, 215, 10.1016/j.nbd.2016.05.015 · DOI · Paper page
- Plog, 2015, Biomarkers of traumatic injury are transported from brain to blood via the glymphatic system, J Neurosci, 35, 518, 10.1523/JNEUROSCI.3742-14.2015 · DOI · Paper page
- Ramsden, 2005, Age-dependent neurofibrillary tangle formation, neuron loss, and memory impairment in a mouse model of human tauopathy (P301L), J Neurosci, 25, 10637, 10.1523/JNEUROSCI.3279-05.2005 · DOI · Paper page
- Smith, 2018, The “glymphatic” mechanism for solute clearance in Alzheimer’s disease: game changer or unproven speculation?, FASEB J, 32, 543, 10.1096/fj.201700999 · DOI
- Syková, 2005, Changes in extracellular space size and geometry in APP23 transgenic mice: A model of Alzheimer’s disease, Proc Natl Acad Sci USA, 102, 479, 10.1073/pnas.0408235102 · DOI · Paper page
- Tarasoff-Conway, 2015, Clearance systems in the brain-implications for Alzheimer disease, Nat Rev Neurol, 11, 457, 10.1038/nrneurol.2015.119 · DOI · Paper page
- Verkman, 2017, Aquaporin water channels and hydrocephalus, Pediatr Neurosurg, 52, 409, 10.1159/000452168 · DOI
- Weller, 2008, SYMPOSIUM: clearance of Aβ from the brain in Alzheimer’s Disease: perivascular drainage of amyloid-β peptides from the brain and its failure in cerebral amyloid angiopathy and Alzheimer’s disease, Brain Pathol, 18, 253, 10.1111/j.1750-3639.2008.00133.x · DOI
- Wu, 2016, Neuronal activity enhances tau propagation and tau pathology in vivo, Nat Neurosci, 19, 1085, 10.1038/nn.4328 · DOI · Paper page
- Xiong, 2017, Precise cerebral vascular Atlas in stereotaxic coordinates of whole mouse brain, Front Neuroanat, 11, 128, 10.3389/fnana.2017.00128 · DOI
- Xu, 2015, Deletion of aquaporin-4 in APP/PS1 mice exacerbates brain Aβ accumulation and memory deficits, Mol Neurodegener, 10, 58, 10.1186/s13024-015-0056-1 · DOI · Paper page
- Yang, 2011, Loss of astrocyte polarization in the Tg-ArcSwe mouse model of Alzheimer’s disease, J Alzheimers Dis, 27, 711, 10.3233/JAD-2011-110725 · DOI
- Zemlan, 2002, C-tau biomarker of neuronal damage in severe brain injured patients: association with elevated intracranial pressure and clinical outcome, Brain Res, 947, 131, 10.1016/S0006-8993(02)02920-7 · DOI
- Zeppenfeld, 2016, Association of perivascular localization of aquaporin-4 with cognition and alzheimer disease in aging brains, JAMA Neurol, 74, 91, 10.1001/jamaneurol.2016.4370 · DOI · Paper page
Cited by
Sorted by citations
Wang, C., Xiong, M., Gratuze, M., Bao, X., Shi, Y., Andhey, P. S., Manis, M., Schroeder, C., Yin, Z., Madore, C., et al. (2021) · Neuron · doi:10.1016/j.neuron.2021.03.024 · Cited by 334
Sun, Y., Koyama, Y., & Shimada, S. (2022) · Frontiers in Aging Neuroscience · doi:10.3389/fnagi.2022.903455 · Cited by 304
Astrocyte Endfeet in Brain Function and Pathology: Open Questions
Díaz-Castro, B., Robel, S., & Mishra, A. (2023) · Annual Review of Neuroscience · doi:10.1146/annurev-neuro-091922-031205 · Cited by 238
Aquaporin-4 and Cognitive Disorders
Wang, Y., Huang, C., Guo, Q., & Chu, H. (2022) · Aging and disease · doi:10.14336/ad.2021.0731 · Cited by 55
Chronic sleep fragmentation impairs brain interstitial clearance in young wildtype mice
Deng, S., Hu, Y., Chen, S., Xue, Y., Yao, D., Sun, Q., Nedergaard, M., Wang, W., & Ding, F. (2024) · Journal of Cerebral Blood Flow & Metabolism · doi:10.1177/0271678x241230188 · Cited by 52
Dong, H., Dai, X., Zhou, Y., Shi, C., Bhuiyan, P., Sun, Z., Li, N., & Jin, W. (2024) · Journal of Neuroinflammation · doi:10.1186/s12974-024-03028-4 · Cited by 27
The brain washing system in sepsis-associated encephalopathy
Chen, T., Hu, J., Liao, Y., Xie, S., & Zhang, L. (2025) · Journal of Neuroinflammation · doi:10.1186/s12974-025-03602-4 · Cited by 8
Metadata
- Authors
- Harrison, I. F., Ismail, O., Machhada, A., Colgan, N., Ohene, Y., Nahavandi, P., Ahmed, Z., Fisher, A., Meftah, S., Murray, T. K., Ottersen, O. P., Nagelhus, E. A., O’Neill, M. J., Wells, J. A., & Lythgoe, M. F.
- Affiliations
- UCL Centre for Advanced Biomedical Imaging, Department of Imaging, Division of Medicine, University College London, London, UK
- Eli Lilly and Company, Erl Wood Manor, Windlesham, Surrey, UK
- Office of the President, Karolinska Institutet, Stockholm, Sweden
- Institute of Basic Medical Sciences, University of Oslo, Oslo, Norway
- Venue
- Brain
- Publisher
- Oxford University Press (OUP)
- Published
- 2020-07-23
- Volume
- 143
- Issue
- 8
- Pages
- 2576-2593
- ISSN
- 0006-8950
- 1460-2156
- PMC
- PMC7447521
- Cited by
- 672
- References
- 19
- Language
- en
- Funders
- Eli Lilly and Company
- Engineering and Physical Sciences Research Council
- EPSRC (EP/N034864/1)
- Alzheimer’s Research UK (ARUK-RF2019A-003)
- Parkinson’s UK
- Wellcome Trust
- Royal Society Sir Henry Dale Fellowship (204624/Z/16/Z)
- King’s College London
- UCL Comprehensive Cancer Imaging Centre
- Regenerative Medicine Platform Safety Hub (MR/K026739/1)
About these checks
Registry, retraction, Cites and statistics results are computed, not judged, with one exception: a printed reference that no index lists is read once by a model before it counts as a citation error. Claims are extracted by a model and kept only when their quote appears verbatim in the text; each cited source is then checked, with a model’s help, for whether it says what the claim relies on. Those verdicts can be wrong — read the claim’s quote and the cited source before relying on one.
Statistics and arithmetic are recomputed, not judged.
Confidence bands are shown only for fields calibrated on our annotated test set. None is calibrated yet, so no band is shown.
What counts as a claim ›How we measure confidence ›How we check this ›
Are you an author, or do you see a problem with this page? Request a review
