

The DOI matches its Crossref record; 7 of the 7 references it cites were found in a registry or an index.
Difference in axon diameter and myelin thickness between excitatory and inhibitory callosally projecting axons in mice
Abstract
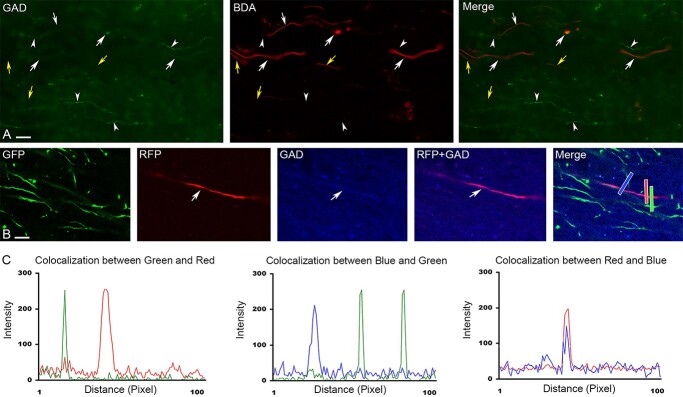
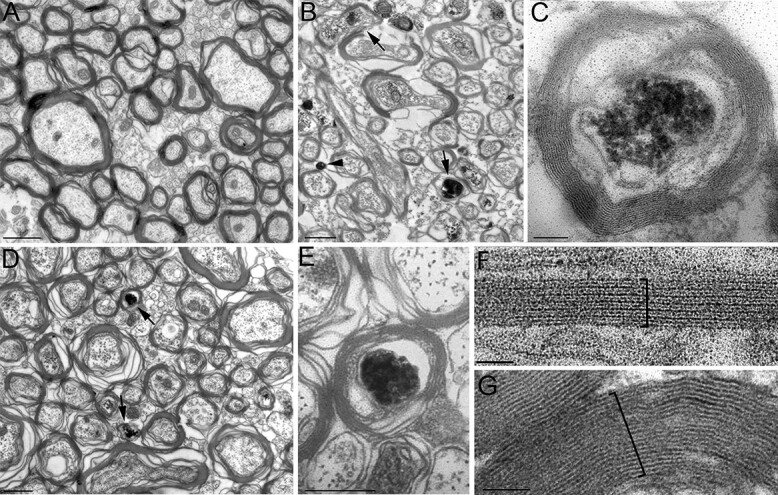
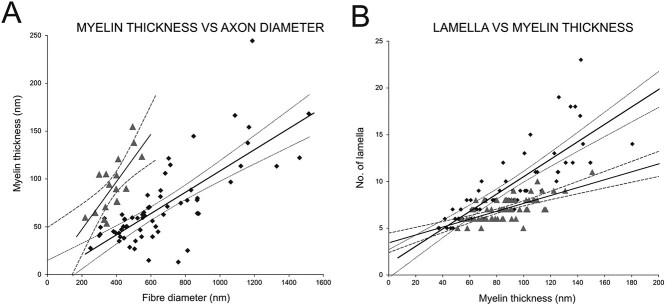
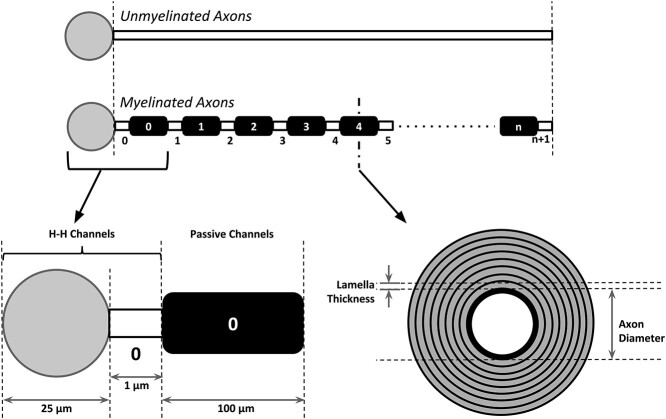
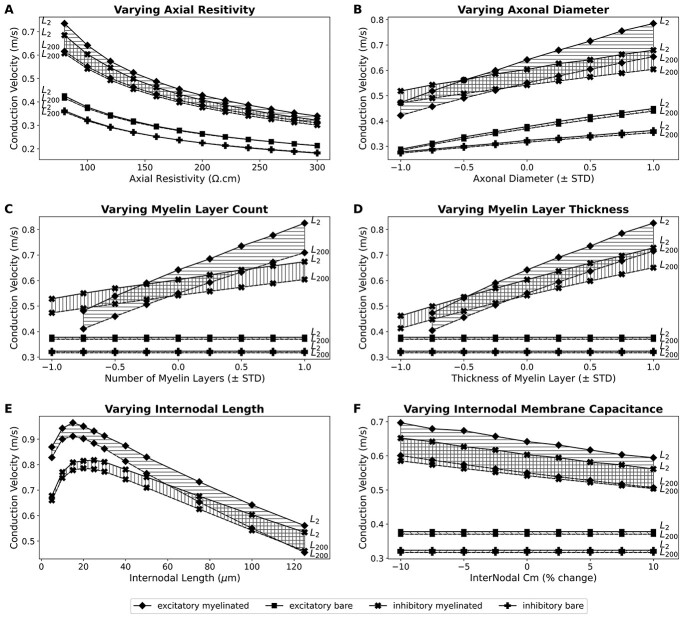
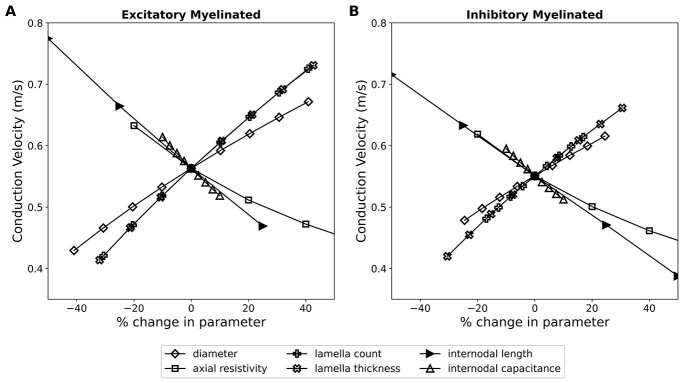
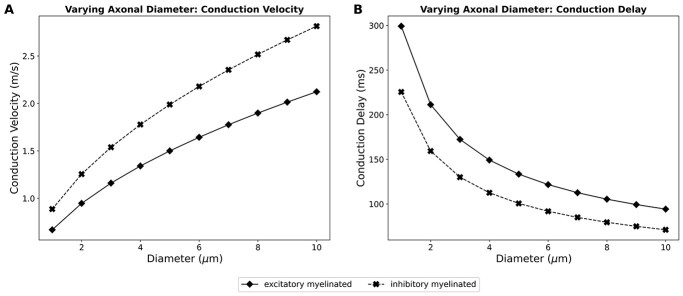
Synchronization of network oscillation in spatially distant cortical areas is essential for normal brain activity. Precision in synchronization between hemispheres depends on the axonal conduction velocity, which is determined by physical parameters of the axons involved, including diameter, and extent of myelination. To compare these parameters in long-projecting excitatory and inhibitory axons in the corpus callosum, we used genetically modified mice and virus tracing to separately label CaMKIIα expressing excitatory and GABAergic inhibitory axons. Using electron microscopy analysis, we revealed that (i) the axon diameters of excitatory fibers (myelinated axons) are significantly larger than those of nonmyelinated excitatory axons; (ii) the diameters of bare axons of excitatory myelinated fibers are significantly larger than those of their inhibitory counterparts; and (iii) myelinated excitatory fibers are significantly larger than myelinated inhibitory fibers. Also, the thickness of myelin ensheathing inhibitory axons is significantly greater than for excitatory axons, with the ultrastructure of the myelin around excitatory and inhibitory fibers also differing. We generated a computational model to investigate the functional consequences of these parameter divergences. Our simulations indicate that impulses through inhibitory and excitatory myelinated fibers reach the target almost simultaneously, whereas action potentials conducted by nonmyelinated axons reach target cells with considerable delay.
Overview
The claims and statistics of this paper haven’t been checked yet.
Run the check — free, no account needed. It reads the open-access text and checks the sources it cites.
Integrity signals
Registry
Cites
Statistics
Figures
Verification
Claims the paper makes
The claims and statistics of this paper haven’t been checked yet.
Run the check — free, no account needed. It reads the open-access text and checks the sources it cites.
Claims other papers make about this one
Each is checked against this paper’s own text: does it say what the citing paper says it does?
The cited source says what the claim attributes to it.
In the citing paper
“different axons exhibit diverse myelination patterns, which are partially reflected by variations in the thickness of myelin sheaths.14,15,16”
From Neurons sequester the cholesterol-inhibiting TFEB in oligodendrocyte cytoplasm to safeguard myelination and neural function (2025) · cites this paper as [14]
Self-check
Percentages, sums and reported differences re-computed from the paper’s own numbers.
The self-check needs the paper’s full text.
Citations
Cites
Neuronal Networks of the Hippocampus
Traub, R. D., & Miles, R. (1991) · doi:10.1017/cbo9780511895401 · Cited by 802
Hippocampal CA1 interneurons: an in vivo intracellular labeling study
Sik, A., Penttonen, M., Ylinen, A., & Buzsaki, G. (1995) · The Journal of Neuroscience · doi:10.1523/jneurosci.15-10-06651.1995 · Cited by 669
Self-citationWAXMAN, S. G., & BENNETT, M. V. L. (1972) · Nature New Biology · doi:10.1038/newbio238217a0 · Cited by 444
Neuronal Diversity in GABAergic Long-Range Projections from the Hippocampus
Jinno, S., Klausberger, T., Marton, L. F., Dalezios, Y., Roberts, J. D. B., Fuentealba, P., Bushong, E. A., Henze, D., Buzsáki, G., & Somogyi, P. (2007) · The Journal of Neuroscience · doi:10.1523/jneurosci.1847-07.2007 · Cited by 369
Liewald, D., Miller, R., Logothetis, N., Wagner, H.-J., & Schüz, A. (2014) · Biological Cybernetics · doi:10.1007/s00422-014-0626-2 · Cited by 322
Alonso, A., & Köhler, C. (1982) · Neuroscience Letters · doi:10.1016/0304-3940(82)90021-0 · Cited by 182 · cited 1×
“Studies have shown that cortical GABAergic cells send long-range projections to subcortical and other cortical areas (Alonso and Kohler 1982; Ribak et al. 1986; Leranth and Frotscher 1987; Gonchar et al. 1995; Fabri and Manzoni 1996; Jinno and Kosaka 2002; Fabri and Manzoni 2004; Tomioka et al. 2005).”
BackgroundMuscarinic control of long-range GABAergic inhibition within the rhinal cortices
Apergis-Schoute, J., Pinto, A., & Paré, D. (2007) · The Journal of Neuroscience · doi:10.1523/jneurosci.0068-07.2007 · Cited by 46
Research works printed but not linked: 83
- Aboitiz, 1992, Fiber composition of the human corpus callosum, Brain Res, 598, 143, 10.1016/0006-8993(92)90178-C · DOI
- Adam, 2009, When one hemisphere takes control: metacontrol in pigeons (Columba livia), PLoS One, 4, e5307, 10.1371/journal.pone.0005307 · DOI
- Arancibia-Carcamo, 2017, Node of Ranvier length as a potential regulator of myelinated axon conduction speed, Elife, 6, e23329, 10.7554/eLife.23329 · DOI
- Barbas, 2005, Parallel organization of contralateral and ipsilateral prefrontal cortical projections in the rhesus monkey, BMC Neurosci, 6, 32, 10.1186/1471-2202-6-32 · DOI
- Basu, 2008, Novel strategy to selectively label excitatory and inhibitory neurons in the cerebral cortex of mice, J Neurosci Methods, 170, 10.1016/j.jneumeth.2008.01.016 · DOI
- Bloom, 2005, The role of the corpus callosum in interhemispheric transfer of information: excitation or inhibition?, Neuropsychol Rev, 15, 59, 10.1007/s11065-005-6252-y · DOI
- Brill, 1977, Conduction velocity and spike configuration in myelinated fibres: computed dependence on internode distance, J Neurol Neurosurg Psychiatry, 40, 769, 10.1136/jnnp.40.8.769 · DOI
- Buzsaki, 1984, Feed-forward inhibition in the hippocampal formation, Prog Neurobiol, 22, 131, 10.1016/0301-0082(84)90023-6 · DOI · Paper page
- Chong, 2012, Neurite outgrowth inhibitor Nogo-A establishes spatial segregation and extent of oligodendrocyte myelination, Proc Natl Acad Sci, 109, 1299, 10.1073/pnas.1113540109 · DOI · Paper page
- Clarke, 1994, Anatomical-behavioral relationships: corpus callosum morphometry and hemispheric specialization, Behav Brain Res, 64, 185, 10.1016/0166-4328(94)90131-7 · DOI
- Conti, 1994, The neurotransmitters and postsynaptic actions of callosally projecting neurons, Behav Brain Res, 64, 37, 10.1016/0166-4328(94)90117-1 · DOI
- Fabri, 1996, Glutamate decarboxylase immunoreactivity in corticocortical projecting neurons of rat somatic sensory cortex, Neuroscience, 72, 435, 10.1016/0306-4522(95)00568-4 · DOI
- Fabri, 2004, Glutamic acid decarboxylase immunoreactivity in callosal projecting neurons of cat and rat somatic sensory areas, Neuroscience, 123, 557, 10.1016/j.neuroscience.2003.09.011 · DOI
- Fame, 2017, Subtype-specific genes that characterize subpopulations of callosal projection neurons in mouse identify molecularly homologous populations in macaque cortex, Cereb Cortex, 27, 1817, 10.1093/cercor/bhw023 · DOI
- Fazan, 2005, Relation between myelin area and axon diameter in the aortic depressor nerve of spontaneously hypertensive rats, J Neurosci Methods, 148, 130, 10.1016/j.jneumeth.2005.04.007 · DOI
- Franson, 1975, Postnatal growth of nerve fibres in the pyramidal tract of the rabbit, Neurobiology, 5, 8
- Gazzaniga, 2000, Cerebral specialization and interhemispheric communication: does the corpus callosum enable the human condition?, Brain, 123, 1293, 10.1093/brain/123.7.1293 · DOI · Paper page
- Goldman, 1968, Computation of impulse conduction in myelinated fibers; theoretical basis of the velocity-diameter relation, Biophys J, 8, 596, 10.1016/S0006-3495(68)86510-5 · DOI
- Gonchar, 1995, GABA-immunopositive neurons in rat neocortex with contralateral projections to S-I, Brain Res, 697, 27, 10.1016/0006-8993(95)00746-D · DOI
- Gravel, 1990, Maturation of the corpus callosum of the rat: I. Influence of thyroid hormones on the topography of callosal projections, J Comp Neurol, 291, 128, 10.1002/cne.902910109 · DOI
- Gravel, 1990, Maturation of the corpus callosum of the rat: II. Influence of thyroid hormones on the number and maturation of axons, J Comp Neurol, 291, 147, 10.1002/cne.902910110 · DOI
- Häberling, 2011, Callosal tracts and patterns of hemispheric dominance: a combined fMRI and DTI study, NeuroImage, 54, 779, 10.1016/j.neuroimage.2010.09.072 · DOI
- Hildebrand, 1971, Ultrastructural and light-microscopic studies of the nodal region in large myelinated fibres of the adult feline spinal cord white matter, Acta Physiol Scand, 82, 43, 10.1111/j.1365-201X.1971.tb10978.x · DOI
- Hildebrand, 1984, Postnatal differentiation of rat optic nerve fibers: electron microscopic observations on the development of nodes of Ranvier and axoglial relations, J Comp Neurol, 224, 25, 10.1002/cne.902240103 · DOI
- Innocenti, 1995, Cellular aspects of callosal connections and their development, Neuropsychologia, 33, 961, 10.1016/0028-3932(95)00033-Y · DOI
- Jeeves, 1986, Two hemispheres, one brain: functions of the corpus callosum, 403
- Jinno, 2002, Immunocytochemical characterization of hippocamposeptal projecting GABAergic nonprincipal neurons in the mouse brain: a retrograde labeling study, Brain Res, 945, 219, 10.1016/S0006-8993(02)02804-4 · DOI · Paper page
- Juraska, 1988, Sex and environmental influences on the size and ultrastructure of the rat corpus callosum, Brain Res, 450, 1, 10.1016/0006-8993(88)91538-7 · DOI · Paper page
- Karolis, 2019, The architecture of functional lateralisation and its relationship to callosal connectivity in the human brain, Nat Commun, 10, 1, 10.1038/s41467-019-09344-1 · DOI
- Kawaguchi, 1992, Receptor subtypes involved in callosally-induced postsynaptic potentials in rat frontal agranular cortex in vitro, Exp Brain Res, 88, 33, 10.1007/BF02259126 · DOI
- Kim, 1997, Sex differences in the development of axon number in the splenium of the rat corpus callosum from postnatal day 15 through 60, Dev Brain Res, 102, 77, 10.1016/S0165-3806(97)00080-1 · DOI
- Kim, 1996, A re-examination of sex differences in axon density and number in the splenium of the rat corpus callosum, Brain Res, 740, 47, 10.1016/S0006-8993(96)00637-3 · DOI
- Kimura, 1997, GABAergic transcallosal neurons in developing rat neocortex, Eur J Neurosci, 9, 1137, 10.1111/j.1460-9568.1997.tb01467.x · DOI
- Knaap, 2011, How does the corpus callosum mediate interhemispheric transfer?, Rev Behav Brain Res, 223, 211, 10.1016/j.bbr.2011.04.018 · DOI
- Kocsis, 1983, Long-term regenerated nerve fibres retain sensitivity to potassium channel blocking agents, Nature, 304, 640, 10.1038/304640a0 · DOI
- Kursula, 2001, The small myelin-associated glycoprotein binds to tubulin and microtubules, Brain Res Mol Brain Res, 87, 22, 10.1016/S0169-328X(00)00270-9 · DOI
- LaMantia, 1990, Cytological and quantitative characteristics of four cerebral commissures in the rhesus monkey, J Comp Neurol, 291, 520, 10.1002/cne.902910404 · DOI
- LaMantia, 1990, Axon overproduction and elimination in the corpus callosum of the developing rhesus monkey, J Neurosci, 10, 2156, 10.1523/JNEUROSCI.10-07-02156.1990 · DOI
- Leranth, 1987, Cholinergic innervation of hippocampal GAD- and somatostatin-immunoreactive commissural neurons, J Comp Neurol, 261, 33, 10.1002/cne.902610104 · DOI
- Marques, 2018, Transcriptional convergence of oligodendrocyte lineage progenitors during development, Dev Cell, 46, 504, 10.1016/j.devcel.2018.07.005 · DOI · Paper page
- Matthews, 1971, A quantitative study of morphological changes accompanying the initiation and progress of myelin production in the dorsal funiculus of the rat spinal cord, J Comp Neurol, 142, 1, 10.1002/cne.901420102 · DOI
- Micheva, 2016, A large fraction of neocortical myelin ensheathes axons of local inhibitory neurons, Elife, 5, 10.7554/eLife.15784 · DOI
- Miles, 1996, Differences between somatic and dendritic inhibition in the hippocampus, Neuron, 16, 815, 10.1016/S0896-6273(00)80101-4 · DOI · Paper page
- Moore, 1978, Simulations of conduction in uniform myelinated fibers. Relative sensitivity to changes in nodal and internodal parameters, Biophys J, 21, 147, 10.1016/S0006-3495(78)85515-5 · DOI
- Murtie, 2007, Morphometric analysis of oligodendrocytes in the adult mouse frontal cortex, J Neurosci Res, 85, 2080, 10.1002/jnr.21339 · DOI · Paper page
- Naito, 1971, Diameters of callosal fibers interconnecting cat sensorimotor cortex, Brain Res, 27, 369, 10.1016/0006-8993(71)90263-0 · DOI
- Noggle, 2011, Hemispheres of the brain, lateralization of, Encycl Child Behav Dev, 740, 10.1007/978-0-387-79061-9_1346 · DOI
- Nowicka, 2011, Transcallosal transfer of information and functional asymmetry of the human brain, Laterality, 16, 35, 10.1080/13576500903154231 · DOI
- Olivares, 2001, Species differences and similarities in the fine structure of the mammalian corpus callosum, Brain Behav Evol, 57, 98, 10.1159/000047229 · DOI
- Perge, 2012, Why do axons differ in caliber?, J Neurosci, 32, 626, 10.1523/JNEUROSCI.4254-11.2012 · DOI
- Peters, 1990, Transcallosal non-pyramidal cell projections from visual cortex in the cat, J Comp Neurol, 302, 124, 10.1002/cne.903020110 · DOI
- Phillips, 2015, The corpus callosum in primates: processing speed of axons and the evolution of hemispheric asymmetry, Proc R Soc B Biol Sci, 282, 20151535, 10.1098/rspb.2015.1535 · DOI
- Pyapali, 1998, Dendritic properties of hippocampal CA1 pyramidal neurons in the rat: intracellular staining in vivo and in vitro, J Comp Neurol, 391, 335, 10.1002/(SICI)1096-9861(19980216)391:3<335::AID-CNE4>3.0.CO;2-2 · DOI
- Remahl, 1982, Changing relation between onset of myelination and axon diameter range in developing feline white matter, J Neurol Sci, 54, 33, 10.1016/0022-510X(82)90216-7 · DOI
- Ribak, 1986, A GABAergic inhibitory component within the hippocampal commissural pathway, J Neurosci, 6, 3492, 10.1523/JNEUROSCI.06-12-03492.1986 · DOI
- Ringo, 1994, Time is of the essence: a conjecture that hemispheric specialization arises from interhemispheric conduction delay, Cereb Cortex, 4, 331, 10.1093/cercor/4.4.331 · DOI
- Rio-Hortega, 1928, Tercera aportacion al conocimiento morfologico e interpretacion funcional de la oligodendroglia
- Ritchie, 1982, On the relation between fibre diameter and conduction velocity in myelinated nerve fibres, Proc R Soc Lond B Biol Sci, 217, 29, 10.1098/rspb.1982.0092 · DOI
- Rushton, 1951, A theory of the effects of fibre size in medullated nerve, J Physiol, 115, 101, 10.1113/jphysiol.1951.sp004655 · DOI
- Sanders, 1946, Conduction velocity and myelin thickness in regenerating nerve fibres, J Physiol, 105, 152, 10.1113/jphysiol.1946.sp004160 · DOI
- Schüz, 1996, Basic connectivity of the cerebral cortex and some considerations on the corpus callosum, Neurosci Biobehav Rev, 20, 567, 10.1016/0149-7634(95)00069-0 · DOI
- Sik, 1994, Inhibitory CA1-CA3-hilar region feedback in the hippocampus, Science, 265, 1722, 10.1126/science.8085161 · DOI
- Soloway, 2002, Dendritic morphology of callosal and ipsilateral projection neurons in monkey prefrontal cortex, Neuroscience, 109, 461, 10.1016/S0306-4522(01)00507-3 · DOI
- Somogyi, 1998, Salient features of synaptic organisation in the cerebral cortex, Brain Res Brain Res Rev, 26, 113, 10.1016/S0165-0173(97)00061-1 · DOI
- Sperry, 1986, Two hemispheres, one brain: functions of the corpus callosum, 3
- Stedehouder, 2017, Myelination of parvalbumin interneurons: a parsimonious locus of pathophysiological convergence in schizophrenia, Mol Psychiatry, 22, 4, 10.1038/mp.2016.147 · DOI
- Sturrock, 1980, Myelination of the mouse corpus callosum, Neuropathol Appl Neurobiol, 6, 415, 10.1111/j.1365-2990.1980.tb00219.x · DOI
- Sunderland, 1958, Axon-myelin relationships in peripheral nerve fibres, Acta Anat (Basel), 33, 1, 10.1159/000141338 · DOI
- Swadlow, 1974, Properties of antidromically activated callosal neurons and neurons responsive to callosal input in rabbit binocular cortex, Exp Neurol, 43, 424, 10.1016/0014-4886(74)90182-4 · DOI
- Swadlow, 1980, Small-diameter nonmyelinated axons in the primate corpus callosum, Arch Neurol, 37, 114, 10.1001/archneur.1980.00500510072016 · DOI
- Tomassy, 2014, Distinct profiles of myelin distribution along single axons of pyramidal neurons in the neocortex, Science, 344, 319, 10.1126/science.1249766 · DOI · Paper page
- Tomioka, 2005, Demonstration of long-range GABAergic connections distributed throughout the mouse neocortex, Eur J Neurosci, 21, 1587, 10.1111/j.1460-9568.2005.03989.x · DOI
- Trapp, 1989, The myelin-associated glycoprotein is enriched in multivesicular bodies and periaxonal membranes of actively myelinating oligodendrocytes, J Cell Biol, 109, 2417, 10.1083/jcb.109.5.2417 · DOI
- Trevarthen, 1990, Handbook of neuropsychology, 49
- Tsien, 1996, Subregion- and cell type-restricted gene knockout in mouse brain, Cell, 87, 1317, 10.1016/S0092-8674(00)81826-7 · DOI · Paper page
- Ursino, 2010, The generation of rhythms within a cortical region: analysis of a neural mass model, NeuroImage, 52, 1080, 10.1016/j.neuroimage.2009.12.084 · DOI
- Vinet, 2010, Subclasses of oligodendrocytes populate the mouse hippocampus, Eur J Neurosci, 31, 425, 10.1111/j.1460-9568.2010.07082.x · DOI
- Voigt, 1988, Morphological and immunocytochemical observations on the visual callosal projections in the cat, J Comp Neurol, 272, 450, 10.1002/cne.902720312 · DOI
- Wang, 2008, Functional trade-offs in white matter axonal scaling, J Neurosci, 28, 4047, 10.1523/JNEUROSCI.5559-05.2008 · DOI
- Waxman, 1976, Ultrastructure of visual callosal axons in the rabbit, Exp Neurol, 53, 115, 10.1016/0014-4886(76)90287-9 · DOI
- Welcome, 2008, How dynamic is interhemispheric interaction? Effects of task switching on the across-hemisphere advantage, Brain Cogn, 67, 69, 10.1016/j.bandc.2007.11.005 · DOI
- Yang, 2022, Callosal fiber length scales with brain size according to functional lateralization, evolution, and development, J Neurosci, 42, 3599, 10.1523/JNEUROSCI.1510-21.2022 · DOI
- Zonouzi, 2019, Individual oligodendrocytes show bias for inhibitory axons in the neocortex, Cell Rep, 27, 2799, 10.1016/j.celrep.2019.05.018 · DOI
Cited by
Sorted by citations
Zhang, Y., Cheng, Z., Huang, S., Sharma, T., Barbosa, D., Yu, G., & Sun, L. O. (2025) · Cell Reports · doi:10.1016/j.celrep.2025.116252 · Cited by 4
Metadata
- Authors
- Basu, K., Appukuttan, S., Manchanda, R., & Sik, A.
- Affiliations
- Facility for Electron Microscopy Research, McGill University , Montreal, QC H3A 0C72 , Canada
- Biomedical Engineering Group, Department of Biosciences & Bioengineering IIT Bombay , Powai, Mumbay, 4000764 , India
- College of Medical and Dental Sciences, University of Birmingham, Vincent Drive , Birmingham B15 2TT , United Kingdom
- ORCID
- Sik, Attila
- Venue
- Cerebral Cortex
- Publisher
- Oxford University Press (OUP)
- Published
- 2022-10-07
- Volume
- 33
- Issue
- 7
- Pages
- 4101-4115
- ISSN
- 1047-3211
- 1460-2199
- PMC
- PMC10068302
- Cited by
- 29
- References
- 7
- Language
- en
- Funders
- Canadian Institutes of Health Research (MOP-81105)
- Medical Research Council (G1001235)
- European Union’s Horizon 2020 OPEN FET RIA (712821)
About these checks
Registry, retraction, Cites and statistics results are computed, not judged, with one exception: a printed reference that no index lists is read once by a model before it counts as a citation error. Claims are extracted by a model and kept only when their quote appears verbatim in the text; each cited source is then checked, with a model’s help, for whether it says what the claim relies on. Those verdicts can be wrong — read the claim’s quote and the cited source before relying on one.
Statistics and arithmetic are recomputed, not judged.
Confidence bands are shown only for fields calibrated on our annotated test set. None is calibrated yet, so no band is shown.
What counts as a claim ›How we measure confidence ›How we check this ›
Are you an author, or do you see a problem with this page? Request a review
How to cite
Cite CoChat for the checks on this page, and the paper for its own findings.
- This page
- CoChat. (2026). Citation check: Difference in axon diameter and myelin thickness between excitatory and inhibitory callosally projecting axons in mice. https://app.cochat.ai/papers/10.1093/cercor/bhac329
- The paper
- Basu, K., Appukuttan, S., Manchanda, R., & Sik, A. (2023). Difference in axon diameter and myelin thickness between excitatory and inhibitory callosally projecting axons in mice. Cerebral Cortex. https://doi.org/10.1093/cercor/bhac329
