

The DOI matches its Crossref record; 23 of the 23 references it cites were found in a registry or an index.
A curated database reveals trends in single-cell transcriptomics
Open accessPublished version of a preprint
Abstract
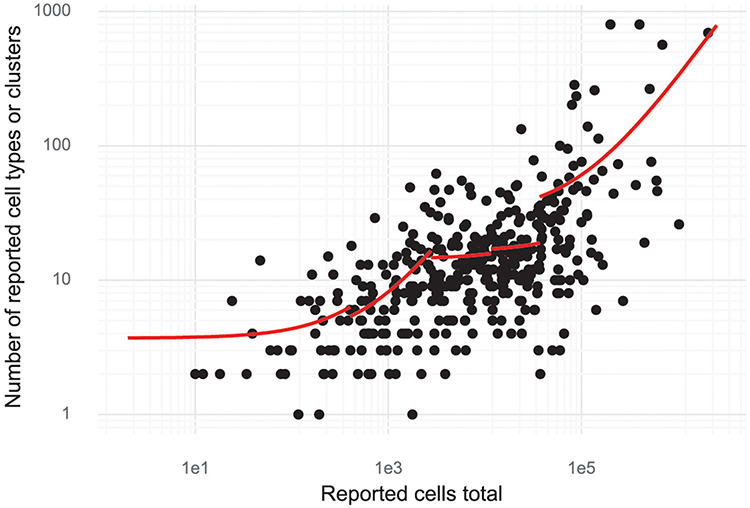
The more than 1000 single-cell transcriptomics studies that have been published to date constitute a valuable and vast resource for biological discovery. While various ‘atlas’ projects have collated some of the associated datasets, most questions related to specific tissue types, species or other attributes of studies require identifying papers through manual and challenging literature search. To facilitate discovery with published single-cell transcriptomics data, we have assembled a near exhaustive, manually curated database of single-cell transcriptomics studies with key information: descriptions of the type of data and technologies used, along with descriptors of the biological systems studied. Additionally, the database contains summarized information about analysis in the papers, allowing for analysis of trends in the field. As an example, we show that the number of cell types identified in scRNA-seq studies is proportional to the number of cells analysed. Database URL: www.nxn.se/single-cell-studies/gui
Overview
The claims and statistics of this paper haven’t been checked yet.
Free: it reads the open-access text and checks the first 5 claims that cite a source we can check. Create a free account to check every claim.
Integrity signals
Registry
Cites
Statistics
Figures
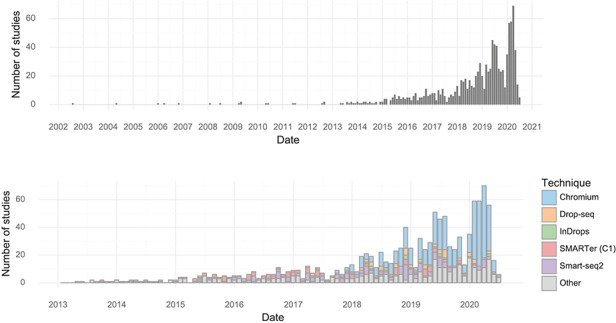
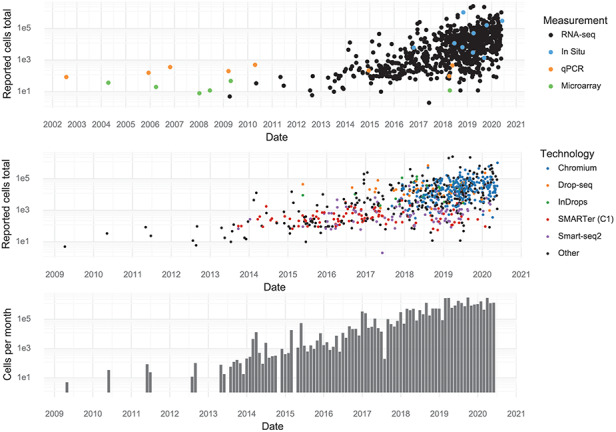
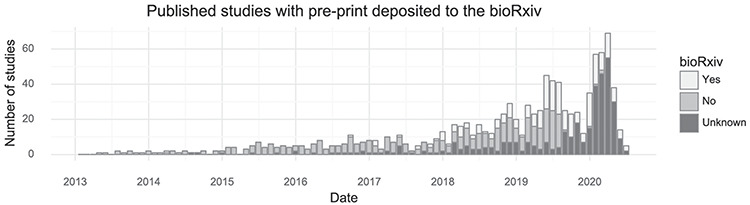
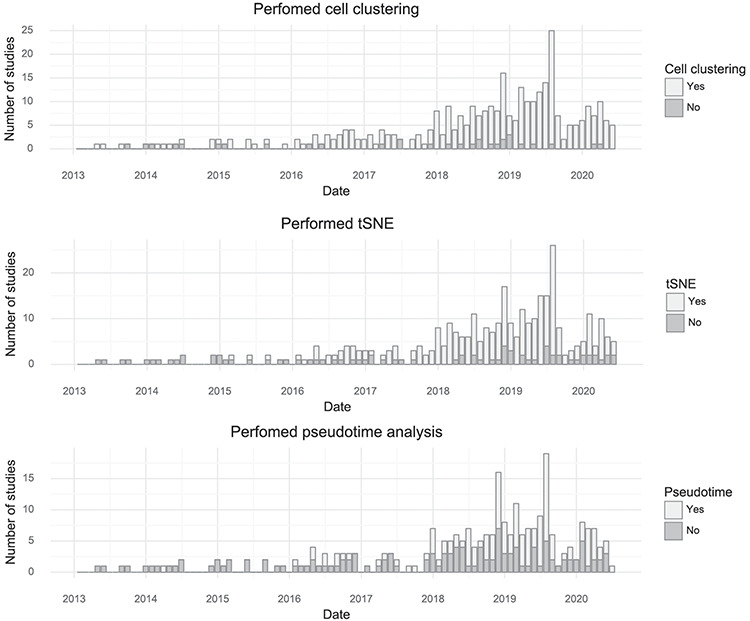
Verification
Claims the paper makes
The claims and statistics of this paper haven’t been checked yet.
Free: it reads the open-access text and checks the first 5 claims that cite a source we can check. Create a free account to check every claim.
Claims other papers make about this one
Each is checked against this paper’s own text: does it say what the citing paper says it does?
The source backs part of the claim, not all of it — or backs it for a different population, condition or comparison.
In the citing paper
“Existing collections of datasets are primarily a means for filtering and do not supply a unified format for perturbations33-35.”
From scPerturb: harmonized single-cell perturbation data (2024) · cites this paper as [34]
Experimental — accuracy not yet measuredThe check wasn’t confident either way, so it gives no verdict — never disputed.
In the citing paper
“Increasing sequencing depth increases the UMI counts measured even for low-expression genes, reducing the uncertainty associated with zero counts34,47.”
From scPerturb: harmonized single-cell perturbation data (2024) · cites this paper as [34]
Experimental — accuracy not yet measuredThe check wasn’t confident either way, so it gives no verdict — never disputed.
In the citing paper
“The average sequencing depth, that is, the mean number of reads per cell, in each study affects the number of low-expression genes observed.”
From scPerturb: harmonized single-cell perturbation data (2024) · cites this paper as [34]
Experimental — accuracy not yet measured
Self-check
Percentages, sums and reported differences re-computed from the paper’s own numbers.
The self-check needs the paper’s full text.
Citations
Cites
(2008) · Journal of Machine Learning Research · Cited by 33,051
Comprehensive Integration of Single-Cell Data
Stuart, T., Butler, A., Hoffman, P., Hafemeister, C., Papalexi, E., Mauck, W. M., Hao, Y., Stoeckius, M., Smibert, P., & Satija, R. (2019) · Cell · doi:10.1016/j.cell.2019.05.031 · Cited by 15,453
UMAP: Uniform Manifold Approximation and Projection
McInnes, L., Healy, J., Saul, N., & Großberger, L. (2018) · Journal of Open Source Software · doi:10.21105/joss.00861 · Cited by 9,826
Trapnell, C., Cacchiarelli, D., Grimsby, J., Pokharel, P., Li, S., Morse, M., Lennon, N. J., Livak, K. J., Mikkelsen, T. S., & Rinn, J. L. (2014) · Nature Biotechnology · doi:10.1038/nbt.2859 · Cited by 7,314 · cited 1×
“(17) (124 citations out of 1036, Table 2b).”
Highly parallel genome-wide expression profiling of individual cells using nanoliter droplets.
Macosko, E. Z., Basu, A., Satija, R., Nemesh, J., Shekhar, K., Goldman, M., Tirosh, I., Bialas, A. R., Kamitaki, N., Martersteck, E. M., et al. (2015) · Cell · doi:10.1016/j.cell.2015.05.002 · Cited by 7,110
UMAP: Uniform Manifold Approximation and Projection for Dimension Reduction
McInnes, L., Healy, J., & Melville, J. (2018) · arXiv · doi:10.48550/arxiv.1802.03426 · Cited by 7,101
La Manno, G., Soldatov, R., Zeisel, A., Braun, E., Hochgerner, H., Petukhov, V., Lidschreiber, K., Kastriti, M. E., Lönnerberg, P., Furlan, A., et al. (2018) · Nature · doi:10.1038/s41586-018-0414-6 · Cited by 4,118
Regev, A., Teichmann, S. A., Lander, E. S., Amit, I., Benoist, C., Birney, E., Bodenmiller, B., Campbell, P., Carninci, P., Clatworthy, M., et al. (2017) · eLife · doi:10.7554/elife.27041 · Cited by 2,232
Three-dimensional intact-tissue sequencing of single-cell transcriptional states
Wang, X., Allen, W. E., Wright, M. A., Sylwestrak, E. L., Samusik, N., Vesuna, S., Evans, K., Liu, C., Ramakrishnan, C., Liu, J., et al. (2018) · Science · doi:10.1126/science.aat5691 · Cited by 1,620
PanglaoDB: a web server for exploration of mouse and human single-cell RNA sequencing data
Franzén, O., Gan, L.-M., & Björkegren, J. L. M. (2019) · Database · doi:10.1093/database/baz046 · Cited by 1,551
Cited by
Dictionary learning for integrative, multimodal and scalable single-cell analysis
Hao, Y., Stuart, T., Kowalski, M. H., Choudhary, S., Hoffman, P., Hartman, A., Srivastava, A., Molla, G., Madad, S., Fernandez-Granda, C., et al. (2024) · Nature Biotechnology · doi:10.1038/s41587-023-01767-y · Cited by 5,631
Transfer learning enables predictions in network biology
Theodoris, C. V., Xiao, L., Chopra, A., Chaffin, M. D., Al Sayed, Z. R., Hill, M. C., Mantineo, H., Brydon, E. M., Zeng, Z., Liu, X. S., et al. (2023) · Nature · doi:10.1038/s41586-023-06139-9 · Cited by 1,193
Cross-tissue immune cell analysis reveals tissue-specific features in humans
Domínguez Conde, C., Xu, C., Jarvis, L. B., Rainbow, D. B., Wells, S. B., Gomes, T., Howlett, S. K., Suchanek, O., Polanski, K., King, H. W., et al. (2022) · Science · doi:10.1126/science.abl5197 · Cited by 1,159
Confronting false discoveries in single-cell differential expression
Squair, J. W., Gautier, M., Kathe, C., Anderson, M. A., James, N. D., Hutson, T. H., Hudelle, R., Qaiser, T., Matson, K. J. E., Barraud, Q., et al. (2021) · doi:10.1101/2021.03.12.435024 · Cited by 1,086
A Python library for probabilistic analysis of single-cell omics data
Gayoso, A., Lopez, R., Xing, G., Boyeau, P., Valiollah Pour Amiri, V., Hong, J., Wu, K., Jayasuriya, M., Mehlman, E., Langevin, M., et al. (2022) · Nature Biotechnology · doi:10.1038/s41587-021-01206-w · Cited by 789
Self-citation
Metadata
- Authors
- Svensson, V., da Veiga Beltrame, E., & Pachter, L.
- Affiliations
- California Institute of Technology (US)
- Division of Biology and Biological Engineering, California Institute of Technology, 1200 E California Blvd, Pasadena, CA, 91125, USA
- Corresponding author
- Svensson, Valentine
- Venue
- Database
- Publisher
- Oxford University Press (OUP)
- Published
- 2020
- Volume
- 2020
- ISSN
- 1758-0463 (ISSN-L)
- PMC
- PMC7698659
- OpenAlex
- W3109243443
- Cited by
- 223
- References
- 23
- Citations by year
- 2026: 20 · 2025: 33 · 2024: 42 · 2023: 38 · 2022: 37 · 2021: 39 · 2020: 13
- FWCI
- 10.25
- Type
- journal article
- Language
- en
- Open access
- gold
- doi.org
- Locations
- Database (publishedVersion, cc-by)
- bioRxiv (Cold Spring Harbor Laboratory) (acceptedVersion, public-domain)
- PubMed Central (publishedVersion, cc-by)
- PubMed (publishedVersion)
- CaltechAUTHORS (California Institute of Technology) (submittedVersion, cc-by)
- Funders
- A COMPREHENSIVE WHOLE-BRAIN ATLAS OF CELL TYPES IN THE MOUSE (NIH U19MH114830)
- Topics
- Life Sciences › Biochemistry, Genetics and Molecular Biology › Molecular Biology › Single-cell and spatial transcriptomics
- Life Sciences › Biochemistry, Genetics and Molecular Biology › Molecular Biology › Genomics and Phylogenetic Studies
- Life Sciences › Biochemistry, Genetics and Molecular Biology › Molecular Biology › Bioinformatics and Genomic Networks
- Keywords
- single-cell transcriptomics, single-cell RNA sequencing, curated database, cell type annotation, cell number, research trends, biological systems
- MeSH terms
- Databases, Factual, Transcriptome
About these checks
Registry, retraction, Cites and statistics results are computed, not judged, with one exception: a printed reference that no index lists is read once by a model before it counts as a citation error. Claims are extracted by a model and kept only when their quote appears verbatim in the text; each cited source is then checked, with a model’s help, for whether it says what the claim relies on. Those verdicts can be wrong — read the claim’s quote and the cited source before relying on one.
Statistics and arithmetic are recomputed, not judged.
Confidence bands are shown only for fields calibrated on our annotated test set. None is calibrated yet, so no band is shown.
What counts as a claim ›How we measure confidence ›How we check this ›
Are you an author, or do you see a problem with this page? Request a review
How to cite
Cite CoChat for the checks on this page, and the paper for its own findings.
- This page
- CoChat. (2026). Citation check: A curated database reveals trends in single-cell transcriptomics. https://app.cochat.ai/papers/10.1093/database/baaa073
- The paper
- Svensson, V., da Veiga Beltrame, E., & Pachter, L. (2020). A curated database reveals trends in single-cell transcriptomics. Database. https://doi.org/10.1093/database/baaa073
Data sources
Bibliographic data: Semantic Scholar, OpenAlex, Crossref.
Contains information from the Semantic Scholar Academic Graph Datasets, made available under the ODC Attribution License (ODC-BY 1.0).
Semantic Scholar’s data is described in: Kinney, R., et al. (2023). The Semantic Scholar Open Data Platform. arXiv:2301.10140.
