

The DOI matches its Crossref record; 47 of the 48 references it cites were found in a registry or an index.
Mortality reduction with physical activity in patients with and without cardiovascular disease
Open accessAbstract
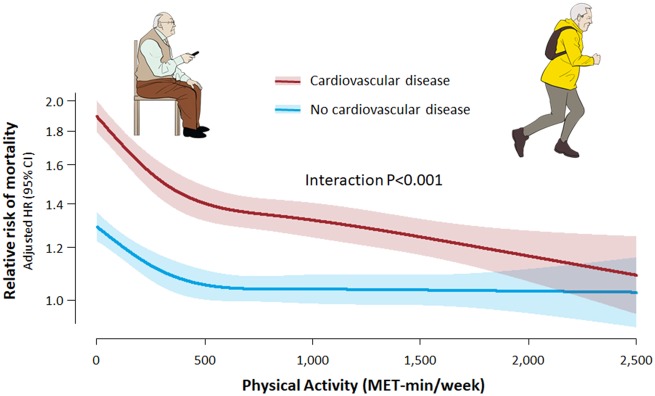
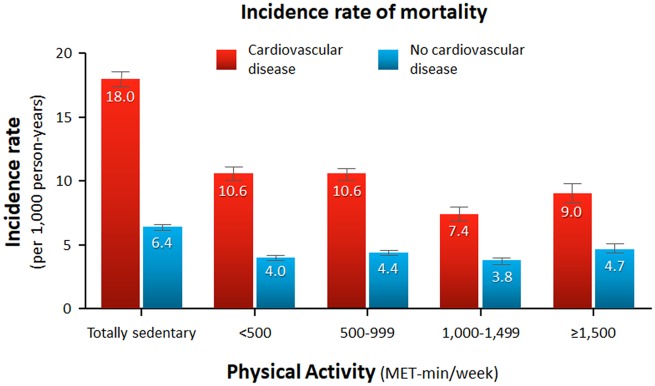
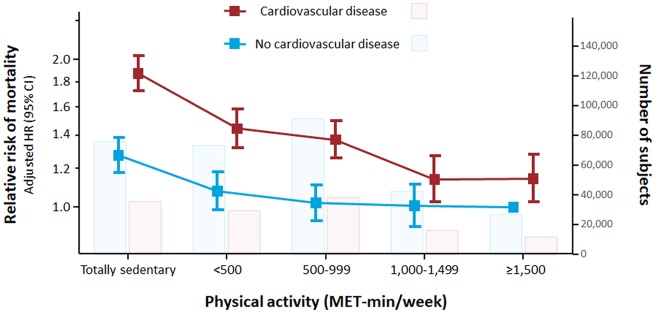
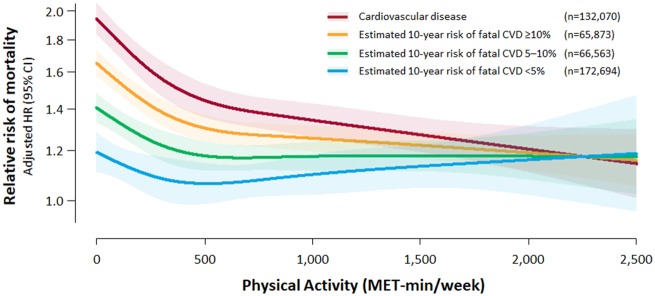
AIMS: Physical activity has been shown to reduce mortality in a dose-response fashion. Current guidelines recommend 500-1000 metabolic equivalent task (MET)-min per week of regular physical activity. This study aimed to compare the impact of leisure-time physical activity on mortality in primary versus secondary cardiovascular prevention. METHODS AND RESULTS: This study included a total of 131 558 and 310 240 subjects with and without cardiovascular disease (CVD), respectively, from a population-based cohort. Leisure-time physical activity was measured by self-report questionnaires. The study subjects were followed-up for a median of 5.9 years, and the main study outcome was all-cause mortality. There was an inverse relationship between the physical activity level and the mortality risk in both groups. The benefit in the secondary prevention group was shown to be greater than that in the primary prevention group: every 500 MET-min/week increase in physical activity resulted in a 14% and 7% risk reduction in mortality in the secondary and primary prevention groups, respectively (interaction P < 0.001). In addition, while individuals without CVD benefited the most between 1 and 500 MET-min/week of physical activity, the benefit in those with CVD continued above 500 - 1000 MET-min/week. The adjusted mortality risk of individuals with CVD who performed a high level of physical activity (≥1000 MET-min/week) was shown to be comparable to or lower than that of their counterparts without CVD. CONCLUSION: Individuals with CVD may benefit from physical activity to a greater extent than do healthy subjects without CVD.
Overview
The claims and statistics of this paper haven’t been checked yet.
Run the check — free, no account needed. It reads the open-access text and checks the sources it cites.
Integrity signals
Registry
Cites
Statistics
Figures
Verification
Claims the paper makes
The claims and statistics of this paper haven’t been checked yet.
Run the check — free, no account needed. It reads the open-access text and checks the sources it cites.
Claims other papers make about this one
Each is checked against this paper’s own text: does it say what the citing paper says it does?
The cited source says what the claim attributes to it.
In the citing paper
“these observations were consistent irrespective of the specific type of CVD.”
From Exercise benefits in cardiovascular diseases: From mechanisms to clinical implementation (2023) · cites this paper as [49]
Self-check
Percentages, sums and reported differences re-computed from the paper’s own numbers.
The self-check needs the paper’s full text.
Citations
Cites
The Physical Activity Guidelines for Americans
Piercy, K. L., Troiano, R. P., Ballard, R. M., Carlson, S. A., Fulton, J. E., Galuska, D. A., George, S. M., & Olson, R. D. (2018) · JAMA · doi:10.1001/jama.2018.14854 · Cited by 9,755 · cited 1×
“Unfortunately, studies have shown that less than half of adults achieve this level of physical activity, while one-third do no physical activity at all.(7,8) The existing evidence on the dose-response relationship is mostly based on healthy people.”
BackgroundIbanez, B., James, S., Agewall, S., Antunes, M. J., Bucciarelli-Ducci, C., Bueno, H., Caforio, A. L. P., Crea, F., Goudevenos, J. A., Halvorsen, S., et al. (2018) · European Heart Journal · doi:10.1093/eurheartj/ehx393 · Cited by 9,728
European Guidelines on cardiovascular disease prevention in clinical practice (version 2012)
Authors/Task Force Members:, Perk, J., De Backer, G., Gohlke, H., Graham, I., Reiner, Ž., Verschuren, M., Albus, C., Benlian, P., Boysen, G., et al. (2012) · European Heart Journal · doi:10.1093/eurheartj/ehs092 · Cited by 8,490
Roffi, M., Patrono, C., Collet, J.-P., Mueller, C., Valgimigli, M., Andreotti, F., Bax, J. J., Borger, M. A., Brotons, C., Chew, D. P., et al. (2016) · European Heart Journal · doi:10.1093/eurheartj/ehv320 · Cited by 8,261
Lee, I.-M., Shiroma, E. J., Lobelo, F., Puska, P., Blair, S. N., & Katzmarzyk, P. T. (2012) · The Lancet · doi:10.1016/s0140-6736(12)61031-9 · Cited by 8,215
Heart Disease and Stroke Statistics—2012 Update: A Report From the American Heart Association
Writing Group Members, Roger, V. L., Go, A. S., Lloyd-Jones, D. M., Benjamin, E. J., Berry, J. D., Borden, W. B., Bravata, D. M., Dai, S., Ford, E. S., et al. (2012) · Circulation · doi:10.1161/cir.0b013e31823ac046 · Cited by 7,333
2016 European Guidelines on cardiovascular disease prevention in clinical practice
Piepoli, M. F., Hoes, A. W., Agewall, S., Albus, C., Brotons, C., Catapano, A. L., Cooney, M.-T., Corrà, U., Cosyns, B., Deaton, C., et al. (2016) · European Heart Journal · doi:10.1093/eurheartj/ehw106 · Cited by 6,457
Heart Disease and Stroke Statistics—2010 Update: A Report From the American Heart Association
WRITING GROUP MEMBERS, Lloyd-Jones, D., Adams, R. J., Brown, T. M., Carnethon, M., Dai, S., De Simone, G., Ferguson, T. B., Ford, E., Furie, K., et al. (2010) · Circulation · doi:10.1161/circulationaha.109.192667 · Cited by 5,700
HEART DISEASE AND STROKE STATISTICS–2014 UPDATE: A REPORT FROM THE AMERICAN HEART ASSOCIATION
Tarver, T. (2014) · Journal of Consumer Health on the Internet · doi:10.1080/15398285.2014.902284 · Cited by 5,595
Estimation of ten-year risk of fatal cardiovascular disease in Europe: the SCORE project
Conroy, R. (2003) · European Heart Journal · doi:10.1016/s0195-668x(03)00114-3 · Cited by 5,290
2013 ACC/AHA Guideline on the Assessment of Cardiovascular Risk
Goff, D. C., Lloyd-Jones, D. M., Bennett, G., Coady, S., D’Agostino, R. B., Gibbons, R., Greenland, P., Lackland, D. T., Levy, D., O’Donnell, C. J., et al. (2014) · Journal of the American College of Cardiology · doi:10.1016/j.jacc.2013.11.005 · Cited by 4,945
HASKELL, W. L., LEE, I.-M., PATE, R. R., POWELL, K. E., BLAIR, S. N., FRANKLIN, B. A., MACERA, C. A., HEATH, G. W., THOMPSON, P. D., & BAUMAN, A. (2007) · Medicine & Science in Sports & Exercise · doi:10.1249/mss.0b013e3180616b27 · Cited by 4,616
2013 ESC guidelines on the management of stable coronary artery disease
Task Force Members, Montalescot, G., Sechtem, U., Achenbach, S., Andreotti, F., Arden, C., Budaj, A., Bugiardini, R., Crea, F., Cuisset, T., et al. (2013) · European Heart Journal · doi:10.1093/eurheartj/eht296 · Cited by 4,510
Exercise capacity and mortality among men referred for exercise testing
Myers, J., Prakash, M., Froelicher, V., Do, D., Partington, S., & Atwood, J. E. (2002) · New England Journal of Medicine · doi:10.1056/nejmoa011858 · Cited by 4,114
Goff, D. C., Lloyd-Jones, D. M., Bennett, G., Coady, S., D’Agostino, R. B., Gibbons, R., Greenland, P., Lackland, D. T., Levy, D., O’Donnell, C. J., et al. (2014) · Circulation · doi:10.1161/01.cir.0000437741.48606.98 · Cited by 3,697
Fit Yourself and Take Your Lungs to Heart
Palange, P., & Bonini, M. (2013) · Respiration · doi:10.1159/000350831 · Cited by 2,780
Fihn, S. D., Gardin, J. M., Abrams, J., Berra, K., Blankenship, J. C., Dallas, A. P., Douglas, P. S., Foody, J. M., Gerber, T. C., Hinderliter, A. L., et al. (2012) · Circulation · doi:10.1161/cir.0b013e3182776f83 · Cited by 2,419
Eckel, R. H., Jakicic, J. M., Ard, J. D., de Jesus, J. M., Miller, N. H., Hubbard, V. S., Lee, I.-M., Lichtenstein, A. H., Loria, C. M., Millen, B. E., et al. (2014) · Circulation · doi:10.1161/01.cir.0000437740.48606.d1 · Cited by 2,261
O'Connor (2009) · doi:10.1001/jama.2009.454 · Cited by 2,173
A Randomized Trial of Low-Dose Aspirin in the Primary Prevention of Cardiovascular Disease in Women
Ridker, P. M., Cook, N. R., Lee, I.-M., Gordon, D., Gaziano, J. M., Manson, J. E., Hennekens, C. H., & Buring, J. E. (2005) · New England Journal of Medicine · doi:10.1056/nejmoa050613 · Cited by 1,945
Exercise-Based Cardiac Rehabilitation for Coronary Heart Disease
Anderson, L., Oldridge, N., Thompson, D. R., Zwisler, A.-D., Rees, K., Martin, N., & Taylor, R. S. (2016) · Journal of the American College of Cardiology · doi:10.1016/j.jacc.2015.10.044 · Cited by 1,910
Effects of the amount and intensity of exercise on plasma lipoproteins
Kraus, W. E., Houmard, J. A., Duscha, B. D., Knetzger, K. J., Wharton, M. B., McCartney, J. S., Bales, C. W., Henes, S., Samsa, G. P., Otvos, J. D., et al. (2002) · New England Journal of Medicine · doi:10.1056/nejmoa020194 · Cited by 1,554
Arem, H., Moore, S. C., Patel, A., Hartge, P., Berrington de Gonzalez, A., Visvanathan, K., Campbell, P. T., Freedman, M., Weiderpass, E., Adami, H. O., et al. (2015) · JAMA Internal Medicine · doi:10.1001/jamainternmed.2015.0533 · Cited by 1,498
2013 AHA/ACC Guideline on Lifestyle Management to Reduce Cardiovascular Risk
Eckel, R. H., Jakicic, J. M., Ard, J. D., de Jesus, J. M., Houston Miller, N., Hubbard, V. S., Lee, I.-M., Lichtenstein, A. H., Loria, C. M., Millen, B. E., et al. (2014) · Journal of the American College of Cardiology · doi:10.1016/j.jacc.2013.11.003 · Cited by 1,160
Lee, I.-M., Cook, N. R., Gaziano, J. M., Gordon, D., Ridker, P. M., Manson, J. E., Hennekens, C. H., & Buring, J. E. (2005) · JAMA · doi:10.1001/jama.294.1.56 · Cited by 1,137
Exercise training meta-analysis of trials in patients with chronic heart failure (ExTraMATCH)
Piepoli, M. F., Davos, C. H., Francis, D. P., & Coats, A. J. S. (2004) · BMJ · doi:10.1136/bmj.37938.645220.ee · Cited by 994
Seong, S. C., Kim, Y.-Y., Park, S. K., Khang, Y., Kim, H. C., Park, J. H., Kang, H. J., Do, C.-H., Song, J.-S., Lee, E. J., et al. (2017) · BMJ Open · doi:10.1136/bmjopen-2017-016640 · Cited by 836
Cook, N. R., Lee, I.-M., Gaziano, J. M., Gordon, D., Ridker, P. M., Manson, J. E., Hennekens, C. H., & Buring, J. E. (2005) · JAMA · doi:10.1001/jama.294.1.47 · Cited by 796
Moore, S. C., Patel, A. V., Matthews, C. E., Berrington de Gonzalez, A., Park, Y., Katki, H. A., Linet, M. S., Weiderpass, E., Visvanathan, K., Helzlsouer, K. J., et al. (2012) · PLoS Medicine · doi:10.1371/journal.pmed.1001335 · Cited by 690
Gielen, S., Adams, V., Möbius-Winkler, S., Linke, A., Erbs, S., Yu, J., Kempf, W., Schubert, A., Schuler, G., & Hambrecht, R. (2003) · Journal of the American College of Cardiology · doi:10.1016/s0735-1097(03)00848-9 · Cited by 613
The American Cancer Society Cancer Prevention Study II Nutrition Cohort
Calle, E. E., Rodriguez, C., Jacobs, E. J., Almon, M., Chao, A., McCullough, M. L., Feigelson, H. S., & Thun, M. J. (2002) · Cancer · doi:10.1002/cncr.10197 · Cited by 492
Mozaffarian, D., Furberg, C. D., Psaty, B. M., & Siscovick, D. (2008) · Circulation · doi:10.1161/circulationaha.108.785626 · Cited by 476
Exercise training in patients with chronic heart failure: Fig 1: Authors' reply
Piepoli, M. F., & Francis, D. P. (2004) · BMJ · doi:10.1136/bmj.328.7441.711-b · Cited by 472
The American Cancer Society Cancer Prevention Study II Nutrition Cohort
Calle, E. E., Rodríguez, C., Jacobs, E. J., Almon, M., Chao, A., McCullough, M. L., Feigelson, H. S., & Thun, M. J. (2002) · Cancer · doi:10.1002/cncr.101970 · Cited by 422
Smith, J. K. (1999) · JAMA · doi:10.1001/jama.281.18.1722 · Cited by 420
Genkinger, J. M., Platz, E. A., Hoffman, S. C., Comstock, G. W., & Helzlsouer, K. J. (2004) · American Journal of Epidemiology · doi:10.1093/aje/kwh339 · Cited by 351
Cardiorespiratory Fitness and Mortality in Healthy Men and Women
Imboden, M. T., Harber, M. P., WHALEY, M. H., Finch, W. H., Bishop, D. L., & Kaminsky, L. A. (2018) · Journal of the American College of Cardiology · doi:10.1016/j.jacc.2018.08.2166 · Cited by 277
Strasser, B., Siebert, U., & Schobersberger, W. (2010) · Sports Medicine · doi:10.2165/11531380-000000000-00000 · Cited by 258
Fihn, S. D., Gardin, J. M., Abrams, J., Berra, K., Blankenship, J. C., Dallas, A. P., Douglas, P. S., Foody, J. M., Gerber, T. C., Hinderliter, A. L., et al. (2012) · Journal of the American College of Cardiology · doi:10.1016/j.jacc.2012.07.012 · Cited by 242
Basic science behind the cardiovascular benefits of exercise
Wilson, M. G., Ellison, G. M., & Cable, N. T. (2015) · Heart · doi:10.1136/heartjnl-2014-306596 · Cited by 156
Effects of Exercise Training and Deconditioning on Platelet Function in Men
Wang, J., Jen, C. J., & Chen, H. (1995) · Arteriosclerosis Thrombosis and Vascular Biology · doi:10.1161/01.atv.15.10.1668 · Cited by 155
Basic science behind the cardiovascular benefits of exercise
Wilson, M. G., Ellison, G. M., & Cable, N. T. (2016) · British Journal of Sports Medicine · doi:10.1136/bjsports-2014-306596rep · Cited by 112
Margolis, K. L., Mucci, L. A., Braaten, T., Kumle, M. H., Lagerros, Y. T., Adami, H., Lund, E., & Weiderpass, E. (2005) · Cancer Epidemiology Biomarkers & Prevention · doi:10.1158/1055-9965.27.14.1 · Cited by 90
Howard, R. A., Leitzmann, M. F., Linet, M. S., & Freedman, D. M. (2008) · Cancer Causes & Control · doi:10.1007/s10552-008-9246-2 · Cited by 56
Koster, A., Harris, T. B., Moore, S. C., Schatzkin, A. G., Hollenbeck, A. R., van Eijk, J. T. M., & Leitzmann, M. F. (2009) · American Journal of Epidemiology · doi:10.1093/aje/kwp053 · Cited by 55
Liu, Y., Shu, X., Wen, W., Saito, E., Rahman, M. S., Tsugane, S., Tamakoshi, A., Xiang, Y., Yuan, J., Gao, Y., et al. (2018) · International Journal of Epidemiology · doi:10.1093/ije/dyy024 · Cited by 48
Vasankari, V., Husu, P., Vähä‐Ypyä, H., Suni, J. H., Tokola, K., Borodulin, K., Wennman, H., Halonen, J., Hartikainen, J. E. K., Sievänen, H. T., et al. (2018) · BMJ Open Sport & Exercise Medicine · doi:10.1136/bmjsem-2018-000363 · Cited by 37
Research works printed but not linked: 2
- 2018, 2018 Physical Activity Guidelines Advisory Committee Scientific Report
- 2010, Global Recommendations on Physical Activity for Health
Cited by
Sorted by citations
Exercise sustains the hallmarks of health
Qiu, Y., Fernández-García, B., Lehmann, H. I., Li, G., Kroemer, G., López-Otín, C., & Xiao, J. (2023) · Journal of Sport and Health Science · doi:10.1016/j.jshs.2022.10.003 · Cited by 270
Exercise for Primary and Secondary Prevention of Cardiovascular Disease
Tucker, W. J., Fegers‐Wustrow, I., Halle, M., Haykowsky, M. J., Chung, E. H., & Kovacic, J. C. (2022) · Journal of the American College of Cardiology · doi:10.1016/j.jacc.2022.07.004 · Cited by 280
Exercise benefits in cardiovascular diseases: From mechanisms to clinical implementation
Valenzuela, P. L., Ruilope, L. M., Santos-Lozano, A., Wilhelm, M., Kränkel, N., Fiuza-Luces, C., & Lucia, A. (2023) · European Heart Journal · doi:10.1093/eurheartj/ehad170 · Cited by 237
Exercise and cardiovascular health: A state-of-the-art review
Isath, A., Koziol, K. J., Martinez, M. W., Garber, C. E., Martinez, M. N., Emery, M. S., Baggish, A. L., Naidu, S. S., Lavie, C. J., Arena, R., et al. (2023) · Progress in Cardiovascular Diseases · doi:10.1016/j.pcad.2023.04.008 · Cited by 176
Teixeira, E., Fonseca, H., Diniz‐Sousa, F., Veras, L., Boppre, G., de Oliveira, J. J. F., Pinto, D., Alves, A. J., Barbosa, A., Mendes, R., et al. (2021) · Geriatrics · doi:10.3390/geriatrics6020038 · Cited by 179
Metadata
- Authors
- Jeong, S.-W., Kim, S.-H., Kang, S.-H., Kim, H.-J., Yoon, C.-H., Youn, T.-J., & Chae, I.-H.
- Affiliations
- Seoul National University (KR)
- Chung-Ang University (KR)
- Corresponding author
- Kang, Si-Hyuck
- Venue
- European Heart Journal
- Publisher
- Oxford University Press (OUP)
- Published
- 2019-09-01
- Volume
- 40
- Issue
- 43
- Pages
- 3547-3555
- ISSN
- 0195-668X (ISSN-L)
- 1522-9645
- PMC
- PMC6855138
- OpenAlex
- W2970775832
- Cited by
- 320
- References
- 48
- Citations by year
- 2026: 31 · 2025: 44 · 2024: 74 · 2023: 46 · 2022: 49 · 2021: 47 · 2020: 25 · 2019: 3
- FWCI
- 21.25
- Type
- journal article
- Language
- en
- Open access
- hybrid
- doi.org
- Licence
- Locations
- European Heart Journal (publishedVersion, cc-by-nc)
- Europe PMC (PubMed Central) (publishedVersion, cc-by-nc)
- PubMed Central (publishedVersion, cc-by-nc)
- PubMed (publishedVersion)
- Funders
- Basic Science Research Programme
- National Research Foundation of Korea (2019R1C1C1006611)
- Topics
- Health Sciences › Medicine › Public Health, Environmental and Occupational Health › Physical Activity and Health
- Health Sciences › Medicine › Physiology (medical) › Cardiovascular and exercise physiology
- Health Sciences › Medicine › Cardiology and Cardiovascular Medicine › Cardiovascular Effects of Exercise
- Keywords
- physical activity, leisure-time physical activity, cardiovascular disease, all-cause mortality, primary prevention, secondary prevention, metabolic equivalent minutes, dose-response relationship, cardiovascular risk reduction
- MeSH terms
- Adult, Aged, Aged, 80 and over, Cardiovascular Diseases, Female, Follow-Up Studies, Humans, Leisure Activities, Male, Middle Aged, Primary Prevention, Risk Factors, Health Behavior, Exercise, Survival Analysis, Case-Control Studies, Risk Reduction Behavior, Secondary Prevention, Self Report, Protective Factors
About these checks
Registry, retraction, Cites and statistics results are computed, not judged, with one exception: a printed reference that no index lists is read once by a model before it counts as a citation error. Claims are extracted by a model and kept only when their quote appears verbatim in the text; each cited source is then checked, with a model’s help, for whether it says what the claim relies on. Those verdicts can be wrong — read the claim’s quote and the cited source before relying on one.
Statistics and arithmetic are recomputed, not judged.
Confidence bands are shown only for fields calibrated on our annotated test set. None is calibrated yet, so no band is shown.
What counts as a claim ›How we measure confidence ›How we check this ›
Are you an author, or do you see a problem with this page? Request a review
