

The DOI matches its Crossref record; 15 of the 15 references it cites were found in a registry or an index.
Detecting Signatures of Positive Selection along Defined Branches of a Population Tree Using LSD
Overview
The claims and statistics of this paper haven’t been checked yet.
Run the check — free, no account needed. It reads the open-access text and checks the sources it cites.
Integrity signals
Registry
Cites
Statistics
Figures
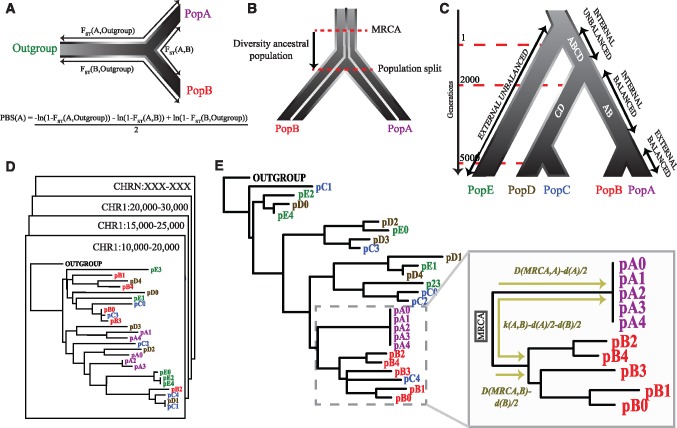
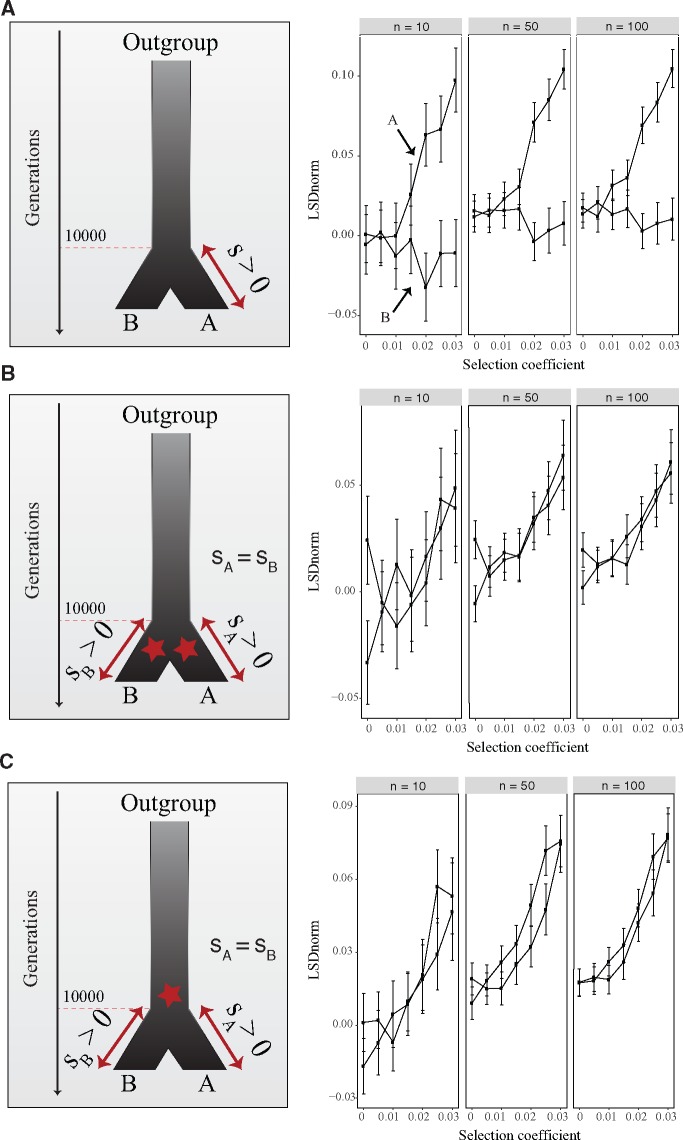
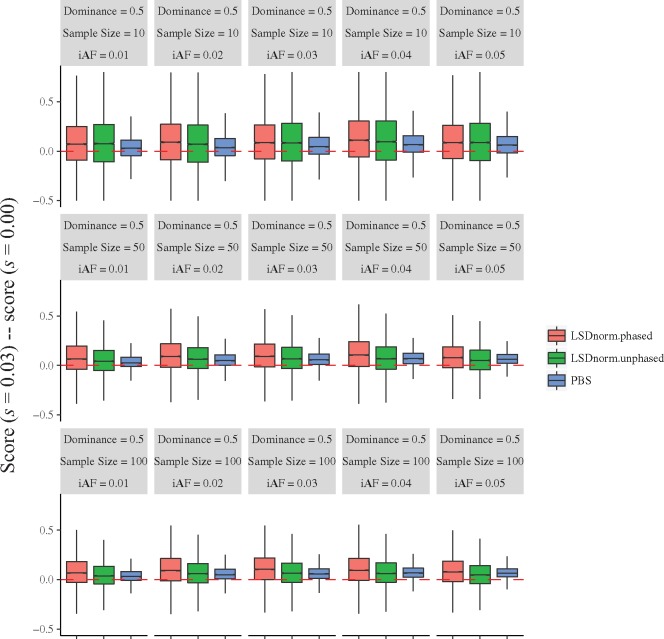
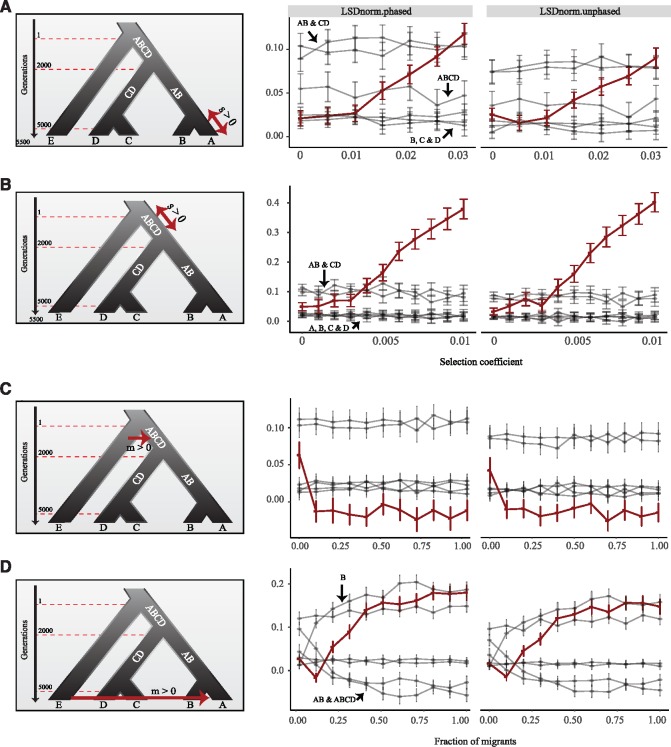
Verification
Claims the paper makes
The claims and statistics of this paper haven’t been checked yet.
Run the check — free, no account needed. It reads the open-access text and checks the sources it cites.
Claims other papers make about this one
Each is checked against this paper’s own text: does it say what the citing paper says it does?
The check wasn’t confident either way, so it gives no verdict — never disputed.
In the citing paper
“Ancient dental calculus have metagenomic diversity profiles similar to modern dental calculus”
From Ancient DNA analysis (2021) · cites this paper as [349]
Experimental — accuracy not yet measuredThe check wasn’t confident either way, so it gives no verdict — never disputed.
In the citing paper
“Microbes colonizing skeletal material generally originate from soil”
From Ancient DNA analysis (2021) · cites this paper as [349]
Experimental — accuracy not yet measuredThe check wasn’t confident either way, so it gives no verdict — never disputed.
In the citing paper
“paleofeces resemble modern feces from nonindustrialized populations”
From Ancient DNA analysis (2021) · cites this paper as [349]
Experimental — accuracy not yet measuredThe check wasn’t confident either way, so it gives no verdict — never disputed.
In the citing paper
“some dentine samples show evidence of being decomposed by the dental plaque bacteria”
From Ancient DNA analysis (2021) · cites this paper as [349]
Experimental — accuracy not yet measured
Self-check
Percentages, sums and reported differences re-computed from the paper’s own numbers.
The self-check needs the paper’s full text.
Citations
Cites
Genome-wide detection and characterization of positive selection in human populations
The International HapMap Consortium, Sabeti, P. C., Varilly, P., Fry, B., Lohmueller, J., Hostetter, E., Cotsapas, C., Xie, X., Byrne, E. H., McCarroll, S. A., et al. (2007) · Nature · doi:10.1038/nature06250 · Cited by 2,131
Detecting recent positive selection in the human genome from haplotype structure
Sabeti, P. C., Reich, D. E., Higgins, J. M., Levine, H. Z. P., Richter, D. J., Schaffner, S. F., Gabriel, S. B., Platko, J. V., Patterson, N. J., McDonald, G. J., et al. (2002) · Nature · doi:10.1038/nature01140 · Cited by 2,106
Massive migration from the steppe was a source for Indo-European languages in Europe
Haak, W., Lazaridis, I., Patterson, N., Rohland, N., Mallick, S., Llamas, B., Brandt, G., Nordenfelt, S., Harney, E., Stewardson, K., et al. (2015) · Nature · doi:10.1038/nature14317 · Cited by 1,940
Sequencing of 50 Human Exomes Reveals Adaptation to High Altitude
Yi, X., Liang, Y., Huerta-Sanchez, E., Jin, X., Cuo, Z. X. P., Pool, J. E., Xu, X., Jiang, H., Vinckenbosch, N., Korneliussen, T. S., et al. (2010) · Science · doi:10.1126/science.1190371 · Cited by 1,611 · cited 2×
“Adaptation to local environments allowed life to spread across all ecosystems around the globe, ranging from deep-sea floors to high altitude mountain ranges (Yi et al. 2010; Fan et al. 2016; Sun et al. 2017).”
Genome-wide patterns of selection in 230 ancient Eurasians
Mathieson, I., Lazaridis, I., Rohland, N., Mallick, S., Patterson, N., Roodenberg, S. A., Harney, E., Stewardson, K., Fernandes, D., Novak, M., et al. (2015) · Nature · doi:10.1038/nature16152 · Cited by 1,515
Ancient human genomes suggest three ancestral populations for present-day Europeans
Lazaridis, I., Patterson, N., Mittnik, A., Renaud, G., Mallick, S., Kirsanow, K., Sudmant, P. H., Schraiber, J. G., Castellano, S., Lipson, M., et al. (2014) · Nature · doi:10.1038/nature13673 · Cited by 1,357
Genome sequence of a 45,000-year-old modern human from western Siberia
Fu, Q., Li, H., Moorjani, P., Jay, F., Slepchenko, S. M., Bondarev, A. A., Johnson, P. L. F., Aximu-Petri, A., Prüfer, K., de Filippo, C., et al. (2014) · Nature · doi:10.1038/nature13810 · Cited by 1,023
An early modern human from Romania with a recent Neanderthal ancestor
Fu, Q., Hajdinjak, M., Moldovan, O. T., Constantin, S., Mallick, S., Skoglund, P., Patterson, N., Rohland, N., Lazaridis, I., Nickel, B., et al. (2015) · Nature · doi:10.1038/nature14558 · Cited by 802
Contribution of major diseases to disparities in mortality.
Wong, M. D., Shapiro, M. F., Boscardin, W. J., & Ettner, S. L. (2002) · New England Journal of Medicine · doi:10.1056/nejmsa012979 · Cited by 774
Natural selection has driven population differentiation in modern humans
Barreiro, L. B., Laval, G., Quach, H., Patin, E., & Quintana-Murci, L. (2008) · Nature Genetics · doi:10.1038/ng.78 · Cited by 605
Research works printed but not linked: 57
- Abbas, 1983, Persistence of high intestinal lactase activity in Pakistan, Hum Genet, 64, 277, 10.1007/BF00279410 · DOI
- Agyemang, 2003, Is the blood pressure of people from African origin adults in the UK higher or lower than that in European origin white people? A review of cross-sectional data, J Hum Hypertens, 17, 523, 10.1038/sj.jhh.1001586 · DOI
- Auburger, 2014, 12q24 locus association with type 1 diabetes: SH2B3 or ATXN2?, World J Diabetes, 5, 316, 10.4239/wjd.v5.i3.316 · DOI
- Berg, 2015, A coalescent model for a sweep of a unique standing variant, Genetics, 201, 707, 10.1534/genetics.115.178962 · DOI
- Bersaglieri, 2004, Genetic signatures of strong recent positive selection at the lactase gene, Am J Hum Genet, 74, 1111, 10.1086/421051 · DOI
- Blanton, 1991, Linkage mapping of autosomal dominant retinitis pigmentosa (RP1) to the pericentric region of human chromosome 8, Genomics, 11, 857, 10.1016/0888-7543(91)90008-3 · DOI
- Bonhomme, 2010, Detecting selection in population trees: The Lewontin and Krakauer test extended, Genetics, 186, 241, 10.1534/genetics.110.117275 · DOI
- Brinkworth, 2014, The contribution of natural selection to present-day susceptibility to chronic inflammatory and autoimmune disease, Curr Opin Immunol, 31, 66, 10.1016/j.coi.2014.09.008 · DOI
- Chen, 2010, Population differentiation as a test for selective sweeps, Genome Res, 20, 393, 10.1101/gr.100545.109 · DOI
- Clément, 2009, In obese and non-obese adults, the cis-regulatory rs361072 promoter variant of PIK3CB is associated with insulin resistance not with type 2 diabetes, Mol Genet Metab, 96, 129, 10.1016/j.ymgme.2008.11.160 · DOI
- Colagiuri, 2002, The “carnivore connection”–evolutionary aspects of insulin resistance, Eur J Clin Nutr, 56, S30, 10.1038/sj.ejcn.1601351 · DOI
- DeGiorgio, 2016, SweepFinder2: Increased sensitivity, robustness and flexibility, Bioinformatics, 32, 1895, 10.1093/bioinformatics/btw051 · DOI
- Fan, 2016, Going global by adapting local: A review of recent human adaptation, Science, 354, 54, 10.1126/science.aaf5098 · DOI
- Fariello, 2013, Detecting signatures of selection through haplotype differentiation among hierarchically structured populations, Genetics, 193, 929, 10.1534/genetics.112.147231 · DOI
- Ferrer-Admetlla, 2014, On detecting incomplete soft or hard selective sweeps using haplotype structure, Mol Biol Evol, 31, 1275, 10.1093/molbev/msu077 · DOI
- Field, 2016, Detection of human adaptation during the past 2000 years, Science, 354, 760, 10.1126/science.aag0776 · DOI · Paper page
- Garud, 2015, Recent selective sweeps in North American Drosophila melanogaster show signatures of soft sweeps, PLoS Genet., 11, e1005004., 10.1371/journal.pgen.1005004 · DOI
- Green, 2010, A draft sequence of the Neandertal genome, Science, 328, 710, 10.1126/science.1188021 · DOI · Paper page
- Grün, 2005, U-series and ESR analyses of bones and teeth relating to the human burials from Skhul, J Hum Evol, 49, 316, 10.1016/j.jhevol.2005.04.006 · DOI · Paper page
- Hermisson, 2005, Soft sweeps: Molecular population genetics of adaptation from standing genetic variation, Genetics, 169, 2335, 10.1534/genetics.104.036947 · DOI
- Hershkovitz, 2018, The earliest modern humans outside Africa, Science, 359, 456, 10.1126/science.aap8369 · DOI
- Heyer, 2011, Lactase persistence in central Asia: Phenotype, genotype, and evolution, Hum Biol, 83, 379, 10.3378/027.083.0304 · DOI
- Hofer, 2009, Large allele frequency differences between human continental groups are more likely to have occurred by drift during range expansions than by selection, Ann Hum Genet, 73, 95, 10.1111/j.1469-1809.2008.00489.x · DOI
- Hudson, 1987, A test of neutral molecular evolution based on nucleotide data, Genetics, 116, 153, 10.1093/genetics/116.1.153 · DOI
- Hudson, 1992, Estimation of levels of gene flow from DNA sequence data, Genetics, 132, 583, 10.1093/genetics/132.2.583 · DOI
- Ihara, 2007, Sept4, a component of presynaptic scaffold and Lewy bodies, is required for the suppression of alpha-synuclein neurotoxicity, Neuron, 53, 519, 10.1016/j.neuron.2007.01.019 · DOI
- Kaplan, 1988, The coalescent process in models with selection, Genetics, 120, 819, 10.1093/genetics/120.3.819 · DOI
- Kaplan, 1989, The “hitchhiking effect” revisited, Genetics, 123, 887, 10.1093/genetics/123.4.887 · DOI · Paper page
- Kim, 2002, Detecting a local signature of genetic hitchhiking along a recombining chromosome, Genetics, 160, 765, 10.1093/genetics/160.2.765 · DOI
- Kullo, 2014, The ATXN2-SH2B3 locus is associated with peripheral arterial disease: An electronic medical record-based genome-wide association study, Front Genet, 5, 166., 10.3389/fgene.2014.00166 · DOI
- Lefort, 2015, FastME 2.0: A comprehensive, accurate, and fast distance-based phylogeny inference program, Mol Biol Evol, 32, 2798, 10.1093/molbev/msv150 · DOI
- Lewontin, 1973, Distribution of gene frequency as a test of the theory of the selective neutrality of polymorphisms, Genetics, 74, 175, 10.1093/genetics/74.1.175 · DOI
- Marciniak, 2017, Harnessing ancient genomes to study the history of human adaptation, Nat. Rev. Genet, 18, 659, 10.1038/nrg.2017.65 · DOI
- McDonald, 1991, Adaptive protein evolution at the Adh locus in Drosophila, Nature, 351, 652, 10.1038/351652a0 · DOI
- Nei, 1975, Lewontin-Krakauer test for neutral genes, Genetics, 80, 395., 10.1093/genetics/80.2.395 · DOI
- Nielsen, 2017, Tracing the peopling of the world through genomics, Nature, 541, 302, 10.1038/nature21347 · DOI · Paper page
- Orrù, 2013, Genetic variants regulating immune cell levels in health and disease, Cell, 155, 242, 10.1016/j.cell.2013.08.041 · DOI
- Pace, 2014, Leishmaniasis, J. Infect, 69(1 Suppl), S10, 10.1016/j.jinf.2014.07.016 · DOI
- Patterson, 2012, Ancient admixture in human history, Genetics, 192, 1065, 10.1534/genetics.112.145037 · DOI · Paper page
- Pavlidis, 2013, SweeD: Likelihood-based detection of selective sweeps in thousands of genomes, Mol Biol Evol, 30, 2224, 10.1093/molbev/mst112 · DOI
- Pierce, 1999, Mutations in a gene encoding a new oxygen-regulated photoreceptor protein cause dominant retinitis pigmentosa, Nat Genet, 22, 248, 10.1038/10305 · DOI
- Price, 2010, FastTree 2—Approximately maximum-likelihood trees for large alignments, PLoS One, 5, e9490., 10.1371/journal.pone.0009490 · DOI · Paper page
- Racimo, 2016, Testing for ancient selection using cross-population allele frequency differentiation, Genetics, 202, 733, 10.1534/genetics.115.178095 · DOI · Paper page
- Ronquist, 2003, MrBayes 3: Bayesian phylogenetic inference under mixed models, Bioinforma Oxf Engl, 19, 1572, 10.1093/bioinformatics/btg180 · DOI
- Shriver, 2004, The genomic distribution of population substructure in four populations using 8,525 autosomal SNPs, Hum Genomics, 1, 274., 10.1186/1479-7364-1-4-274 · DOI
- Sikora, 2017, Ancient genomes show social and reproductive behavior of early Upper Paleolithic foragers, Science, 358, 659, 10.1126/science.aao1807 · DOI · Paper page
- Smith, 1974, The hitch-hiking effect of a favourable gene, Genet Res, 23, 23, 10.1017/S0016672300014634 · DOI · Paper page
- Stamatakis, 2014, RAxML version 8: A tool for phylogenetic analysis and post-analysis of large phylogenies, Bioinformatics, 30, 1312, 10.1093/bioinformatics/btu033 · DOI · Paper page
- Sun, 2017, Adaptation to deep-sea chemosynthetic environments as revealed by mussel genomes, Nat Ecol Evol, 1, 121, 10.1038/s41559-017-0121 · DOI
- Tataru, 2017, Statistical Inference in the Wright–Fisher Model Using Allele Frequency Data, e30
- The 1000 Genomes Project Consortium, 2015, A global reference for human genetic variation, Nature, 526, 68, 10.1038/nature15393 · DOI · Paper page
- Vatsiou, 2016, Changes in selective pressures associated with human population expansion may explain metabolic and immune related pathways enriched for signatures of positive selection, BMC Genomics, 17, 504., 10.1186/s12864-016-2783-2 · DOI
- Vitti, 2013, Detecting natural selection in genomic data, Annu Rev Genet, 47, 97, 10.1146/annurev-genet-111212-133526 · DOI · Paper page
- Voight, 2006, A map of recent positive selection in the human genome, PLoS Biol, 4, e72., 10.1371/journal.pbio.0040072 · DOI
- Yang, 1997, Bayesian phylogenetic inference using DNA sequences: A Markov chain Monte Carlo method, Mol Biol Evol, 14, 717, 10.1093/oxfordjournals.molbev.a025811 · DOI · Paper page
- Zhang, 2005, WebGestalt: An integrated system for exploring gene sets in various biological contexts, Nucleic Acids Res., 33, W741, 10.1093/nar/gki475 · DOI
- Zhang, 2013, Signatures of natural selection on genetic variants affecting complex human traits, Appl. Transl. Genomics, 2, 78, 10.1016/j.atg.2013.10.002 · DOI
Cited by
Sorted by citations
Orlando, L., Allaby, R., Skoglund, P., Der Sarkissian, C., Stockhammer, P. W., Ávila-Arcos, M. C., Fu, Q., Krause, J., Willerslev, E., Stone, A. C., et al. (2021) · Nature Reviews Methods Primers · doi:10.1038/s43586-020-00011-0 · Cited by 411
Self-citation
Metadata
- Authors
- Librado, P., & Orlando, L.
- Affiliations
- Centre for GeoGenetics, Natural History Museum of Denmark, Copenhagen, Denmark
- Venue
- Molecular Biology and Evolution
- Publisher
- Oxford University Press (OUP)
- Published
- 2018-03-29
- Volume
- 35
- Issue
- 6
- Pages
- 1520-1535
- ISSN
- 0737-4038
- 1537-1719
- PMC
- PMC5967574
- Cited by
- 28
- References
- 15
- Language
- en
About these checks
Registry, retraction, Cites and statistics results are computed, not judged, with one exception: a printed reference that no index lists is read once by a model before it counts as a citation error. Claims are extracted by a model and kept only when their quote appears verbatim in the text; each cited source is then checked, with a model’s help, for whether it says what the claim relies on. Those verdicts can be wrong — read the claim’s quote and the cited source before relying on one.
Statistics and arithmetic are recomputed, not judged.
Confidence bands are shown only for fields calibrated on our annotated test set. None is calibrated yet, so no band is shown.
What counts as a claim ›How we measure confidence ›How we check this ›
Are you an author, or do you see a problem with this page? Request a review
