Cited by 41

The DOI matches its Crossref record; 12 of the 12 references it cites were found in a registry or an index.

Precise and broad scope genome editing based on high-specificity Cas9 nickases

Wang, Qian, Liu, Jin, Janssen, Josephine M, Le Bouteiller, Marie, Frock, Richard L, Gonçalves, Manuel A F V·2021·Nucleic Acids Research

Abstract

RNA-guided nucleases (RGNs) based on CRISPR systems permit installing short and large edits within eukaryotic genomes. However, precise genome editing is often hindered due to nuclease off-target activities and the multiple-copy character of the vast majority of chromosomal sequences. Dual nicking RGNs and high-specificity RGNs both exhibit low off-target activities. Here, we report that high-specificity Cas9 nucleases are convertible into nicking Cas9D10A variants whose precision is superior to that of the commonly used Cas9D10A nickase. Dual nicking RGNs based on a selected group of these Cas9D10A variants can yield gene knockouts and gene knock-ins at frequencies similar to or higher than those achieved by their conventional counterparts. Moreover, high-specificity dual nicking RGNs are capable of distinguishing highly similar sequences by ‘tiptoeing’ over pre-existing single base-pair polymorphisms. Finally, high-specificity RNA-guided nicking complexes generally preserve genomic integrity, as demonstrated by unbiased genome-wide high-throughput sequencing assays. Thus, in addition to substantially enlarging the Cas9 nickase toolkit, we demonstrate the feasibility in expanding the range and precision of DNA knockout and knock-in procedures. The herein introduced tools and multi-tier high-specificity genome editing strategies might be particularly beneficial whenever predictability and/or safety of genetic manipulations are paramount.

Overview

The claims and statistics of this paper haven’t been checked yet.

Run the check — free, no account needed. It reads the open-access text and checks the sources it cites.

A few free checks a day · papers already verified open instantly · results are public

Integrity signals

Registry

Crossref · 10.1093/nar/gkaa1236

Cites

12 of 12 references verified0 citation errors · 0 not checkable

Statistics

Figures

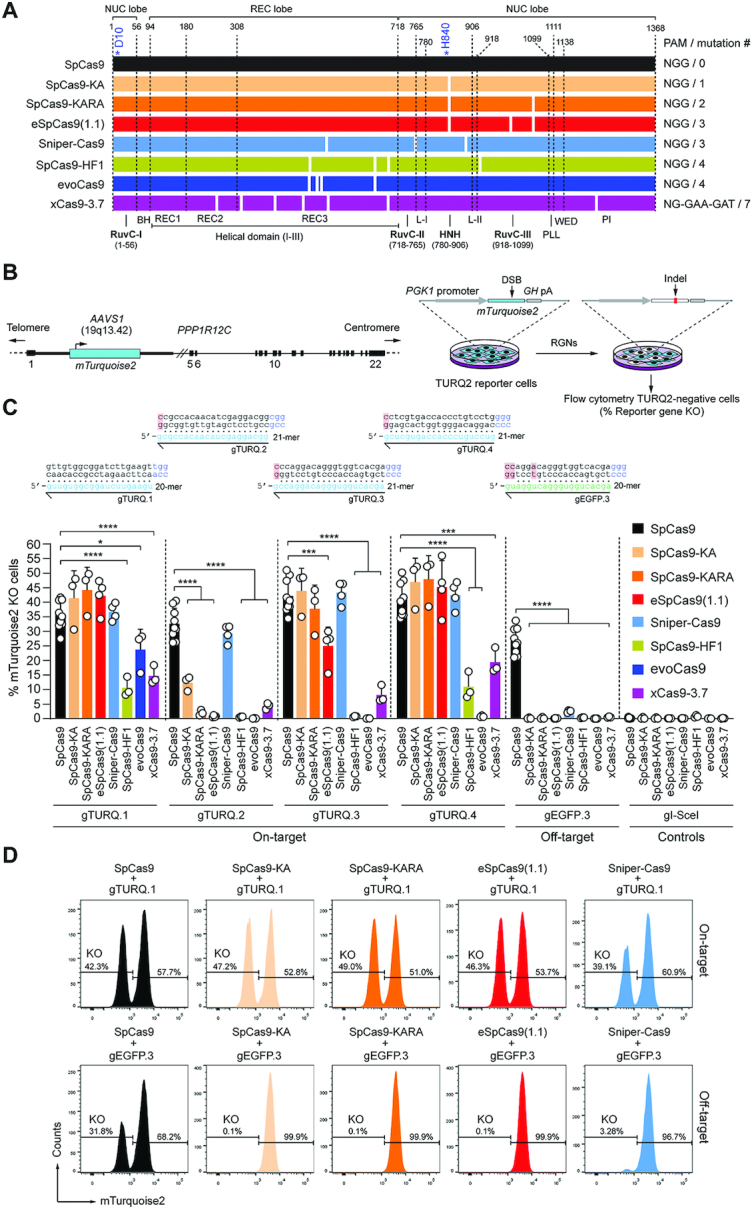
Figure 1. Comparing the activity and specificity of RGNs based on SpCas9 or SpCas9 variants. (A) Schematics of nucleases derived from the S. Pyogenes type II CRISPR system. Protein domains and mutations (white bars) are indicated. HNH, histidine-asparagine-histidine nuclease domain; RuvC, RNase H-like fold nuclease domain formed by tripartite assembly of RuvC-I, -II and -III. The HNH and RuvC domains in the nuclease lobe digest the target and non-target DNA strands, respectively. L-I and L-II, linker region I and II, respectively. Numerals correspond to the amino acid positions delimiting the various protein domains and motifs. BH, Arginine-rich bridge helix that connects the NUC and REC lobes; CTD, C-terminal domain in which the PAM-interacting motif (PI) is lodged; NUC and REC, nuclease and recognition lobes, respectively; PLL, phosphate lock loop. Asterisks mark residues D10 and H840 crucial for RuvC and HNH catalytic activities, respectively. (B) Gene knockout assays. TURQ2 cells contain an mTurquoise2 transgene at intron 1 of PPP1R12C (AAVS1 locus). Small insertions and deletions (indels) resulting from the action of programmable nucleases and NHEJ pathways at mTurquoise2 yield gene knockouts quantifiable by flow cytometry. (C) Determining RGN activities. TURQ2 cells were transfected with plasmids expressing the indicated RGN components. The gRNAs gTURQ.1 through gTURQ.4 have spacers fully complementary to mTurquoise2 sequences (on-target); EGFP-specific gEGFP.3 has a spacer with mismatches to a mTurquoise2 sequence (off-target). The non-targeting gRNA gI-SceI was used as a negative control. Non-hybridizing DNA-gRNA bases are highlighted in red. Gene knockout frequencies were determined at 10 days post-transfection through flow cytometry of mTurquoise2-negative cells. Data are presented as mean ± S.D. of at least three independent biological replicates. Significant differences between datasets were calculated with one-way ANOVA followed by Dunnett's test for multiple comparisons; *0.01 < P < 0.05; ***0.0001 < P < 0.001; ****P < 0.0001. (D) Examples of gene knockout datasets. Histograms corresponding to TURQ2 cell populations subjected to RGNs with spacers complementary and partially complementary to a target sequence (top and bottom panels, respectively).
Figure 1. Comparing the activity and specificity of RGNs based on SpCas9 or SpCas9 variants. (A) Schematics of nucleases derived from the S. Pyogenes type II CRISPR system. Protein domains and mutations (white bars) are indicated. HNH, histidine-asparagine-histidine nuclease domain; RuvC, RNase H-like fold nuclease domain formed by tripartite assembly of RuvC-I, -II and -III. The HNH and RuvC domains in the nuclease lobe digest the target and non-target DNA strands, respectively. L-I and L-II, linker region I and II, respectively. Numerals correspond to the amino acid positions delimiting the various protein domains and motifs. BH, Arginine-rich bridge helix that connects the NUC and REC lobes; CTD, C-terminal domain in which the PAM-interacting motif (PI) is lodged; NUC and REC, nuclease and recognition lobes, respectively; PLL, phosphate lock loop. Asterisks mark residues D10 and H840 crucial for RuvC and HNH catalytic activities, respectively. (B) Gene knockout assays. TURQ2 cells contain an mTurquoise2 transgene at intron 1 of PPP1R12C (AAVS1 locus). Small insertions and deletions (indels) resulting from the action of programmable nucleases and NHEJ pathways at mTurquoise2 yield gene knockouts quantifiable by flow cytometry. (C) Determining RGN activities. TURQ2 cells were transfected with plasmids expressing the indicated RGN components. The gRNAs gTURQ.1 through gTURQ.4 have spacers fully complementary to mTurquoise2 sequences (on-target); EGFP-specific gEGFP.3 has a spacer with mismatches to a mTurquoise2 sequence (off-target). The non-targeting gRNA gI-SceI was used as a negative control. Non-hybridizing DNA-gRNA bases are highlighted in red. Gene knockout frequencies were determined at 10 days post-transfection through flow cytometry of mTurquoise2-negative cells. Data are presented as mean ± S.D. of at least three independent biological replicates. Significant differences between datasets were calculated with one-way ANOVA followed by Dunnett's test for multiple comparisons; *0.01 < P < 0.05; ***0.0001 < P < 0.001; ****P < 0.0001. (D) Examples of gene knockout datasets. Histograms corresponding to TURQ2 cell populations subjected to RGNs with spacers complementary and partially complementary to a target sequence (top and bottom panels, respectively).CC BY · PubMed Central
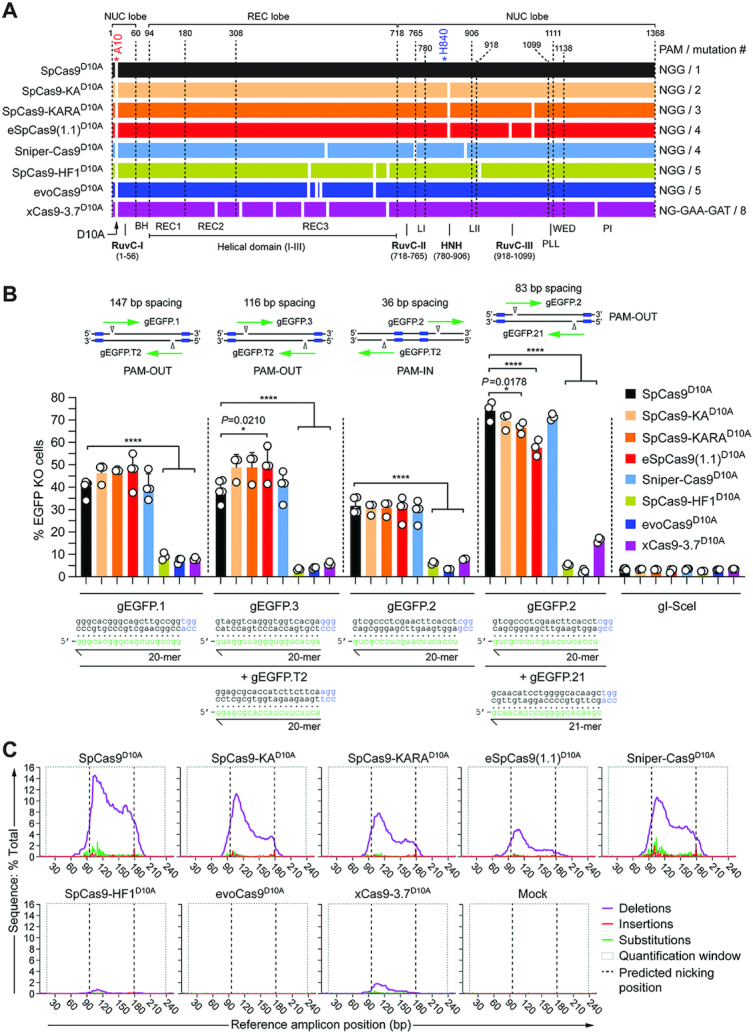
Figure 2. Comparing the activity of dual nRGNs based on SpCas9D10A or SpCas9D10A variants. (A) Schematics of original SpCas9D10A and SpCas9D10A variants generated for this study. Domains and mutations (white bars) in the nickases derived from the S. pyogenes type II CRISPR system are indicated. All nickases were obtained by introducing the RuvC-disabling D10A mutation into the nucleases depicted in Figure 1A. (B) Determining dual nRGN activities by gene knockout assays. EGFP-expressing H27 cells were transfected with constructs encoding the indicated dual nRGNs. Blue boxes, green arrows and open arrowheads in the insets indicate PAMs, gRNA spacers and nicking positions, respectively. Dual nRGNs with PAM-out and PAM-in arrangements were assessed. The non-targeting gRNA gI-SceI was used as a negative control. Gene knockout frequencies were determined by flow cytometry of EGFP-negative cells at 10 days post-transfection. Data are shown as mean ± S.D. of at least three independent biological replicates. Significance amongst the indicated datasets was calculated with one-way ANOVA followed by Dunnett's test for multiple comparisons; *0.01 < P < 0.05; ****P < 0.0001. (C) Characterization of dual nRGN ‘footprints by amplicon deep sequencing. H27 cells were exposed to dual nRGNs consisting of the indicated nickases loaded with gEGFP.2 and gEGFP.21. The types and frequencies of gene modifications detected at 48 h post-transfection within the EGFP target sequence are plotted.
Figure 2. Comparing the activity of dual nRGNs based on SpCas9D10A or SpCas9D10A variants. (A) Schematics of original SpCas9D10A and SpCas9D10A variants generated for this study. Domains and mutations (white bars) in the nickases derived from the S. pyogenes type II CRISPR system are indicated. All nickases were obtained by introducing the RuvC-disabling D10A mutation into the nucleases depicted in Figure 1A. (B) Determining dual nRGN activities by gene knockout assays. EGFP-expressing H27 cells were transfected with constructs encoding the indicated dual nRGNs. Blue boxes, green arrows and open arrowheads in the insets indicate PAMs, gRNA spacers and nicking positions, respectively. Dual nRGNs with PAM-out and PAM-in arrangements were assessed. The non-targeting gRNA gI-SceI was used as a negative control. Gene knockout frequencies were determined by flow cytometry of EGFP-negative cells at 10 days post-transfection. Data are shown as mean ± S.D. of at least three independent biological replicates. Significance amongst the indicated datasets was calculated with one-way ANOVA followed by Dunnett's test for multiple comparisons; *0.01 < P < 0.05; ****P < 0.0001. (C) Characterization of dual nRGN ‘footprints by amplicon deep sequencing. H27 cells were exposed to dual nRGNs consisting of the indicated nickases loaded with gEGFP.2 and gEGFP.21. The types and frequencies of gene modifications detected at 48 h post-transfection within the EGFP target sequence are plotted.CC BY · PubMed Central
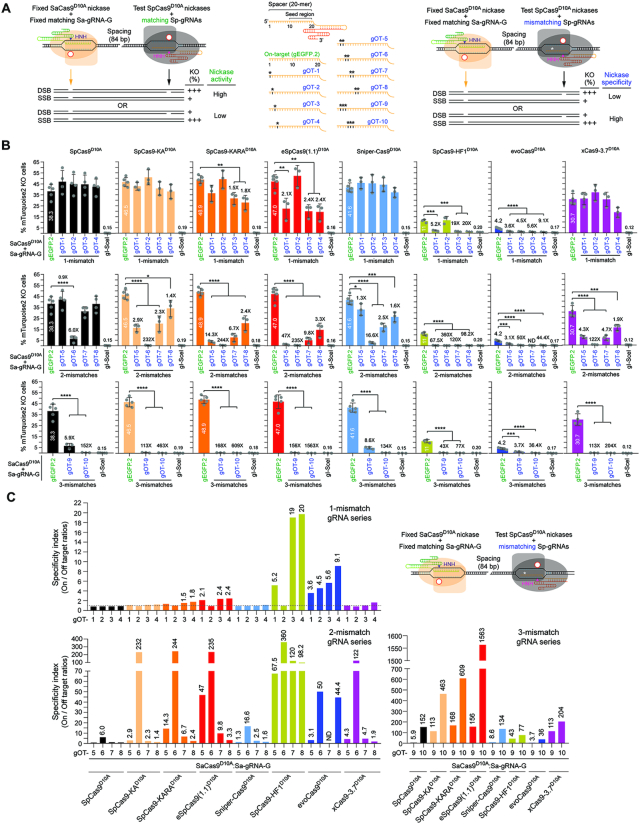
Figure 3. Comparing the performance of nRGNs based on SpCas9D10A or SpCas9D10A variants. (A) Cas9 orthogonal assay for determining the activity and specificity of nRGNs. A fixed S. aureus nRGN (orange) is introduced together with a test S. pyogenes nRGN (black) into reporter cells. Coordinated formation of SSBs at opposite strands of a bipartite reporter-encoding sequence by each nicking complex results in DSB-induced gene knockouts. Comparing the activities and specificities of different nickases can be assessed by loading S. pyogenes gRNAs with fully or partially hybridizing spacers (left and central panel, respectively). Test nRGN activities and specificities are directly and inversely proportional, respectively, to gene knockout frequencies (right panel). The fully matching spacer of S. pyogenes gEGFP.2 is drawn in relation to S. pyogenes gRNA spacers with 1-nt, 2-nt or 3-nt mismatches (asterisks) outside the seed region (central panel). (B) Comparing the specificity profiles of nRGNs with different nickases. Reporter cells were transfected with plasmids encoding the denoted nRGNs. The spacers of the three sets of off-target (OT) gRNAs, i.e., gOT-1 through gOT-4, gOT-5 through gOT-8 and gOT-9 plus gOT-10 have 1-nt, 2-nt and 3-nt mismatches, respectively, to the target sequence of gEGFP.2. Gene knockout levels were determined at 10 days post-transfection through flow cytometry of mTurquoise2-negative cells. Datasets correspond to mean ± S.D. of a minimum of three independent biological replicates. Significance between the indicated datasets was calculated with one-way ANOVA followed by Tukey's test for multiple comparisons; *0.01< P <0.05; **0.001< P <0.01; ***0.0001< P < 0.001; ****P< 0.0001. (C) The specificity indexes corresponding to DNA cleavage frequencies induced by nRGNs with mTurquoise2-matched gEGFP.2 divided by those triggered with mTurquoise2-mismatched gRNAs gOT-1 through gOT-10, are plotted. The statistically significant nRGN specificity indexes are presented above the respective bars.
Figure 3. Comparing the performance of nRGNs based on SpCas9D10A or SpCas9D10A variants. (A) Cas9 orthogonal assay for determining the activity and specificity of nRGNs. A fixed S. aureus nRGN (orange) is introduced together with a test S. pyogenes nRGN (black) into reporter cells. Coordinated formation of SSBs at opposite strands of a bipartite reporter-encoding sequence by each nicking complex results in DSB-induced gene knockouts. Comparing the activities and specificities of different nickases can be assessed by loading S. pyogenes gRNAs with fully or partially hybridizing spacers (left and central panel, respectively). Test nRGN activities and specificities are directly and inversely proportional, respectively, to gene knockout frequencies (right panel). The fully matching spacer of S. pyogenes gEGFP.2 is drawn in relation to S. pyogenes gRNA spacers with 1-nt, 2-nt or 3-nt mismatches (asterisks) outside the seed region (central panel). (B) Comparing the specificity profiles of nRGNs with different nickases. Reporter cells were transfected with plasmids encoding the denoted nRGNs. The spacers of the three sets of off-target (OT) gRNAs, i.e., gOT-1 through gOT-4, gOT-5 through gOT-8 and gOT-9 plus gOT-10 have 1-nt, 2-nt and 3-nt mismatches, respectively, to the target sequence of gEGFP.2. Gene knockout levels were determined at 10 days post-transfection through flow cytometry of mTurquoise2-negative cells. Datasets correspond to mean ± S.D. of a minimum of three independent biological replicates. Significance between the indicated datasets was calculated with one-way ANOVA followed by Tukey's test for multiple comparisons; *0.01< P <0.05; **0.001< P <0.01; ***0.0001< P < 0.001; ****P< 0.0001. (C) The specificity indexes corresponding to DNA cleavage frequencies induced by nRGNs with mTurquoise2-matched gEGFP.2 divided by those triggered with mTurquoise2-mismatched gRNAs gOT-1 through gOT-10, are plotted. The statistically significant nRGN specificity indexes are presented above the respective bars.CC BY · PubMed Central
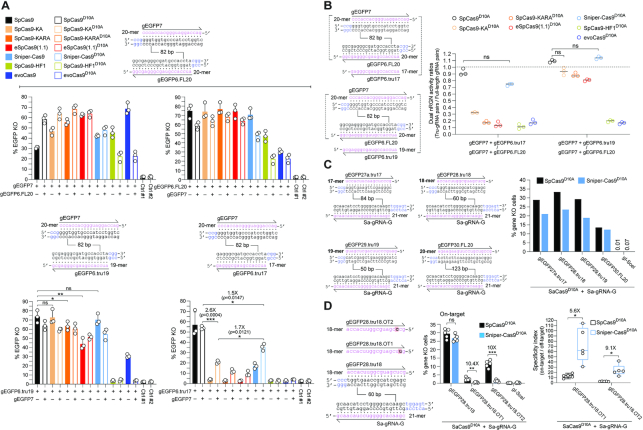
Figure 4. Investigating the integration of high-specificity dual nRGN and truncated gRNA principles. (A) Functional screening of high-specificity dual nRGNs with full-length and truncated gRNAs. EGFP-expressing H27 cells were exposed to dual nRGNs (open bars) containing a full-length gRNA pair (top panel) or expressing dual nRGNs harboring gRNA pairs with a truncated member (bottom panel). As references, H27 cells were exposed to RGNs (solid bars) with the same full-length gRNAs or truncated gRNAs. Results are presented as mean ± S.D. of independent biological replicates (n = 3). Significance between the indicated datasets was calculated using two-tailed Student's t tests. *0.01 < P < 0.05; **0.001< P < 0.01; P≥ 0.05 was considered non-significant (ns). (B) Testing the effect of full-length versus truncated gRNAs on dual nRGN activities. Dual RGN activity ratios obtained by dividing DNA cleavage frequencies induced with gRNA pairs containing a truncated member by those triggered with gRNA pairs with full-length gRNAs (panel A). Data are shown as mean ± S.D. of independent biological replicates (n = 3). Significance between the indicated datasets was calculated by one-way ANOVA followed by Dunnett's test for multiple comparisons; P ≥ 0.05 was considered non-significant (ns). (C) Assessing the activities of nRGNs with truncated gRNAs. The S. aureus SaCas9:Sa-gRNA-G complex was introduced into TURQ2 cells together with S. pyogenes complexes formed by SpCas9D10A or Sniper-Cas9D10A loaded with 17-, 18-, 19- or 20-mer gRNAs specific for EGFP and mTurquoise2 sequences. The frequencies of SSBs induced by each of the S. pyogenes nRGNs were established by flow cytometry of mTurquoise2-negative cells. (D) Testing the specificities of nRGNs with truncated gRNAs. The S. aureus SaCas9:Sa-gRNA-G complex was delivered into TURQ2 cells together with S. pyogenes complexes formed by SpCas9D10A or Sniper-Cas9D10A coupled to 18-mer spacer gRNAs specific for EGFP and mTurquoise2 sequences with no mismatches or with a single mismatch (red boxes) to a transgene sequence. PAMs for S. pyogenes and S. aureus Cas9 proteins are highlighted in blue (left panel). S. pyogenes nRGN activities were determined by mTurquoise2-negative cell quantification, with SpCas9D10A showing significantly more tolerance to gRNA–DNA mismatches than Sniper-Cas9D10A as presented in absolute and relative terms (graphs in middle and right panels, respectively). In the middle panel, the data are presented as mean ± S.D. of independent biological replicates (n = 5). Significance between the indicated datasets was calculated with two-tailed Student's t tests. **0.001 < P < 0.01; ***0.0001 < P < 0.001; P ≥ 0.05 was considered non-significant (ns). In the right panel, Box plot of independent biological replicates (n = 5), with significances calculated through two-tailed Student's t tests; *0.01 < P < 0.05. In all experimental settings, gene knockout levels, were determined by flow cytometry of mTurquoise2-negative cells at 10 days post-transfection.
Figure 4. Investigating the integration of high-specificity dual nRGN and truncated gRNA principles. (A) Functional screening of high-specificity dual nRGNs with full-length and truncated gRNAs. EGFP-expressing H27 cells were exposed to dual nRGNs (open bars) containing a full-length gRNA pair (top panel) or expressing dual nRGNs harboring gRNA pairs with a truncated member (bottom panel). As references, H27 cells were exposed to RGNs (solid bars) with the same full-length gRNAs or truncated gRNAs. Results are presented as mean ± S.D. of independent biological replicates (n = 3). Significance between the indicated datasets was calculated using two-tailed Student's t tests. *0.01 < P < 0.05; **0.001< P < 0.01; P≥ 0.05 was considered non-significant (ns). (B) Testing the effect of full-length versus truncated gRNAs on dual nRGN activities. Dual RGN activity ratios obtained by dividing DNA cleavage frequencies induced with gRNA pairs containing a truncated member by those triggered with gRNA pairs with full-length gRNAs (panel A). Data are shown as mean ± S.D. of independent biological replicates (n = 3). Significance between the indicated datasets was calculated by one-way ANOVA followed by Dunnett's test for multiple comparisons; P ≥ 0.05 was considered non-significant (ns). (C) Assessing the activities of nRGNs with truncated gRNAs. The S. aureus SaCas9:Sa-gRNA-G complex was introduced into TURQ2 cells together with S. pyogenes complexes formed by SpCas9D10A or Sniper-Cas9D10A loaded with 17-, 18-, 19- or 20-mer gRNAs specific for EGFP and mTurquoise2 sequences. The frequencies of SSBs induced by each of the S. pyogenes nRGNs were established by flow cytometry of mTurquoise2-negative cells. (D) Testing the specificities of nRGNs with truncated gRNAs. The S. aureus SaCas9:Sa-gRNA-G complex was delivered into TURQ2 cells together with S. pyogenes complexes formed by SpCas9D10A or Sniper-Cas9D10A coupled to 18-mer spacer gRNAs specific for EGFP and mTurquoise2 sequences with no mismatches or with a single mismatch (red boxes) to a transgene sequence. PAMs for S. pyogenes and S. aureus Cas9 proteins are highlighted in blue (left panel). S. pyogenes nRGN activities were determined by mTurquoise2-negative cell quantification, with SpCas9D10A showing significantly more tolerance to gRNA–DNA mismatches than Sniper-Cas9D10A as presented in absolute and relative terms (graphs in middle and right panels, respectively). In the middle panel, the data are presented as mean ± S.D. of independent biological replicates (n = 5). Significance between the indicated datasets was calculated with two-tailed Student's t tests. **0.001 < P < 0.01; ***0.0001 < P < 0.001; P ≥ 0.05 was considered non-significant (ns). In the right panel, Box plot of independent biological replicates (n = 5), with significances calculated through two-tailed Student's t tests; *0.01 < P < 0.05. In all experimental settings, gene knockout levels, were determined by flow cytometry of mTurquoise2-negative cells at 10 days post-transfection.CC BY · PubMed Central
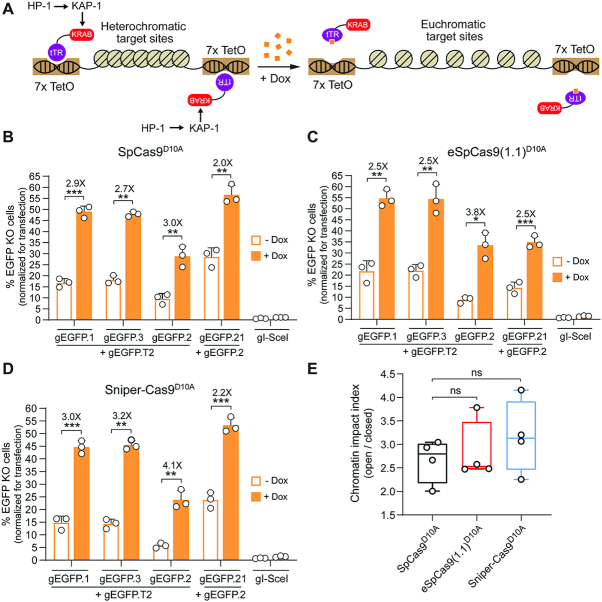
Figure 5. Comparing standard versus high-specificity dual nRGNs at alternate chromatin states. (A) Diagram of the experimental system. Doxycycline (Dox) availability regulates higher-order chromatin conformations that are controlled by KRAB-mediated recruitment of cellular silencing complexes to target sequences. In the absence of Dox, the tTR-KRAB fusion protein binds to TetO elements leading to the nucleation of cellular epigenetic modulators (e.g. KAP1 and HP1) and ensuing formation of compact heterochromatin at EGFP target sequences. In the presence of Dox, tTR-KRAB cannot bind to DNA, resulting in the maintenance of a relaxed euchromatin conformation at the same sequences. HEK.EGFPTetO.KRAB cells treated or not treated with Dox were subjected to the indicated sets of gene-editing reagents that differed through their inclusion of either SpCas9D10A (B), eSpCas9(1.1)D10A (C) or Sniper-Cas9D10A (D). After eliminating gene-editing reagents by sub-culturing and exposing both culture types to Dox, to assure transgene expression, EGFP knockout frequencies were determined by flow cytometry (Supplementary Figure S9A). Data are presented as mean ± S.D. of independent biological replicates (n = 3). Significance between datasets was calculated by two-tailed Student's t tests; *0.01 < P < 0.05; **0.001< P < 0.01; ***0.0001 < P < 0.001. (E) Cumulative chromatin impact indexes. Box plot presenting the chromatin impact indexes obtained by dividing gene knockout mean frequencies determined in the presence and absence of Dox (solid and open bars, respectively) (Figure S9b). Significance between the data points was calculated by one-way ANOVA followed by Dunnett's test for multiple comparisons; P ≥ 0.05 was considered non-significant (ns).
Figure 5. Comparing standard versus high-specificity dual nRGNs at alternate chromatin states. (A) Diagram of the experimental system. Doxycycline (Dox) availability regulates higher-order chromatin conformations that are controlled by KRAB-mediated recruitment of cellular silencing complexes to target sequences. In the absence of Dox, the tTR-KRAB fusion protein binds to TetO elements leading to the nucleation of cellular epigenetic modulators (e.g. KAP1 and HP1) and ensuing formation of compact heterochromatin at EGFP target sequences. In the presence of Dox, tTR-KRAB cannot bind to DNA, resulting in the maintenance of a relaxed euchromatin conformation at the same sequences. HEK.EGFPTetO.KRAB cells treated or not treated with Dox were subjected to the indicated sets of gene-editing reagents that differed through their inclusion of either SpCas9D10A (B), eSpCas9(1.1)D10A (C) or Sniper-Cas9D10A (D). After eliminating gene-editing reagents by sub-culturing and exposing both culture types to Dox, to assure transgene expression, EGFP knockout frequencies were determined by flow cytometry (Supplementary Figure S9A). Data are presented as mean ± S.D. of independent biological replicates (n = 3). Significance between datasets was calculated by two-tailed Student's t tests; *0.01 < P < 0.05; **0.001< P < 0.01; ***0.0001 < P < 0.001. (E) Cumulative chromatin impact indexes. Box plot presenting the chromatin impact indexes obtained by dividing gene knockout mean frequencies determined in the presence and absence of Dox (solid and open bars, respectively) (Figure S9b). Significance between the data points was calculated by one-way ANOVA followed by Dunnett's test for multiple comparisons; P ≥ 0.05 was considered non-significant (ns).CC BY · PubMed Central
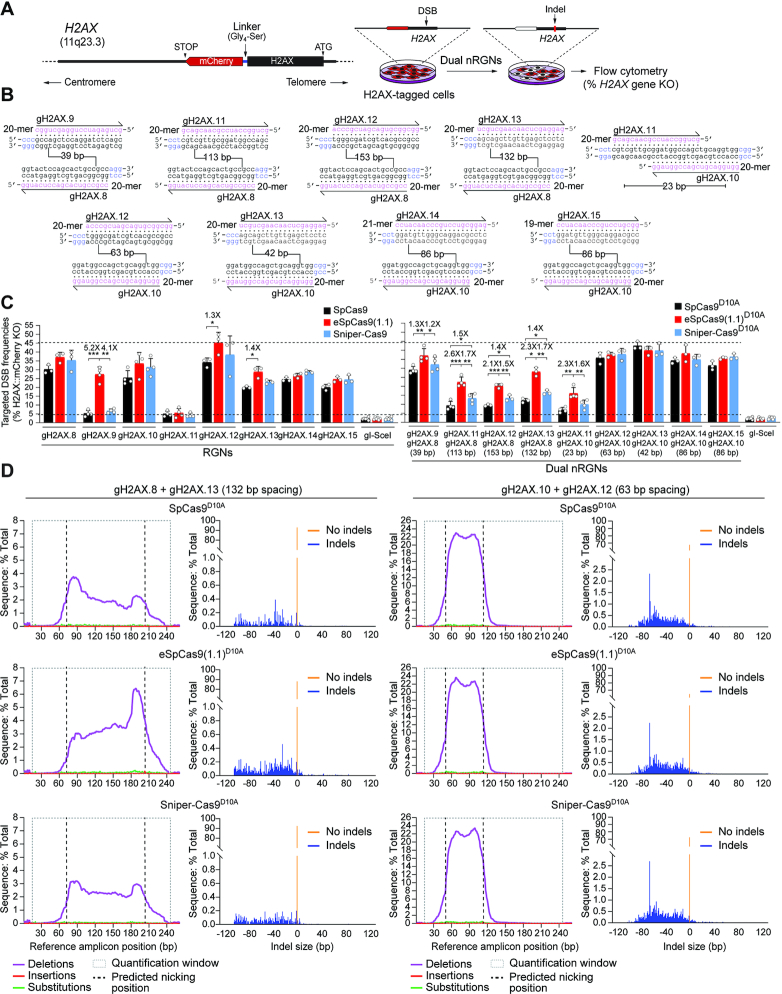
Figure 6. Testing the activity of RGNs and dual nRGNs at human genomic DNA. (A) Schematics of readout system. HeLa cells containing the H2AX gene in-frame with a mCherry reporter are exposed to dual nRGN components. Target DNA cleavage is assessed through flow cytometric quantification of mCherry-negative cells resulting from DSB-induced indels at H2AX sequences. (B) H2AX-targeting gRNAs. The gRNA spacer nucleotides are drawn annealing to the respective target DNA strands. PAM nucleotides are highlighted in blue. Numbers within broken line correspond to the spacing between gRNA pair members using as reference the base pair positions at which nicking occurs. (C) Functional screening of RGNs and dual nRGNs with standard or variant SpCas9 proteins at H2AX. H2AX::mCherry+ HeLa cells were transfected with plasmids expressing the indicated combinations of RGN and dual nRGN elements. DNA cleaving activities were assessed through flow cytometry of mCherry-negative cells at 10 days post-transfection. Dashed lines, corresponding to the lowest and highest DNA cleaving frequencies measured. Data are presented as mean ± S.D. of at least three independent biological replicates. Significance between the indicated datasets was calculated by two-tailed Student's t tests; *0.01 < P < 0.05; **0.001 < P < 0.01; ***0.0001 < P < 0.001. (D) Characterization of dual nRGN ‘footprints’ at H2AX alleles. The types and frequencies of gene modifications within the indicated dual nRGN target sequences were determined at 48 h post-transfection by amplicon deep sequencing of HEK293T cells.
Figure 6. Testing the activity of RGNs and dual nRGNs at human genomic DNA. (A) Schematics of readout system. HeLa cells containing the H2AX gene in-frame with a mCherry reporter are exposed to dual nRGN components. Target DNA cleavage is assessed through flow cytometric quantification of mCherry-negative cells resulting from DSB-induced indels at H2AX sequences. (B) H2AX-targeting gRNAs. The gRNA spacer nucleotides are drawn annealing to the respective target DNA strands. PAM nucleotides are highlighted in blue. Numbers within broken line correspond to the spacing between gRNA pair members using as reference the base pair positions at which nicking occurs. (C) Functional screening of RGNs and dual nRGNs with standard or variant SpCas9 proteins at H2AX. H2AX::mCherry+ HeLa cells were transfected with plasmids expressing the indicated combinations of RGN and dual nRGN elements. DNA cleaving activities were assessed through flow cytometry of mCherry-negative cells at 10 days post-transfection. Dashed lines, corresponding to the lowest and highest DNA cleaving frequencies measured. Data are presented as mean ± S.D. of at least three independent biological replicates. Significance between the indicated datasets was calculated by two-tailed Student's t tests; *0.01 < P < 0.05; **0.001 < P < 0.01; ***0.0001 < P < 0.001. (D) Characterization of dual nRGN ‘footprints’ at H2AX alleles. The types and frequencies of gene modifications within the indicated dual nRGN target sequences were determined at 48 h post-transfection by amplicon deep sequencing of HEK293T cells.CC BY · PubMed Central
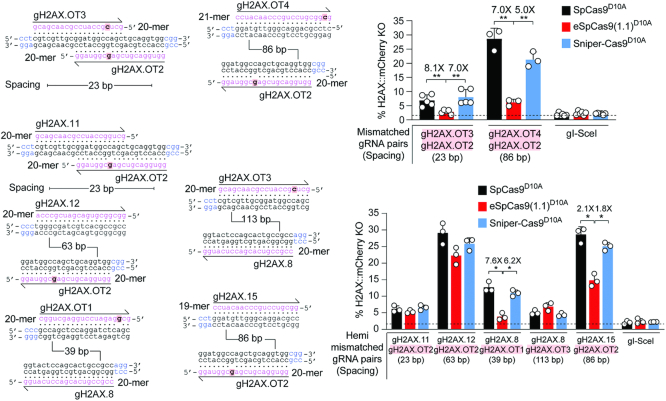
Figure 7. Testing the specificity of dual nRGNs at human genomic DNA. Specificity assay comparing standard and variant dual nRGNs containing gRNAs with mismatches to H2AX in both spacers (mismatched gRNA pairs) or only in one of the two spacers (hemi-mismatched gRNA pairs). H2AX and gRNA spacer sequences are drawn hybridizing to each other with mismatched and PAM nucleotides highlighted in red boxes and blue lettering, respectively. In these assays, the DNA mismatch discriminating power (specificity) of individual dual nRGNs inversely correlates with H2AX gene knockout frequencies. H2AX::mCherry+ HeLa cells were transfected with constructs expressing the denoted dual nRGNs. H2AX gene knockout frequencies were determined by flow cytometry of mCherry-negative cells at 10 days post-transfection. The results are expressed as mean ± S.D. of a minimum of three independent biological replicates. Significance between the indicated datasets was calculated by two-tailed Student's t tests; *0.01 < P < 0.05; **0.001 < P < 0.01.
Figure 7. Testing the specificity of dual nRGNs at human genomic DNA. Specificity assay comparing standard and variant dual nRGNs containing gRNAs with mismatches to H2AX in both spacers (mismatched gRNA pairs) or only in one of the two spacers (hemi-mismatched gRNA pairs). H2AX and gRNA spacer sequences are drawn hybridizing to each other with mismatched and PAM nucleotides highlighted in red boxes and blue lettering, respectively. In these assays, the DNA mismatch discriminating power (specificity) of individual dual nRGNs inversely correlates with H2AX gene knockout frequencies. H2AX::mCherry+ HeLa cells were transfected with constructs expressing the denoted dual nRGNs. H2AX gene knockout frequencies were determined by flow cytometry of mCherry-negative cells at 10 days post-transfection. The results are expressed as mean ± S.D. of a minimum of three independent biological replicates. Significance between the indicated datasets was calculated by two-tailed Student's t tests; *0.01 < P < 0.05; **0.001 < P < 0.01.CC BY · PubMed Central
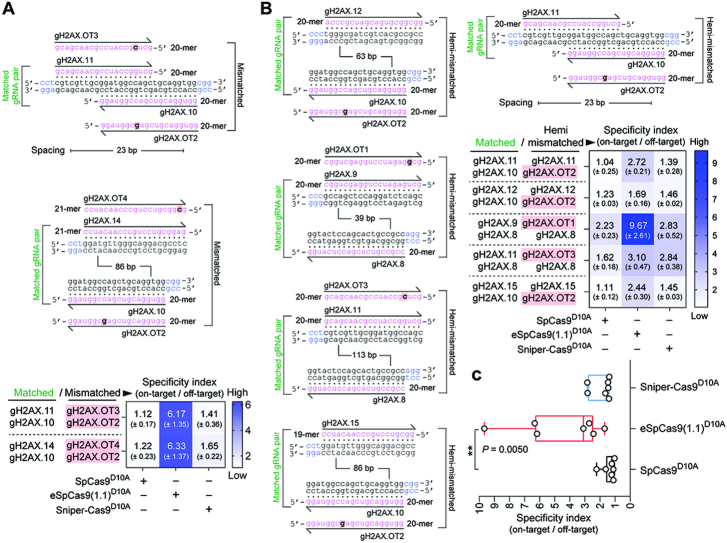
Figure 8. Testing the effect of sequence mismatches on standard and high-specificity dual nRGN activities. (A) Comparing standard versus variant dual nRGNs with DNA-mismatched gRNA pairs. Dual nRGNs based on SpCas9D10A, eSpCas9(1.1)D10A or Sniper-Cas9D10A, coupled to H2AX-matched or mismatched gRNA pairs, were introduced into H2AX::mCherry+ HeLa cells. The heatmap presents dual nRGN specificity indexes (mean ± S.D.) resulting from dividing the gene knockout frequencies induced with H2AX-matched gRNA pairs by those attained with the respective mismatched gRNA pairs. (B) Comparing standard versus variant dual nRGNs with DNA hemi-mismatched gRNA pairs. Dual nRGNs based on SpCas9D10A, eSpCas9(1.1)D10A or Sniper-Cas9D10A, linked to H2AX-matched or hemi-mismatched gRNA pairs, were delivered into H2AX::mCherry+ HeLa cells. The heatmap depicts dual nRGN specificity indexes (mean ± S.D.) derived from dividing the gene knockout frequencies achieved with H2AX-matched gRNA pairs by those attained with the respective hemi-mismatched gRNA pairs. (C) Cumulative specificity indexes. Box plot of the specificity indexes presented in the heatmaps of panels A and B. In all experimental settings, gene knockout levels, corresponding to at least three independent biological replicates, were determined by flow cytometry of mCherry-negative cells at 10 days post-transfection. Significance between datasets was calculated with one-way ANOVA followed by Dunnett's test for multiple comparisons; ** 0.001< P < 0.01.
Figure 8. Testing the effect of sequence mismatches on standard and high-specificity dual nRGN activities. (A) Comparing standard versus variant dual nRGNs with DNA-mismatched gRNA pairs. Dual nRGNs based on SpCas9D10A, eSpCas9(1.1)D10A or Sniper-Cas9D10A, coupled to H2AX-matched or mismatched gRNA pairs, were introduced into H2AX::mCherry+ HeLa cells. The heatmap presents dual nRGN specificity indexes (mean ± S.D.) resulting from dividing the gene knockout frequencies induced with H2AX-matched gRNA pairs by those attained with the respective mismatched gRNA pairs. (B) Comparing standard versus variant dual nRGNs with DNA hemi-mismatched gRNA pairs. Dual nRGNs based on SpCas9D10A, eSpCas9(1.1)D10A or Sniper-Cas9D10A, linked to H2AX-matched or hemi-mismatched gRNA pairs, were delivered into H2AX::mCherry+ HeLa cells. The heatmap depicts dual nRGN specificity indexes (mean ± S.D.) derived from dividing the gene knockout frequencies achieved with H2AX-matched gRNA pairs by those attained with the respective hemi-mismatched gRNA pairs. (C) Cumulative specificity indexes. Box plot of the specificity indexes presented in the heatmaps of panels A and B. In all experimental settings, gene knockout levels, corresponding to at least three independent biological replicates, were determined by flow cytometry of mCherry-negative cells at 10 days post-transfection. Significance between datasets was calculated with one-way ANOVA followed by Dunnett's test for multiple comparisons; ** 0.001< P < 0.01.CC BY · PubMed Central
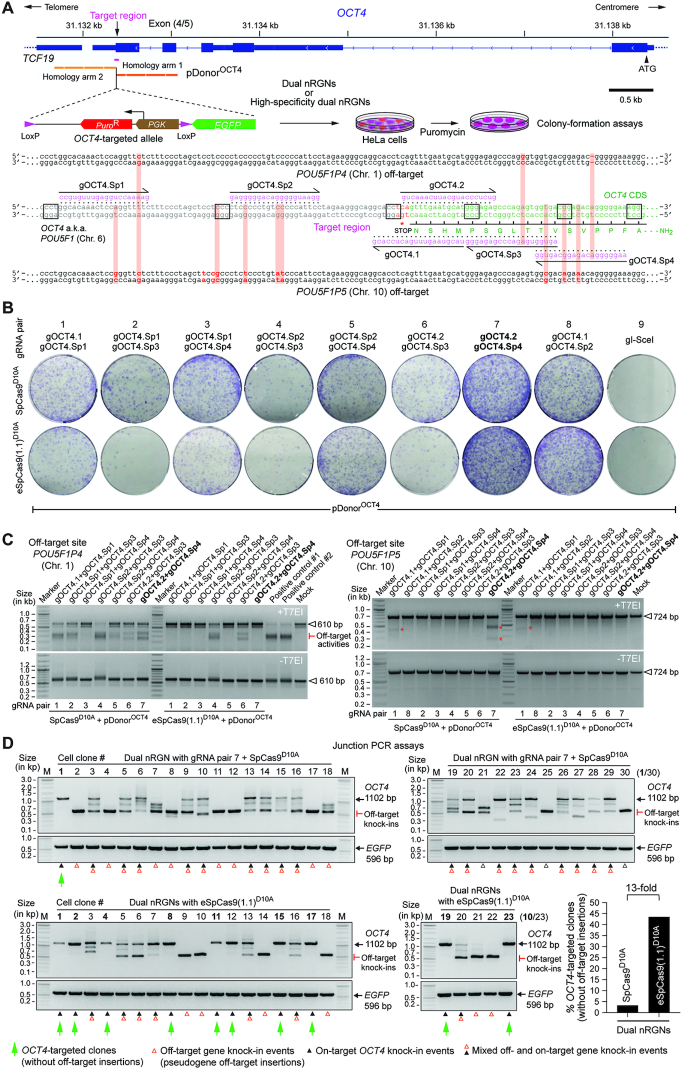
Figure 9. Homology-directed gene targeting of genomic sites sharing high sequence identity with off-target sequences using conventional or high-specificity complexes. (A) OCT4 gene targeting set-up. The OCT4 target region is presented in relation to similar sequences in OCT4 pseudogenes POU5F1P4 and POU5F1P5 located at chromosomes 1 and 10, respectively. HeLa cells were transfected with pDonorOCT4 and plasmids encoding dual nRGNs containing SpCas9 or high-specificity dual nRGNs harboring eSpCas9(1.1)D10A. Donor construct pDonorOCT4 is designed to knock-in into OCT4 the EGFP coding sequence together with a floxed marker gene that confers resistance to puromycin in colony-formation assays. PAM and gRNA sequences are boxed and magenta colored, respectively. DNA-gRNA mismatches are highlighted by vertical red bars. (B) Colony-formation assays on HeLa cells. HeLa cells genetically modified through the delivery of the indicated gene-editing tools are scored after puromycin selection and Giemsa staining. (C) Detection of dual nRGN off-target activities. T7EI-based genotyping assays were performed on DNA from puromycin-resistant HeLa cell populations initially exposed to pDonorOCT4 and the indicated dual nRGN elements. T7EI-specific products diagnostic for mutant POU5F1P4 and POU5F1P5 loci generated by the installation of indels after NHEJ-mediated DSB repair, are labelled as ‘Off-target activities’ and asterisks, respectively. Products representing intact loci are instead marked by open arrowheads. (D) Characterization of HDR-mediated OCT4 gene editing specificity achieved by dual nRGNs containing SpCas9D10A or eSpCas9(1.1)D10A. Junction PCR analysis on genomic DNA from puromycin-resistant HeLa cell clones from cultures treated with pDonorOCT4, SpCas9D10A, gOCT4.2 and gOCT4.Sp4 (n = 30) or with pDonorOCT4, eSpCas9(1.1)D10A, gOCT4.2 and gOCT4.Sp4 (n = 23). For details see Supplementary Figure S12. Lanes M, GeneRuler DNA Ladder Mix molecular weight marker.
Figure 9. Homology-directed gene targeting of genomic sites sharing high sequence identity with off-target sequences using conventional or high-specificity complexes. (A) OCT4 gene targeting set-up. The OCT4 target region is presented in relation to similar sequences in OCT4 pseudogenes POU5F1P4 and POU5F1P5 located at chromosomes 1 and 10, respectively. HeLa cells were transfected with pDonorOCT4 and plasmids encoding dual nRGNs containing SpCas9 or high-specificity dual nRGNs harboring eSpCas9(1.1)D10A. Donor construct pDonorOCT4 is designed to knock-in into OCT4 the EGFP coding sequence together with a floxed marker gene that confers resistance to puromycin in colony-formation assays. PAM and gRNA sequences are boxed and magenta colored, respectively. DNA-gRNA mismatches are highlighted by vertical red bars. (B) Colony-formation assays on HeLa cells. HeLa cells genetically modified through the delivery of the indicated gene-editing tools are scored after puromycin selection and Giemsa staining. (C) Detection of dual nRGN off-target activities. T7EI-based genotyping assays were performed on DNA from puromycin-resistant HeLa cell populations initially exposed to pDonorOCT4 and the indicated dual nRGN elements. T7EI-specific products diagnostic for mutant POU5F1P4 and POU5F1P5 loci generated by the installation of indels after NHEJ-mediated DSB repair, are labelled as ‘Off-target activities’ and asterisks, respectively. Products representing intact loci are instead marked by open arrowheads. (D) Characterization of HDR-mediated OCT4 gene editing specificity achieved by dual nRGNs containing SpCas9D10A or eSpCas9(1.1)D10A. Junction PCR analysis on genomic DNA from puromycin-resistant HeLa cell clones from cultures treated with pDonorOCT4, SpCas9D10A, gOCT4.2 and gOCT4.Sp4 (n = 30) or with pDonorOCT4, eSpCas9(1.1)D10A, gOCT4.2 and gOCT4.Sp4 (n = 23). For details see Supplementary Figure S12. Lanes M, GeneRuler DNA Ladder Mix molecular weight marker.CC BY · PubMed Central
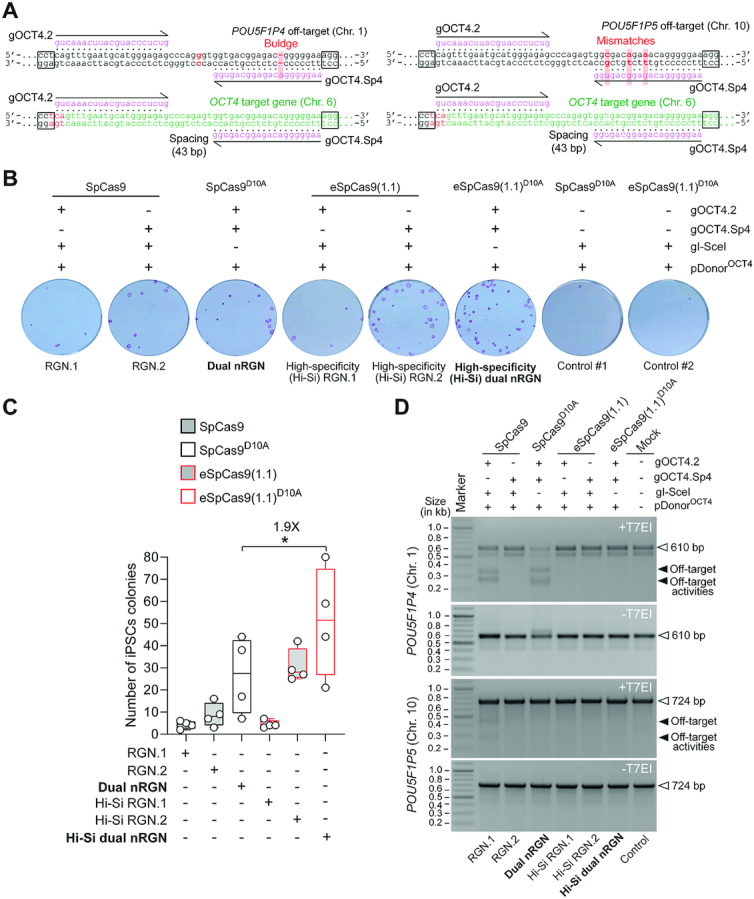
Figure 10. Homology-directed gene targeting in iPSCs at OCT4 sequences highly similar to off-target sites using conventional or high-specificity complexes. (A) RGN and dual nRGN target sites and pseudogene off-target sequences. The OCT4 sequence (green) is depicted next to similar sequences in OCT4 pseudogenes POU5F1P4 and POU5F1P5 (black) located at chromosomes 1 and 10, respectively. PAM and gRNA sequences are boxed and magenta colored, respectively. DNA-gRNA mismatches and a gRNA buldge are highlighted by vertical red bars. (B) Colony-formation assays on iPSCs. iPSCs genetically modified through the transfer of the indicated gene-editing reagents are identified after puromycin selection and staining for the pluripotency marker alkaline phosphatase. (C) Quantification of genetically modified iPSCs. The numbers of alkaline phosphatase-positive iPSC colonies resulting from four independent biological replicates are presented in box plots with minimum and maximum. Significance between the indicated datasets was calculated by two-tailed Student's t tests; *0.01 < P < 0.05 (D) Detection of RGN and dual nRGN off-target activities. T7EI-based genotyping assays were carried out on DNA from puromycin-resistant iPSC populations initially subjected to pDonorOCT4 and the indicated RGN and dual nRGN components. T7EI-specific species diagnostic for mutant POU5F1P4 and POU5F1P5 loci generated by the induction of indels after NHEJ-mediated DSB repair, are marked by solid arrowheads. Products corresponding to intact loci are instead marked by open arrowheads. Marker, GeneRuler DNA Ladder Mix molecular weight marker.
Figure 10. Homology-directed gene targeting in iPSCs at OCT4 sequences highly similar to off-target sites using conventional or high-specificity complexes. (A) RGN and dual nRGN target sites and pseudogene off-target sequences. The OCT4 sequence (green) is depicted next to similar sequences in OCT4 pseudogenes POU5F1P4 and POU5F1P5 (black) located at chromosomes 1 and 10, respectively. PAM and gRNA sequences are boxed and magenta colored, respectively. DNA-gRNA mismatches and a gRNA buldge are highlighted by vertical red bars. (B) Colony-formation assays on iPSCs. iPSCs genetically modified through the transfer of the indicated gene-editing reagents are identified after puromycin selection and staining for the pluripotency marker alkaline phosphatase. (C) Quantification of genetically modified iPSCs. The numbers of alkaline phosphatase-positive iPSC colonies resulting from four independent biological replicates are presented in box plots with minimum and maximum. Significance between the indicated datasets was calculated by two-tailed Student's t tests; *0.01 < P < 0.05 (D) Detection of RGN and dual nRGN off-target activities. T7EI-based genotyping assays were carried out on DNA from puromycin-resistant iPSC populations initially subjected to pDonorOCT4 and the indicated RGN and dual nRGN components. T7EI-specific species diagnostic for mutant POU5F1P4 and POU5F1P5 loci generated by the induction of indels after NHEJ-mediated DSB repair, are marked by solid arrowheads. Products corresponding to intact loci are instead marked by open arrowheads. Marker, GeneRuler DNA Ladder Mix molecular weight marker.CC BY · PubMed Central
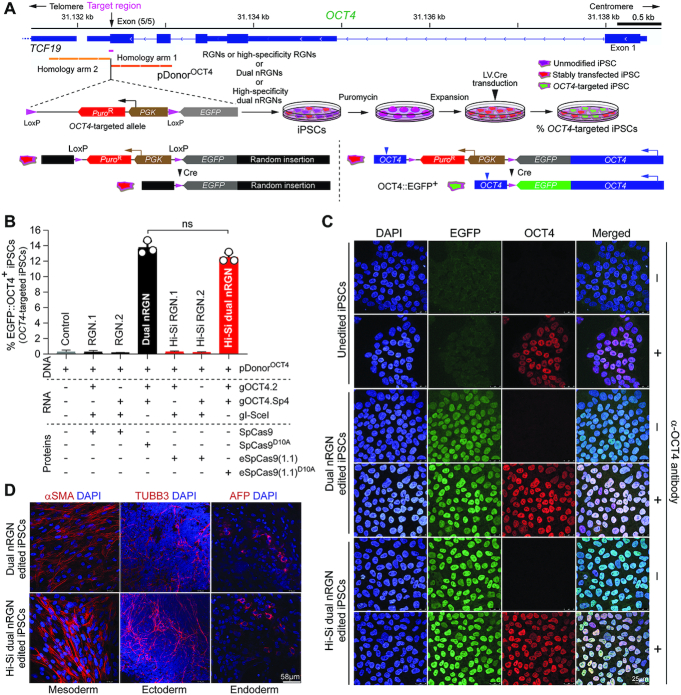
Figure 11. Quantification and characterization of OCT4 targeted iPSCs by standard versus high-specificity RGNs and dual nRGNs. (A) Experimental set-up and genetic assay for detecting OCT4 gene targeting events. iPSCs were transfected with pDonorOCT4 and constructs expressing RGNs containing SpCas9 or eSpCas9(1.1) or high-specificity dual nRGNs harbouring SpCas9D10A or eSpCas9(1.1)D10A. pDonorOCT4 knock-ins into OCT4 the EGFP coding sequence and a floxed marker gene conferring puromycin resistance. Functional genetic assays, The Cre-mediated selectable marker removal and OCT4::EGFP fusion product assembly reports precisely targeted iPSCs. Stable OCT4::EGFP expression arises from OCT4 transcription initiation and termination regulatory elements. (B) Quantification of OCT4 targeted iPSCs. The frequencies of OCT4::EGFP+ iPSCs in puromycin resistant populations were determined by EGFP-directed flow cytometry. Data are shown as mean ± S.D. of three independent biological replicates. Significance between the indicated datasets was calculated through two-tailed Student's t test with P ≥ 0.05 considered non-significant (ns). (C) Confocal fluorescence microscopy analysis of OCT4 edited iPSCs. OCT4::EGFP+ iPSCs edited by dual nRGNs with SpCas9D10A or by high-specificity dual nRGNs with eSpCas9(1.1)D10A, were subjected to indirect and direct fluorescence microscopies for detecting OCT4 and EGFP, respectively. Nuclei were identified by DAPI staining. Parental, unedited, iPSCs served as negative controls. Unedited and edited iPSC populations that were not incubated with the OCT4-specific primary antibody provided for staining controls. (D) Testing the multilineage differentiation potential of OCT4 edited iPSCs. OCT4::EGFP+ iPSCs edited by dual nRGNs with SpCas9D10A or by high-specificity dual nRGNs with eSpCas9(1.1)D10A were induced to differentiate into cell lineages corresponding to the three embryonic germ layers, i.e. mesoderm, ectoderm and endoderm. Markers for each of these germ layers are indicated. Nuclei were stained with DAPI.
Figure 11. Quantification and characterization of OCT4 targeted iPSCs by standard versus high-specificity RGNs and dual nRGNs. (A) Experimental set-up and genetic assay for detecting OCT4 gene targeting events. iPSCs were transfected with pDonorOCT4 and constructs expressing RGNs containing SpCas9 or eSpCas9(1.1) or high-specificity dual nRGNs harbouring SpCas9D10A or eSpCas9(1.1)D10A. pDonorOCT4 knock-ins into OCT4 the EGFP coding sequence and a floxed marker gene conferring puromycin resistance. Functional genetic assays, The Cre-mediated selectable marker removal and OCT4::EGFP fusion product assembly reports precisely targeted iPSCs. Stable OCT4::EGFP expression arises from OCT4 transcription initiation and termination regulatory elements. (B) Quantification of OCT4 targeted iPSCs. The frequencies of OCT4::EGFP+ iPSCs in puromycin resistant populations were determined by EGFP-directed flow cytometry. Data are shown as mean ± S.D. of three independent biological replicates. Significance between the indicated datasets was calculated through two-tailed Student's t test with P ≥ 0.05 considered non-significant (ns). (C) Confocal fluorescence microscopy analysis of OCT4 edited iPSCs. OCT4::EGFP+ iPSCs edited by dual nRGNs with SpCas9D10A or by high-specificity dual nRGNs with eSpCas9(1.1)D10A, were subjected to indirect and direct fluorescence microscopies for detecting OCT4 and EGFP, respectively. Nuclei were identified by DAPI staining. Parental, unedited, iPSCs served as negative controls. Unedited and edited iPSC populations that were not incubated with the OCT4-specific primary antibody provided for staining controls. (D) Testing the multilineage differentiation potential of OCT4 edited iPSCs. OCT4::EGFP+ iPSCs edited by dual nRGNs with SpCas9D10A or by high-specificity dual nRGNs with eSpCas9(1.1)D10A were induced to differentiate into cell lineages corresponding to the three embryonic germ layers, i.e. mesoderm, ectoderm and endoderm. Markers for each of these germ layers are indicated. Nuclei were stained with DAPI.CC BY · PubMed Central
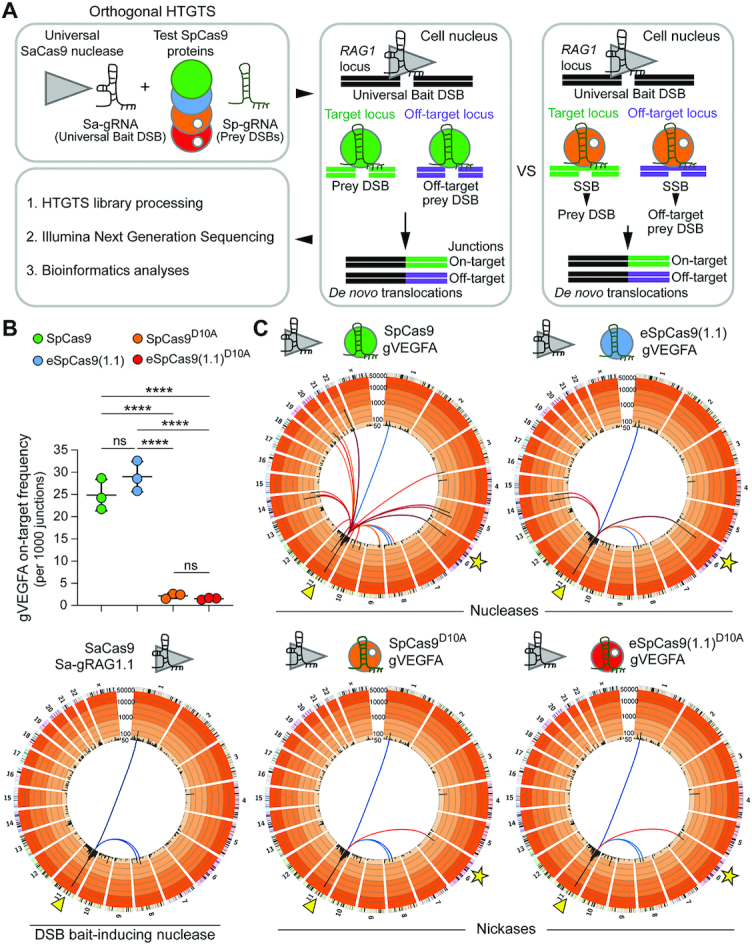
Figure 12. Investigating the specificity of cleaving and nicking RGNs by unbiased genome-wide orthogonal HTGTS analyses. (A) Schematics of the orthogonal HTGTS pipeline for genome-wide assessments of off-target effects induced by RGNs versus nRGNs. A universal S. aureus cleaving RGN complex (SaCas9:Sa-gRAG1.1) is used to generate bait DSBs at RAG1; cleaving and nicking test RGN complexes induce DSBs and SSBs, respectively, at target and off-target loci. Prey DSBs catalyzed by S. pyogenes nucleases and prey DSBs generated from SSBs catalyzed by S. pyogenes nickases, are measured through deep sequencing of translocation junctions involving bait and prey chromosomal termini. (B) On-target DSB frequencies. Number of translocations to the VEGFA target locus per 1000 junctions induced by nucleases SpCas9:gVEGFA and eSpCas9(1.1):gVEGFA or by nickases SpCas9D10A:gVEGFA and eSpCas9(1.1)D10A:gVEGFA. HEK293T cells were transfected with constructs expressing the indicated RGNs and nRGNs (n = 3 biological replicates). At 2 days post-transfection, orthogonal HTGTS analyses were carried out on genomic DNA previously screened by target-site genotyping assays (Supplementary Figure S13B). ****P< 0.0001 one-way ANOVA and Tukey's multiple pairwise-comparisons. (C) Cumulative orthogonal HTGTS analyses from three biological replicates. Each library was normalized to 11932 junctions. Arrowheads in Circos plots mark the location of the bait DSB on chromosome 11 induced by the universal S. aureus RGN for all sequence read libraries; stars in Circos plots mark the VEGFA target site of test S. pyogenes RGNs and test S. pyogenes nRGNs on chromosome 6. Blue-graded lines connected to the RAG1 locus indicate bait nuclease-related off-targets; red-graded lines linked to the RAG1 locus indicate on-target (star) and off-targets resulting from RGNs and nRGNs containing the promiscuous gRNA gVEGFA. Black bars correspond to 5 Mb bins across each chromosome with enrichment levels presented on a custom color-coded log scale by order of magnitude. Hotspots are established when significantly enriched translocation sites are present in at least two out of three replicates (MACS2; q-value cutoff –10–10).
Figure 12. Investigating the specificity of cleaving and nicking RGNs by unbiased genome-wide orthogonal HTGTS analyses. (A) Schematics of the orthogonal HTGTS pipeline for genome-wide assessments of off-target effects induced by RGNs versus nRGNs. A universal S. aureus cleaving RGN complex (SaCas9:Sa-gRAG1.1) is used to generate bait DSBs at RAG1; cleaving and nicking test RGN complexes induce DSBs and SSBs, respectively, at target and off-target loci. Prey DSBs catalyzed by S. pyogenes nucleases and prey DSBs generated from SSBs catalyzed by S. pyogenes nickases, are measured through deep sequencing of translocation junctions involving bait and prey chromosomal termini. (B) On-target DSB frequencies. Number of translocations to the VEGFA target locus per 1000 junctions induced by nucleases SpCas9:gVEGFA and eSpCas9(1.1):gVEGFA or by nickases SpCas9D10A:gVEGFA and eSpCas9(1.1)D10A:gVEGFA. HEK293T cells were transfected with constructs expressing the indicated RGNs and nRGNs (n = 3 biological replicates). At 2 days post-transfection, orthogonal HTGTS analyses were carried out on genomic DNA previously screened by target-site genotyping assays (Supplementary Figure S13B). ****P< 0.0001 one-way ANOVA and Tukey's multiple pairwise-comparisons. (C) Cumulative orthogonal HTGTS analyses from three biological replicates. Each library was normalized to 11932 junctions. Arrowheads in Circos plots mark the location of the bait DSB on chromosome 11 induced by the universal S. aureus RGN for all sequence read libraries; stars in Circos plots mark the VEGFA target site of test S. pyogenes RGNs and test S. pyogenes nRGNs on chromosome 6. Blue-graded lines connected to the RAG1 locus indicate bait nuclease-related off-targets; red-graded lines linked to the RAG1 locus indicate on-target (star) and off-targets resulting from RGNs and nRGNs containing the promiscuous gRNA gVEGFA. Black bars correspond to 5 Mb bins across each chromosome with enrichment levels presented on a custom color-coded log scale by order of magnitude. Hotspots are established when significantly enriched translocation sites are present in at least two out of three replicates (MACS2; q-value cutoff –10–10).CC BY · PubMed Central
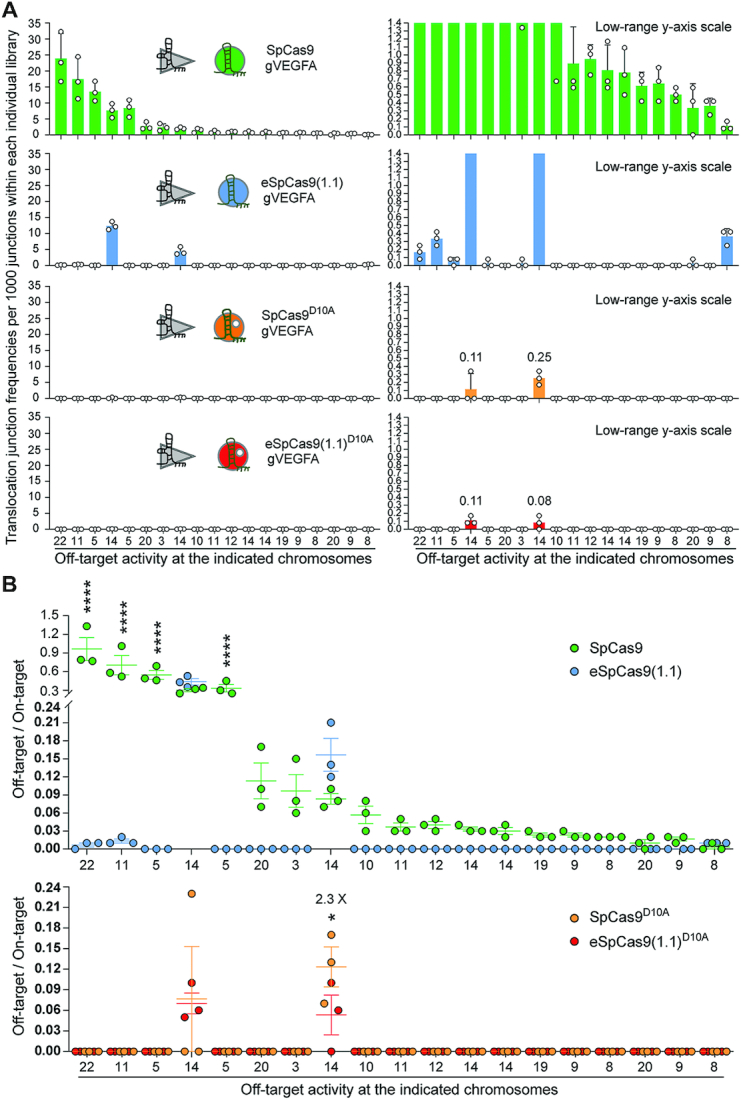
Figure 13. Ranking the off-target sites of RGNs and nRGNs containing a promiscuous gRNA. (A) Distribution and frequencies of gVEGFA off-target sites across the human genome. Translocation junction frequencies associated with each of the detected off-target sites plotted with a broad and narrow Y-axis value ranges (left and right panels, respectively). Off-targets were ranked according to their frequencies in sequence read libraries corresponding to SpCas9:gVEGFA complexes. The chromosomes in which each of the off-target sites map are shown. Chromosome coordinates of detected off-target sites and frequencies of translocation junctions per 1000 junctions within each individual library are specified in Supplementary Figure S14. (B) Activity indices at the various off-target hotspots. Hotspots are defined as translocation enriched sites found significant in at least 2 out of 3 normalized libraries for each CRISPR complex (MACS2; q-value cutoff –10–10). Ratios between the number of translocations to an off-target site and the number of translocations to the on-target site at VEGFA in libraries normalized to 11932 junctions; asterisks mark statistically significant differences in off-target activity indices in normalized libraries (MACS2; q-value cutoff -10-10). *P = 0.0217; ****P< 0.0001 two-way ANOVA and Holm–Sidak's multiple comparison tests. Error bars correspond to mean and SEM from three independent biological replicates.
Figure 13. Ranking the off-target sites of RGNs and nRGNs containing a promiscuous gRNA. (A) Distribution and frequencies of gVEGFA off-target sites across the human genome. Translocation junction frequencies associated with each of the detected off-target sites plotted with a broad and narrow Y-axis value ranges (left and right panels, respectively). Off-targets were ranked according to their frequencies in sequence read libraries corresponding to SpCas9:gVEGFA complexes. The chromosomes in which each of the off-target sites map are shown. Chromosome coordinates of detected off-target sites and frequencies of translocation junctions per 1000 junctions within each individual library are specified in Supplementary Figure S14. (B) Activity indices at the various off-target hotspots. Hotspots are defined as translocation enriched sites found significant in at least 2 out of 3 normalized libraries for each CRISPR complex (MACS2; q-value cutoff –10–10). Ratios between the number of translocations to an off-target site and the number of translocations to the on-target site at VEGFA in libraries normalized to 11932 junctions; asterisks mark statistically significant differences in off-target activity indices in normalized libraries (MACS2; q-value cutoff -10-10). *P = 0.0217; ****P< 0.0001 two-way ANOVA and Holm–Sidak's multiple comparison tests. Error bars correspond to mean and SEM from three independent biological replicates.CC BY · PubMed Central

Verification

Claims the paper makes

The claims and statistics of this paper haven’t been checked yet.

Run the check — free, no account needed. It reads the open-access text and checks the sources it cites.

A few free checks a day · papers already verified open instantly · results are public

Claims other papers make about this one

Each is checked against this paper’s own text: does it say what the citing paper says it does?

Self-check

Percentages, sums and reported differences re-computed from the paper’s own numbers.

The self-check needs the paper’s full text.

Citations

Cites

Research works printed but not linked: 50

  1. Jiang, 2017, CRISPR–Cas9 structures and mechanisms, Annu. Rev. Biophys., 46, 505, 10.1146/annurev-biophys-062215-010822 · DOI · Paper page
  2. Anders, 2014, Structural basis of PAM-dependent target DNA recognition by the Cas9 endonuclease, Nature, 513, 569, 10.1038/nature13579 · DOI · Paper page
  3. Jinek, 2012, A programmable dual-RNA-guided DNA endonuclease in adaptive bacterial immunity, Science, 337, 816, 10.1126/science.1225829 · DOI · Paper page
  4. Ran, 2015, In vivo genome editing using Staphylococcus aureus Cas9, Nature, 520, 186, 10.1038/nature14299 · DOI · Paper page
  5. Chandrasegaran, 2016, Origins of programmable nucleases for genome engineering, J. Mol. Biol., 428, 963, 10.1016/j.jmb.2015.10.014 · DOI
  6. Cradick, 2013, CRISPR/Cas9 systems targeting beta-globin and CCR5 genes have substantial off-target activity, Nucleic Acids Res., 41, 9584, 10.1093/nar/gkt714 · DOI · Paper page
  7. Fu, 2013, High-frequency off-target mutagenesis induced by CRISPR-Cas nucleases in human cells, Nat. Biotechnol., 31, 822, 10.1038/nbt.2623 · DOI · Paper page
  8. Hsu, 2013, DNA targeting specificity of RNA-guided Cas9 nucleases, Nat. Biotechnol., 31, 827, 10.1038/nbt.2647 · DOI · Paper page
  9. Cho, 2014, Analysis of off-target effects of CRISPR/Cas-derived RNA-guided endonucleases and nickases, Genome Res., 24, 132, 10.1101/gr.162339.113 · DOI · Paper page
  10. Lin, 2014, CRISPR/Cas9 systems have off-target activity with insertions or deletions between target DNA and guide RNA sequences, Nucleic Acids Res., 42, 7473, 10.1093/nar/gku402 · DOI · Paper page
  11. Zhang, 2014, Comparison of non-canonical PAMs for CRISPR/Cas9-mediated DNA cleavage in human cells, Sci. Rep., 4, 5405, 10.1038/srep05405 · DOI
  12. Chen, 2020, Expanding the editable genome and CRISPR–Cas9 versatility using DNA cutting-free gene targeting based on in trans paired nicking, Nucleic Acids Res., 48, 974, 10.1093/nar/gkz1121 · DOI
  13. Chen, 2018, DNA, RNA, and protein tools for editing the genetic information in human cells, iScience, 6, 247, 10.1016/j.isci.2018.08.001 · DOI
  14. Cong, 2013, Multiplex genome engineering using CRISPR/Cas systems, Science, 339, 819, 10.1126/science.1231143 · DOI · Paper page
  15. Mali, 2013, RNA-guided human genome engineering via Cas9, Science, 339, 823, 10.1126/science.1232033 · DOI · Paper page
  16. Ran, 2013, Double nicking by RNA-guided CRISPR Cas9 for enhanced genome editing specificity, Cell, 154, 1380, 10.1016/j.cell.2013.08.021 · DOI · Paper page
  17. Caldecott, 2014, DNA single-strand break repair, Exp. Cell Res., 329, 2, 10.1016/j.yexcr.2014.08.027 · DOI
  18. Vriend, 2017, Nick-initiated homologous recombination: protecting the genome, one strand at a time, DNA Repair (Amst), 50, 1, 10.1016/j.dnarep.2016.12.005 · DOI
  19. Gopalappa, 2018, Paired D10A Cas9 nickases are sometimes more efficient than individual nucleases for gene disruption, Nucleic Acids Res., 46, e71, 10.1093/nar/gky222 · DOI
  20. Lee, 2018, Directed evolution of CRISPR–Cas9 to increase its specificity, Nat. Commun., 9, 3048, 10.1038/s41467-018-05477-x · DOI · Paper page
  21. Chen, 2017, In trans paired nicking triggers seamless genome editing without double-stranded DNA cutting, Nat. Commun., 8, 657, 10.1038/s41467-017-00687-1 · DOI
  22. Gonçalves, 2004, Stable transduction of large DNA by high-capacity adeno-associated virus/adenovirus hybrid vectors, Virology, 321, 287, 10.1016/j.virol.2004.01.007 · DOI
  23. Chen, 2016, Probing the impact of chromatin conformation on genome editing tools, Nucleic Acids Res., 44, 6482, 10.1093/nar/gkw524 · DOI
  24. Chen, 2017, The chromatin structure differentially impacts high-specificity CRISPR–Cas9 nuclease strategies, Mol. Ther. Nucleic Acids, 8, 558, 10.1016/j.omtn.2017.08.005 · DOI
  25. Maggio, 2020, Integrating gene delivery and gene-editing technologies by adenoviral vector transfer of optimized CRISPR–Cas9 components, Gene Ther., 27, 209, 10.1038/s41434-019-0119-y · DOI
  26. Hu, 2016, Detecting DNA double-stranded breaks in mammalian genomes by linear amplification-mediated high-throughput genome-wide translocation sequencing, Nat. Protoc., 11, 853, 10.1038/nprot.2016.043 · DOI
  27. Clement, 2019, CRISPResso2 provides accurate and rapid genome editing sequence analysis, Nat. Biotechnol., 37, 224, 10.1038/s41587-019-0032-3 · DOI
  28. Goedhart, 2012, Structure-guided evolution of cyan fluorescent proteins towards a quantum yield of 93%, Nat. Commun., 3, 751, 10.1038/ncomms1738 · DOI
  29. Kulcsar, 2017, Crossing enhanced and high fidelity SpCas9 nucleases to optimize specificity and cleavage, Genome Biol., 18, 190, 10.1186/s13059-017-1318-8 · DOI
  30. Kim, 2017, Rescue of high-specificity Cas9 variants using sgRNAs with matched 5′ nucleotides, Genome Biol., 18, 218, 10.1186/s13059-017-1355-3 · DOI
  31. Zhang, 2017, Perfectly matched 20-nucleotide guide RNA sequences enable robust genome editing using high-fidelity SpCas9 nucleases, Genome Biol., 18, 191, 10.1186/s13059-017-1325-9 · DOI
  32. Shen, 2014, Efficient genome modification by CRISPR–Cas9 nickase with minimal off-target effects, Nat. Methods, 11, 399, 10.1038/nmeth.2857 · DOI · Paper page
  33. Takahashi, 2007, Induction of pluripotent stem cells from adult human fibroblasts by defined factors, Cell, 131, 861, 10.1016/j.cell.2007.11.019 · DOI · Paper page
  34. Liu, 2014, Stem cells: balancing resistance and sensitivity to DNA damage, Trends Cell Biol., 24, 268, 10.1016/j.tcb.2014.03.002 · DOI
  35. Ihry, 2018, p53 inhibits CRISPR–Cas9 engineering in human pluripotent stem cells, Nat. Med., 24, 939, 10.1038/s41591-018-0050-6 · DOI · Paper page
  36. Haapaniemi, 2018, CRISPR–Cas9 genome editing induces a p53-mediated DNA damage response, Nat. Med., 24, 927, 10.1038/s41591-018-0049-z · DOI · Paper page
  37. Hockemeyer, 2011, Genetic engineering of human pluripotent cells using TALE nucleases, Nat. Biotechnol., 29, 731, 10.1038/nbt.1927 · DOI
  38. Zhu, 2015, A CRISPR/Cas-mediated selection-free knockin strategy in human embryonic stem cells, Stem Cell Rep., 4, 1103, 10.1016/j.stemcr.2015.04.016 · DOI
  39. Kuzminov, 2001, Single-strand interruptions in replicating chromosomes cause double-strand breaks, Proc. Natl. Acad. Sci. U.S.A., 98, 8241, 10.1073/pnas.131009198 · DOI
  40. Brunet, 2018, Induction of chromosomal translocations with CRISPR–Cas9 and other nucleases: understanding the repair mechanisms that give rise to translocations, Adv. Exp. Med. Biol., 1044, 15, 10.1007/978-981-13-0593-1_2 · DOI
  41. Maggio, 2015, Genome editing at the crossroads of delivery, specificity, and fidelity, Trends. Biotechnol., 33, 280, 10.1016/j.tibtech.2015.02.011 · DOI
  42. Chen, 2016, Engineered viruses as genome editing devices, Mol. Ther., 24, 447, 10.1038/mt.2015.164 · DOI
  43. Kim, 2018, Genetic disease risks can be misestimated across global populations, Genome Biol., 19, 179, 10.1186/s13059-018-1561-7 · DOI · Paper page
  44. Tam, 2019, Benefits and limitations of genome-wide association studies, Nat. Rev. Genet., 20, 467, 10.1038/s41576-019-0127-1 · DOI
  45. Lessard, 2017, Human genetic variation alters CRISPR–Cas9 on- and off-targeting specificity at therapeutically implicated loci, Proc. Natl. Acad. Sci. U.S.A., 114, E11257, 10.1073/pnas.1714640114 · DOI
  46. Nakajima, 2018, Precise and efficient nucleotide substitution near genomic nick via noncanonical homology-directed repair, Genome Res., 28, 223, 10.1101/gr.226027.117 · DOI
  47. Hyodo, 2020, Tandem paired nicking promotes precise genome editing with scarce interference by p53, Cell Rep., 30, 1195, 10.1016/j.celrep.2019.12.064 · DOI
  48. Komor, 2016, Programmable editing of a target base in genomic DNA without double-stranded DNA cleavage, Nature, 533, 420, 10.1038/nature17946 · DOI · Paper page
  49. Gaudelli, 2017, Programmable base editing of A*T to G*C in genomic DNA without DNA cleavage, Nature, 551, 464, 10.1038/nature24644 · DOI · Paper page
  50. Anzalone, 2019, Search-and-replace genome editing without double-strand breaks or donor DNA, Nature, 576, 149, 10.1038/s41586-019-1711-4 · DOI · Paper page

Cited by

Sorted by citations

See all 41

Metadata

Authors
Wang, Q., Liu, J., Janssen, J. M., Le Bouteiller, M., Frock, R. L., & Gonçalves, M. A. F. V.
Affiliations
  • Department of Cell and Chemical Biology, Leiden University Medical Center, Einthovenweg 20, 2333 ZC Leiden, The Netherlands
  • Department of Radiation Oncology, Division of Radiation and Cancer Biology, Stanford University School of Medicine, 269 Campus Dr. Stanford, CA 94305, USA
Venue
Nucleic Acids Research
Published
2021-01-04
Volume
49
Issue
2
Pages
1173-1198
ISSN
  • 0305-1048
  • 1362-4962
Cited by
41
References
12
Language
en
Funders
  • Prinses Beatrix Spierfonds (W.OR16-13)
  • Dutch Duchenne (17.012)

About these checks

Registry, retraction, Cites and statistics results are computed, not judged, with one exception: a printed reference that no index lists is read once by a model before it counts as a citation error. Claims are extracted by a model and kept only when their quote appears verbatim in the text; each cited source is then checked, with a model’s help, for whether it says what the claim relies on. Those verdicts can be wrong — read the claim’s quote and the cited source before relying on one.

Statistics and arithmetic are recomputed, not judged.

Confidence bands are shown only for fields calibrated on our annotated test set. None is calibrated yet, so no band is shown.

What counts as a claim ›How we measure confidence ›How we check this ›

Are you an author, or do you see a problem with this page? Request a review