

The DOI matches its Crossref record; 66 of the 66 references it cites were found in a registry or an index.
Neuron-specific ELAV/Hu proteins suppress HuR mRNA during neuronal differentiation by alternative polyadenylation
Open accessAbstract
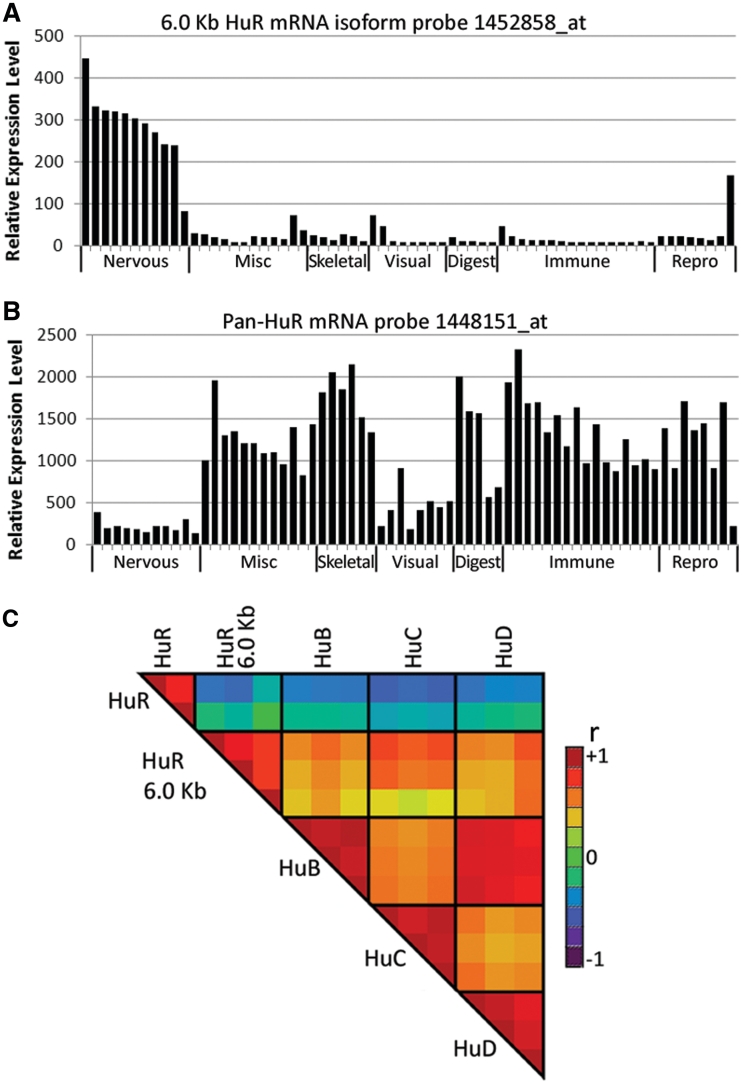
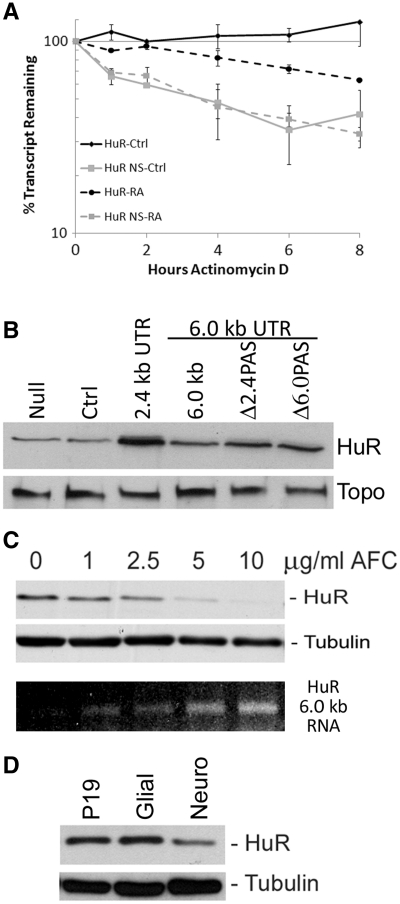
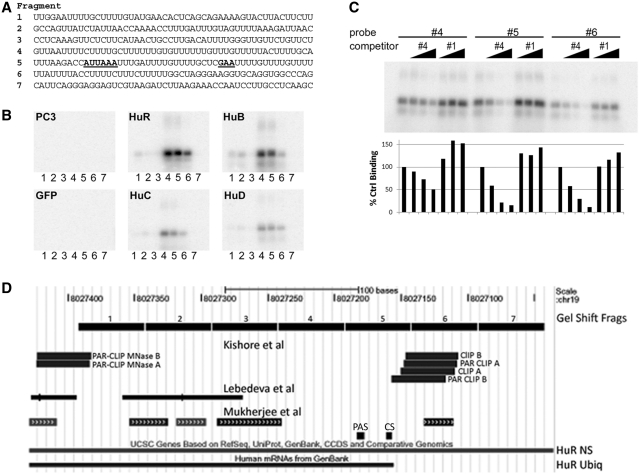
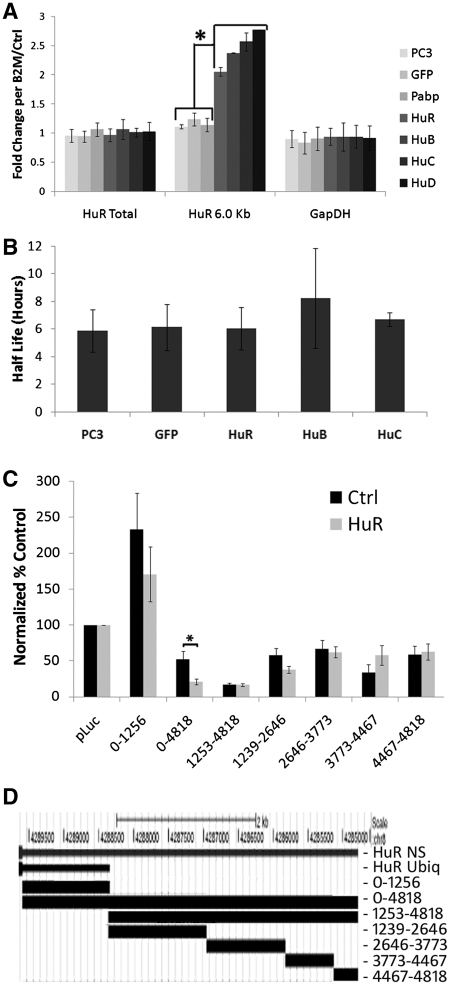
The ubiquitously expressed RNA-binding protein HuR increases the stability and translation of mRNAs encoding growth regulatory proteins that promote proliferation in a variety of cell types. However, the three neuron-specific ELAV/Hu proteins, HuB, HuC and HuD, while binding to the same types of mRNAs, are required instead for neuronal differentiation, and it becomes difficult to reconcile these contrary functions when all four Hu proteins are expressed in the same neuron. HuR mRNA exists as three alternatively polyadenylated variants, a 1.5-kb testes-specific mRNA isoform, a ubiquitous 2.4-kb isoform and a 6.0-kb isoform that we now show is induced during neuronal differentiation and appears to be neuron-specific. This 6.0-kb neuron-specific mRNA isoform is inherently less stable and produces less HuR protein than the ubiquitous 2.4-kb mRNA. Furthermore, we show that neuronal HuB, HuC and HuD, as well as HuR itself, can bind at the 2.4-kb mRNA polyadenylation site, and when overexpressed can affect alternative polyadenylation to generate an extended HuR 3'-UTR that is translationally suppressed. We propose that the regulation of HuR protein expression by alternative polyadenylation allows neurons to post-transcriptionally regulate mRNAs-encoding factors required for proliferation versus differentiation to facilitate neuronal differentiation.
Overview
The claims and statistics of this paper haven’t been checked yet.
Run the check — free, no account needed. It reads the open-access text and checks the sources it cites.
Integrity signals
Registry
Cites
Statistics
Figures
Verification
Claims the paper makes
The claims and statistics of this paper haven’t been checked yet.
Run the check — free, no account needed. It reads the open-access text and checks the sources it cites.
Claims other papers make about this one
Each is checked against this paper’s own text: does it say what the citing paper says it does?
The source backs part of the claim, not all of it — or backs it for a different population, condition or comparison.
In the citing paper
“All four Hu members were found to bind and block U-rich sequences near the 2.4-kb polyadenylation site and thereby promote expression of the 6.0-kb transcript.”
From Emerging complexity of the HuD/ELAVl4 gene; implications for neuronal development, function, and dysfunction (2013) · cites this paper as Mansfield and Keene 2011
Experimental — accuracy not yet measuredThe source backs part of the claim, not all of it — or backs it for a different population, condition or comparison.
In the citing paper
“Moreover, all four Hu proteins were recently demonstrated to differentially regulate alternative polyadenylation of HuR in neurons (Mansfield and Keene 2011; also see Dai et al. 2012).”
From Emerging complexity of the HuD/ELAVl4 gene; implications for neuronal development, function, and dysfunction (2013) · cites this paper as Mansfield and Keene 2011
Experimental — accuracy not yet measuredThe cited source says what the claim attributes to it.
In the citing paper
“Mansfield and Keene showed that there are three different HuR mRNA polyadenylation variants (1.5, 2.4, and 6.0 kb), which differ in 3′ UTR length.”
From Emerging complexity of the HuD/ELAVl4 gene; implications for neuronal development, function, and dysfunction (2013) · cites this paper as Mansfield and Keene 2011
The cited source says what the claim attributes to it.
In the citing paper
“Since the 6.0-kb variant is less stable and not as efficiently translated as the 2.4-kb transcript, the authors postulated that the reduction of HuR expression prevents HuR’s ability to promote proliferation and thereby permits neurons to terminally differentiate (Mansfield and Keene 2011).”
From Emerging complexity of the HuD/ELAVl4 gene; implications for neuronal development, function, and dysfunction (2013) · cites this paper as Mansfield and Keene 2011
Self-check
Percentages, sums and reported differences re-computed from the paper’s own numbers.
The self-check needs the paper’s full text.
Citations
Cites
BioGPS: an extensible and customizable portal for querying and organizing gene annotation resources
Wu, C., Orozco, C., Boyer, J., Leglise, M., Goodale, J., Batalov, S., Hodge, C. L., Haase, J., Janes, J. O., Huss, J. W., et al. (2009) · Genome biology · doi:10.1186/gb-2009-10-11-r130 · Cited by 1,392
An extensive network of coupling among gene expression machines
Maniatis, T., & Reed, R. (2002) · Nature · doi:10.1038/416499a · Cited by 1,148
Brennan, C. M., & Steitz*, J. A. (2001) · Cellular and Molecular Life Sciences · doi:10.1007/pl00000854 · Cited by 1,095
A large-scale analysis of mRNA polyadenylation of human and mouse genes
Tian, B. (2005) · Nucleic Acids Research · doi:10.1093/nar/gki158 · Cited by 970
RNA stabilization by the AU‐rich element binding protein, HuR, an ELAV protein
Peng, S., Chen, C. A., Xu, N., & Shyu, A. (1998) · The EMBO Journal · doi:10.1093/emboj/17.12.3461 · Cited by 739
Transcriptome-wide Analysis of Regulatory Interactions of the RNA-Binding Protein HuR
Lebedeva, S., Jens, M., Theil, K., Schwanhäusser, B., Selbach, M., Landthaler, M., & Rajewsky, N. (2011) · Molecular Cell · doi:10.1016/j.molcel.2011.06.008 · Cited by 716
Mukherjee, N., Corcoran, D. L., Nusbaum, J. D., Reid, D. W., Georgiev, S., Hafner, M., Ascano, M., Tuschl, T., Ohler, U., & Keene, J. D. (2011) · Molecular Cell · doi:10.1016/j.molcel.2011.06.007 · Cited by 654
Self-citationJi, Z., Lee, J. Y., Pan, Z., Jiang, B., & Tian, B. (2009) · Proceedings of the National Academy of Sciences · doi:10.1073/pnas.0900028106 · Cited by 609
Diverse molecular functions of Hu proteins
Hinman, M. N., & Lou, H. (2008) · Cellular and Molecular Life Sciences · doi:10.1007/s00018-008-8252-6 · Cited by 587
HuR recruits let-7/RISC to repress c-Myc expressionPreprint
Kim, H. H., Kuwano, Y., Srikantan, S., Lee, E. K., Martindale, J. L., & Gorospe, M. (2009) · Genes & Development · doi:10.1101/gad.1812509 · Cited by 570
Cited by
Sorted by citations
Alternative polyadenylation of mRNA precursors
Tian, B., & Manley, J. L. (2017) · Nature Reviews Molecular Cell Biology · doi:10.1038/nrm.2016.116 · Cited by 1,179
Alternative cleavage and polyadenylation: extent, regulation and function
Elkon, R., Ugalde, A. P., & Agami, R. (2013) · Nature Reviews Genetics · doi:10.1038/nrg3482 · Cited by 816
Alternative cleavage and polyadenylation: the long and short of it
Tian, B., & Manley, J. L. (2013) · Trends in Biochemical Sciences · doi:10.1016/j.tibs.2013.03.005 · Cited by 319
Wang, J., Guo, Y., Chu, H., Guan, Y., Bi, J., & Wang, B. (2013) · International Journal of Molecular Sciences · doi:10.3390/ijms140510015 · Cited by 290
Human-Specific Transcriptional Networks in the Brain
Konopka, G., Friedrich, T., Davis‐Turak, J., Winden, K. D., Oldham, M. C., Gao, F., Chen, L., Wang, G.-Z., Luo, R., Preuss, T. M., et al. (2012) · Neuron · doi:10.1016/j.neuron.2012.05.034 · Cited by 268
Alternative polyadenylation: New insights from global analyses
Shi, Y. (2012) · RNA · doi:10.1261/rna.035899.112 · Cited by 212
Intron retention and nuclear loss of SFPQ are molecular hallmarks of ALS
Luisier, R., Tyzack, G. E., Hall, C. E., Mitchell, J. S., Devine, H. E., Taha, D. M., Malik, B. A., Meyer, I., Greensmith, L., Newcombe, J., et al. (2018) · Nature Communications · doi:10.1038/s41467-018-04373-8 · Cited by 164
Mechanisms coordinating ELAV/Hu mRNA regulons
Simone, L. E., & Keene, J. D. (2013) · Current Opinion in Genetics & Development · doi:10.1016/j.gde.2012.12.006 · Cited by 148
Self-citationHandshakes and Fights: The Regulatory Interplay of RNA-Binding Proteins
Dassi, E. (2017) · Frontiers in Molecular Biosciences · doi:10.3389/fmolb.2017.00067 · Cited by 136
Bronicki, L. M., & Jasmin, B. J. (2013) · RNA · doi:10.1261/rna.039164.113 · Cited by 126
Advancing the functional utility of PAR-CLIP by quantifying background binding to mRNAs and lncRNAs
Friedersdorf, M. B., & Keene, J. D. (2014) · Genome biology · doi:10.1186/gb-2014-15-1-r2 · Cited by 119
Self-citationAlternative pre-mRNA splicing in neurons: growing up and extending its reach
Zheng, S., & Black, D. L. (2013) · Trends in Genetics · doi:10.1016/j.tig.2013.04.003 · Cited by 115
The fate of the messenger is pre-determined: A new model for regulation of gene expression
Haimovich, G., Choder, M., Singer, R. H., & Trcek, T. (2013) · Biochimica et Biophysica Acta (BBA) - Gene Regulatory Mechanisms · doi:10.1016/j.bbagrm.2013.01.004 · Cited by 111
ELAV mediates 3′ UTR extension in the Drosophila nervous systemPreprint
Hilgers, V., Lemke, S. B., & Levine, M. (2012) · Genes & Development · doi:10.1101/gad.199653.112 · Cited by 107
Emerging Evidence of Translational Control by AU-Rich Element-Binding Proteins
Otsuka, H., Fukao, A., Funakami, Y., Duncan, K. E., & Fujiwara, T. (2019) · Frontiers in Genetics · doi:10.3389/fgene.2019.00332 · Cited by 101
Alternative Polyadenylation: a new frontier in post transcriptional regulation
Ren, F., Zhang, N., Zhang, L., Miller, E. W., & Pu, J. J. (2020) · Biomarker Research · doi:10.1186/s40364-020-00249-6 · Cited by 92
ELAV Links Paused Pol II to Alternative Polyadenylation in the Drosophila Nervous System
Oktaba, K., Zhang, W., Lotz, T. S., Jun, D. J., Lemke, S. B., Ng, S., Esposito, E., Levine, M., & Hilgers, V. (2014) · Molecular Cell · doi:10.1016/j.molcel.2014.11.024 · Cited by 96
Hitti, E., Bakheet, T. M., Al‐Souhibani, N., Moghrabi, W. N., Al‐Yahya, S., Alghamdi, M. A., Al‐Saif, M., Shoukri, M. M., Lánczky, A., Grépin, R., et al. (2016) · Cancer Research · doi:10.1158/0008-5472.can-15-3110 · Cited by 83
Neve, J., Burger, K., Li, W., Hoque, M., Patel, R. J., Tian, B., Gullerová, M., & Furger, A. (2015) · Genome Research · doi:10.1101/gr.193995.115 · Cited by 85
Alternative polyadenylation in the regulation and dysregulation of gene expression
Turner, R. E., Pattison, A., & Beilharz, T. H. (2017) · Seminars in Cell and Developmental Biology · doi:10.1016/j.semcdb.2017.08.056 · Cited by 77
Yap, K., & Makeyev, E. V. (2013) · Molecular and Cellular Neuroscience · doi:10.1016/j.mcn.2013.01.003 · Cited by 77
Dorrity, T. J., Shin, H., Wiegand, K. A., Aruda, J., Closser, M., Jung, E., Gertie, J. A., Leone, A., Polfer, R., Culbertson, B., et al. (2023) · Science Immunology · doi:10.1126/sciimmunol.adg2979 · Cited by 76
Post‐transcriptional regulation in corticogenesis: how RNA‐binding proteins help build the brain
Pilaz, L., & Silver, D. L. (2015) · Wiley Interdisciplinary Reviews - RNA · doi:10.1002/wrna.1289 · Cited by 72
ELAV proteins along evolution: Back to the nucleus?
Colombrita, C., Silani, V., & Ratti, A. (2013) · Molecular and Cellular Neuroscience · doi:10.1016/j.mcn.2013.02.003 · Cited by 76
RNA-Binding Proteins in Regulation of Alternative Cleavage and Polyadenylation
Zheng, D., & Tian, B. (2014) · Advances in experimental medicine and biology · doi:10.1007/978-1-4939-1221-6_3 · Cited by 66
The landscape of alternative polyadenylation in single cells of the developing mouse embryo
Agarwal, V., Lopez-Darwin, S. L., Kelley, D. R., & Shendure, J. (2021) · Nature Communications · doi:10.1038/s41467-021-25388-8 · Cited by 66
Targeting the Multifaceted HuR Protein, Benefits and Caveats
Zucal, C., D’Agostino, V., Loffredo, R., Mantelli, B., Thongon, N., Lal, P., Latorre, E., & Provenzani, A. (2015) · Current Drug Targets · doi:10.2174/1389450116666150223163632 · Cited by 66
Deciphering human ribonucleoprotein regulatory networks
Mukherjee, N., Wessels, H., Lebedeva, S., Sajek, M. P., Ghanbari, M., Garzia, A., Munteanu, A., Yusuf, D., Farazi, T. A., Hoell, J. I., et al. (2018) · Nucleic Acids Research · doi:10.1093/nar/gky1185 · Cited by 61
Talman, V., Pascale, A., Jäntti, M., Amadio, M., & Tuominen, R. (2016) · Basic & Clinical Pharmacology & Toxicology · doi:10.1111/bcpt.12581 · Cited by 56
Tissue‐specific mechanisms of alternative polyadenylation: Testis, brain, and beyond (2018 update)
MacDonald, C. C. (2019) · Wiley Interdisciplinary Reviews - RNA · doi:10.1002/wrna.1526 · Cited by 57
Neuroprotection requires the functions of the RNA-binding protein HuR
Skliris, A., Papadaki, O., Kafasla, P., Karakasiliοtis, I., Hazapis, O. G., Reczko, M., Grammenoudi, S., Bauer, J., & Kontoyiannis, D. L. (2014) · Cell Death and Differentiation · doi:10.1038/cdd.2014.158 · Cited by 61
Alternative polyadenylation in the nervous system: To what lengths will 3′ UTR extensions take us?
Miura, P., Sanfilippo, P., Shenker, S., & Lai, E. C. (2014) · BioEssays · doi:10.1002/bies.201300174 · Cited by 62
Alternative Polyadenylation: Another Foe in Cancer
Erson-Bensan, A. E., & Can, T. (2016) · Molecular Cancer Research · doi:10.1158/1541-7786.mcr-15-0489 · Cited by 57
Tan, S. H., Ding, K., Chong, Q.-Y., Zhao, J., Liu, Y., Shao, Y., Zhang, Y., Yu, Q., Xiong, Z., Zhang, W., et al. (2017) · Journal of Biological Chemistry · doi:10.1074/jbc.m117.780973 · Cited by 48
Regulation and function of alternative polyadenylation in development and differentiation
Gallicchio, L., Olivares, G. H., Berry, C. W., & Fuller, M. T. (2023) · RNA Biology · doi:10.1080/15476286.2023.2275109 · Cited by 49
Lü, W., Lee, S., Majumdar, S., Zhang, B., Sanfilippo, P., Joseph, B. J., Miura, P., Soller, M., & Lai, E. C. (2020) · Molecular Cell · doi:10.1016/j.molcel.2020.09.007 · Cited by 46
ELAV/Hu RNA binding proteins determine multiple programs of neural alternative splicing
Lee, S., Wei, L., Zhang, B., Goering, R., Majumdar, S., Wen, J., Taliaferro, J. M., & Lai, E. C. (2021) · PLoS Genetics · doi:10.1371/journal.pgen.1009439 · Cited by 46
Borgonetti, V., López, V., & Galeotti, N. (2022) · Journal of Ethnopharmacology · doi:10.1016/j.jep.2022.115362 · Cited by 42
Zhang, Z., So, K., Peterson, R., Bauer, M. J., Ng, H., Zhang, Y., Kim, J. H., Kidd, T., & Miura, P. (2019) · Cell Reports · doi:10.1016/j.celrep.2019.05.083 · Cited by 42
Alternative polyadenylation: An enigma of transcript length variation in health and disease
Mohanan, N. K., Shaji, F., Koshre, G. R., & Laishram, R. S. (2021) · Wiley Interdisciplinary Reviews - RNA · doi:10.1002/wrna.1692 · Cited by 43
Zhang, Z., Bae, B., Dredge, W. H., & Miura, P. (2023) · Nature Communications · doi:10.1038/s41467-023-41207-8 · Cited by 40
Emerging role of HuR in inflammatory response in kidney diseases
Shang, J., & Zhao, Z. (2017) · Acta Biochimica et Biophysica Sinica · doi:10.1093/abbs/gmx071 · Cited by 41
RNA binding proteins: a common denominator of neuronal function and dysfunction
Doxakis, E. (2014) · Neuroscience Bulletin · doi:10.1007/s12264-014-1443-7 · Cited by 40
RNA–Binding Protein HuD as a Versatile Factor in Neuronal and Non–Neuronal Systems
Jung, M., & Lee, E. K. (2021) · Biology · doi:10.3390/biology10050361 · Cited by 39
Alternative Polyadenylation in Stem Cell Self-Renewal and Differentiation
Sommerkamp, P., Cabezas‐Wallscheid, N., & Trumpp, A. (2021) · Trends in Molecular Medicine · doi:10.1016/j.molmed.2021.04.006 · Cited by 40
Neuronal RNA ‐binding proteins in health and disease
Lenzken, S. C., Achsel, T., Carrì, M. T., & Barabino, S. M. L. (2014) · Wiley Interdisciplinary Reviews - RNA · doi:10.1002/wrna.1231 · Cited by 40
Dai, W., Li, W., Hoque, M., Li, Z., Tian, B., & Makeyev, E. V. (2015) · Nature Communications · doi:10.1038/ncomms8576 · Cited by 37
The ELAV family of RNA-binding proteins in synaptic plasticity and long-term memory
Mirisis, A. A., & Carew, T. J. (2019) · Neurobiology of Learning and Memory · doi:10.1016/j.nlm.2019.04.007 · Cited by 34
Bhargava, S., Patil, V. S., Mahalingam, K., & Somasundaram, K. (2016) · Oncotarget · doi:10.18632/oncotarget.14287 · Cited by 38
ELAV and FNE Determine Neuronal Transcript Signatures through EXon-Activated Rescue
Carrasco, J., Rauer, M., Hummel, B., Grzejda, D., Alfonso-Gonzalez, C., Lee, Y. J., Wang, Q., Puchalska, M., Mittler, G., & Hilgers, V. (2020) · Molecular Cell · doi:10.1016/j.molcel.2020.09.011 · Cited by 38
HuR and TIA1/TIAL1 Are Involved in Regulation of Alternative Splicing of SIRT1 Pre-mRNA
Zhao, W., Zhao, J., Hou, M., Wang, Y., Zhang, Y., Zhao, X., Zhang, C., & Guo, D. (2014) · International Journal of Molecular Sciences · doi:10.3390/ijms15022946 · Cited by 38
All's well that ends well: alternative polyadenylation and its implications for stem cell biology
Mueller, A. A., Cheung, T. H., & Rando, T. A. (2013) · Current Opinion in Cell Biology · doi:10.1016/j.ceb.2012.12.008 · Cited by 32
Li, Y.-J., Wang, C., Zhou, Y., Liao, Z.-Y., Zhu, S.-F., Hu, Y., Chen, C., Luo, J., Wen, Z., & Xu, L. (2013) · Cancer Cell International · doi:10.1186/1475-2867-13-90 · Cited by 32
Wutikeli, H., Xie, T., Xiong, W., & Shen, Y. (2025) · RNA Biology · doi:10.1080/15476286.2025.2471133 · Cited by 33
A Positive Feedback Mechanism That Regulates Expression of miR-9 during Neurogenesis
Davila, J., Goff, L. A., Ricupero, C. L., Camarillo, C., Oni, E. N., Swerdel, M. R., Toro-Ramos, A. J., Li, J., & Hart, R. P. (2014) · PLoS ONE · doi:10.1371/journal.pone.0094348 · Cited by 32
Sanna, M. D., Quattrone, A., & Galeotti, N. (2017) · Neuropharmacology · doi:10.1016/j.neuropharm.2017.06.005 · Cited by 29
miR-410 controls adult SVZ neurogenesis by targeting neurogenic genes
Tsan, Y.-C., Morell, M. H., & O’Shea, K. S. (2016) · Stem Cell Research · doi:10.1016/j.scr.2016.07.003 · Cited by 26
Neurogenesis: Regulation by Alternative Splicing and Related Posttranscriptional Processes
Lara‐Pezzi, E., Desco, M., Gatto, A., & Gómez‐Gaviro, M. V. (2016) · The Neuroscientist · doi:10.1177/1073858416678604 · Cited by 24
Regulation of the Alternative Neural Transcriptome by ELAV/Hu RNA Binding Proteins
Lü, W., & Lai, E. C. (2022) · Frontiers in Genetics · doi:10.3389/fgene.2022.848626 · Cited by 26
Regulation of neuronal RNA signatures by ELAV /Hu proteins
Hilgers, V. (2022) · Wiley Interdisciplinary Reviews - RNA · doi:10.1002/wrna.1733 · Cited by 26
Regulation of gene expression by alternative polyadenylation in health and disease
Tian, B., Yu, S., & Zhang, Q. (2026) · Nature Reviews Genetics · doi:10.1038/s41576-025-00928-w · Cited by 23
Protein synthesis as an integral quality control mechanism during ageing
Charmpilas, N., Daskalaki, I., Papandreou, M., & Tavernarakis, N. (2014) · Ageing Research Reviews · doi:10.1016/j.arr.2014.12.008 · Cited by 21
Saikia, B. J., Bhardwaj, J., Paul, S. C., Sharma, S., Neog, A., Paul, S. R., & Binukumar, B. K. (2023) · Mechanisms of Ageing and Development · doi:10.1016/j.mad.2023.111838 · Cited by 19
Neuronal RNA‐binding protein HuD regulates addiction‐related gene expression and behavior
Oliver, R. J., Brigman, J. L., Bolognani, F., Allan, A. M., Neisewander, J. L., & Perrone‐Bizzozero, N. I. (2017) · Genes Brain & Behavior · doi:10.1111/gbb.12454 · Cited by 21
Hilgers, V. (2015) · RNA Biology · doi:10.1080/15476286.2015.1060393 · Cited by 20
Regulation of alternative splicing and polyadenylation in neurons
Lee, S., Aubee, J. I., & Lai, E. C. (2023) · Life Science Alliance · doi:10.26508/lsa.202302000 · Cited by 21
Novel mechanisms for osteogenic differentiation of human aortic valve interstitial cells
Wang, Y., Xiao, X., Zhou, T., Han, D. H., & Dong, N. (2019) · Journal of Thoracic and Cardiovascular Surgery · doi:10.1016/j.jtcvs.2019.05.051 · Cited by 19
Sena, R. M., Twiss, J. L., Gardiner, A. S., Dell’Orco, M., Linsenbardt, D. N., & Perrone‐Bizzozero, N. I. (2021) · Molecules · doi:10.3390/molecules26102836 · Cited by 18
Borgonetti, V., Coppi, E., & Galeotti, N. (2021) · International Journal of Molecular Sciences · doi:10.3390/ijms221910394 · Cited by 18
Kiltschewskij, D. J., Harrison, P. F., Fitzsimmons, C., Beilharz, T. H., & Cairns, M. J. (2023) · Nucleic Acids Research · doi:10.1093/nar/gkad499 · Cited by 25
Qiu, F., Fu, Y., Lu, C., Feng, Y., Wang, Q., Huo, Z., Jia, X., Chen, C., Chen, S., & Xu, A. (2017) · The Journal of Immunology · doi:10.4049/jimmunol.1601872 · Cited by 18
Hinman, M. N., Zhou, H.-L., Sharma, A., & Lou, H. J. (2013) · Nucleic Acids Research · doi:10.1093/nar/gkt166 · Cited by 18
Alternative Polyadenylation and Its Impact on Cellular Processes
Akman, H. B., & Erson-Bensan, A. E. (2014) · MicroRNA · doi:10.2174/2211536602666131210001152 · Cited by 17
Borgonetti, V., & Galeotti, N. (2023) · Molecular Neurobiology · doi:10.1007/s12035-023-03236-8 · Cited by 16
Kelle, D., Kırımtay, K., Selçuk, E., & Karabay, A. (2019) · PLoS ONE · doi:10.1371/journal.pone.0212518 · Cited by 17
Dynamic regulation of alternative polyadenylation by PQBP1 during neurogenesis
Liu, X., Xie, H., Liu, W., Zuo, J. J., Li, S., Tian, Y., Zhao, J., Bai, M., Li, J., Bao, L., et al. (2024) · Cell Reports · doi:10.1016/j.celrep.2024.114525 · Cited by 18
Dergunova, L. V., Rozhkova, A. V., Sudarkina, O. Y., & Limborska, S. A. (2013) · Molecular Biology Reports · doi:10.1007/s11033-013-2783-0 · Cited by 14
Asadi, M. R., Talebi, M., Gharesouran, J., Sabaie, H., Jalaiei, A., Arsang‐Jang, S., Taheri, M. N., Sayad, A., & Rezazadeh, M. (2022) · Frontiers in Aging Neuroscience · doi:10.3389/fnagi.2022.933019 · Cited by 14
Bronicki, L., Bélanger, G., & Jasmin, B. J. (2012) · Journal of Neuroscience · doi:10.1523/jneurosci.2247-12.2012 · Cited by 13
mRNA isoform balance in neuronal development and disease
LaForce, G. R., Philippidou, P., & Schaffer, A. E. (2022) · Wiley Interdisciplinary Reviews - RNA · doi:10.1002/wrna.1762 · Cited by 15
Novel LINS1 missense mutation in a family with non‐syndromic intellectual disability
Sheth, J. J., Ranjan, G., Shah, K., Bhavsar, R., & Sheth, F. J. (2017) · American Journal of Medical Genetics Part A · doi:10.1002/ajmg.a.38089 · Cited by 12
Microarray Meta-Analysis of RNA-Binding Protein Functions in Alternative Polyadenylation
Hu, W., Liu, Y., & Yan, J. (2014) · PLoS ONE · doi:10.1371/journal.pone.0090774 · Cited by 12
Ambrosio, F. A., Coricello, A., Costa, G., Lupia, A., Micaelli, M., Marchesi, N., Sala, F., Pascale, A., Rossi, D., Vasile, F., et al. (2021) · Journal of Medicinal Chemistry · doi:10.1021/acs.jmedchem.1c00191 · Cited by 9
Abdelsalam, S. S., Ghanem, S. K., Zahid, M., Abunada, H. H., Bader, L., Raïq, H., Khan, A., Parray, A., Djouhri, L., & Agouni, A. (2024) · Journal of Cellular Physiology · doi:10.1002/jcp.31229 · Cited by 9
McQuarrie, D. W. J., & Soller, M. (2024) · Nucleic Acids Research · doi:10.1093/nar/gkae826 · Cited by 8
Carrasco, J., Mateos, F., & Hilgers, V. (2022) · Cell Reports · doi:10.1016/j.celrep.2022.111542 · Cited by 8
Choudhury, S. D., Ancy, V. S., Mushtaq, Z., & Kumar, V. (2017) · Synapse · doi:10.1002/syn.21969 · Cited by 7
Posttranscriptional and translational control of neurogenesis
Alsina, F. C., & Silver, D. L. (2020) · Elsevier eBooks · doi:10.1016/b978-0-12-814405-3.00028-x · Cited by 6
Watanabe, T., & Aonuma, H. (2013) · Insect Molecular Biology · doi:10.1111/imb.12057 · Cited by 7
Gong, Q., Stump, M. R., & Zhou, Z. (2018) · Journal of Biological Chemistry · doi:10.1074/jbc.ra118.003720 · Cited by 6
Pastic, A., Negeri, O., Ravel‐Chapuis, A., Savard, A., Trung, M. T., Palidwor, G., Guo, H., Marcogliese, P. C., Taylor, J. A., Okano, H., et al. (2022) · bioRxiv (Cold Spring Harbor Laboratory) · doi:10.1101/2022.04.24.489327 · Cited by 6
Zhou, Y., Rashad, S., Ando, D., Kobayashi, Y., Tominaga, T., & Niizuma, K. (2024) · Journal of Cellular Physiology · doi:10.1002/jcp.31477 · Cited by 7
Rotllant, G., Nguyen, T. V., Hurwood, D. A., Sbragaglia, V., Ventura, T., Joly, S., Elizur, A., & Mather, P. B. (2018) · Hydrobiologia · doi:10.1007/s10750-018-3521-3 · Cited by 5
Neuronal RNA processing: cross-talk between transcriptional regulation and RNA-binding proteins
Ozbulut, H. C., & Hilgers, V. (2024) · Frontiers in Molecular Neuroscience · doi:10.3389/fnmol.2024.1426410 · Cited by 4
Noulet, F., & Merat, R. (2022) · Biochemical and Biophysical Research Communications · doi:10.1016/j.bbrc.2022.07.086 · Cited by 4
A developmental mechanism to regulate alternative polyadenylation in an adult stem cell lineagePreprint
Gallicchio, L., Matias, N. R., Morales-Polanco, F., Nava, I., Stern, S. R., Zeng, Y., & Fuller, M. T. (2024) · Genes & Development · doi:10.1101/gad.351649.124 · Cited by 4
Ray, S., Bhattacharyya, S. N., & Mukherjee, K. (2026) · RNA Biology · doi:10.1080/15476286.2026.2647903 · Cited by 3
A nuclear role for ARGONAUTE-2 in regulation of neuronal alternative polyadenylationPreprint
Ravid, R., Siany, A., Rivkin, N., Eitan, C., Marmor-Kollet, H., Yanowski, E., Savidor, A., Levin, Y., Rot, G., Meister, G., et al. (2020) · bioRxiv (Cold Spring Harbor Laboratory) · doi:10.1101/2020.12.15.422806 · Cited by 3
Doxakis, E., Xue, Y. C., & Savulescu, A. F. (2025) · Frontiers in Molecular Neuroscience · doi:10.3389/fnmol.2025.1716825 · Cited by 2
Sensing the needs: Molecular basis of miRNA regulatory role of ELAVL protein HuR
Mukherjee, K. (2026) · Biochimica et Biophysica Acta (BBA) - Molecular Cell Research · doi:10.1016/j.bbamcr.2026.120200 · Cited by 1
Metadata
- Authors
- Mansfield, K. D., & Keene, J. D.
- Affiliations
- Duke University (US)
- Corresponding author
- Mansfield, Kyle D.
- ORCID
- Mansfield, Kyle D.
- Venue
- Nucleic Acids Research
- Publisher
- Oxford University Press (OUP)
- Published
- 2011-12-01
- Volume
- 40
- Issue
- 6
- Pages
- 2734-2746
- ISSN
- 0305-1048 (ISSN-L)
- 1362-4962
- PMC
- PMC3315332
- OpenAlex
- W2091095457
- Cited by
- 112
- References
- 66
- Citations by year
- 2026: 5 · 2025: 4 · 2024: 6 · 2023: 8 · 2022: 8 · 2021: 8 · 2020: 6 · 2019: 8 · 2018: 4 · 2017: 10 · 2016: 7 · 2015: 5 · 2014: 13 · 2013: 15 · 2012: 5
- FWCI
- 4.29
- Type
- journal article
- Language
- en
- Open access
- gold
- doi.org
- Licence
- Locations
- Nucleic Acids Research (publishedVersion, cc-by-nc)
- Europe PMC (PubMed Central) (publishedVersion, cc-by-nc)
- PubMed Central (publishedVersion, cc-by-nc)
- PubMed (publishedVersion)
- Funders
- National Science Foundation (0842621)
- National Institutes of Health (5f32ns059100-02)
- National Cancer Institute (R01CA157268)
- National Institute of Neurological Disorders and Stroke (5F32NS059100-02)
- Topics
- Life Sciences › Biochemistry, Genetics and Molecular Biology › Molecular Biology › RNA Research and Splicing
- Life Sciences › Biochemistry, Genetics and Molecular Biology › Molecular Biology › RNA regulation and disease
- Life Sciences › Biochemistry, Genetics and Molecular Biology › Molecular Biology › Developmental Biology and Gene Regulation
- Keywords
- HuR, hubs, HuC, HUD, alternative polyadenylation, neuronal differentiation, mRNA stability, 3' untranslated region, post-transcriptional regulation, RNA-binding proteins, mRNA isoforms, translation suppression
- MeSH terms
- Cell Line, Gene Expression Regulation, Humans, Neurons, Protein Biosynthesis, 3' Untranslated Regions, RNA Stability, Polyadenylation, ELAV Proteins, Neurogenesis, RNA Isoforms
About these checks
Registry, retraction, Cites and statistics results are computed, not judged, with one exception: a printed reference that no index lists is read once by a model before it counts as a citation error. Claims are extracted by a model and kept only when their quote appears verbatim in the text; each cited source is then checked, with a model’s help, for whether it says what the claim relies on. Those verdicts can be wrong — read the claim’s quote and the cited source before relying on one.
Statistics and arithmetic are recomputed, not judged.
Confidence bands are shown only for fields calibrated on our annotated test set. None is calibrated yet, so no band is shown.
What counts as a claim ›How we measure confidence ›How we check this ›
Are you an author, or do you see a problem with this page? Request a review
