Cited by 224

The DOI matches its Crossref record; 1 of the 1 references it cites were found in a registry or an index.

Assessment of small RNA sorting into different extracellular fractions revealed by high-throughput sequencing of breast cell lines

Tosar, J. P., Gambaro, F., Sanguinetti, J., Bonilla, B., Witwer, K. W., Cayota, A.·2015·Nucleic Acids Research

Overview

The claims and statistics of this paper haven’t been checked yet.

Run the check — free, no account needed. It reads the open-access text and checks the sources it cites.

A few free checks a day · papers already verified open instantly · results are public

Integrity signals

Registry

Crossref · 10.1093/nar/gkv432

Cites

1 of 1 references verified0 citation errors · 0 not checkable

Statistics

Figures

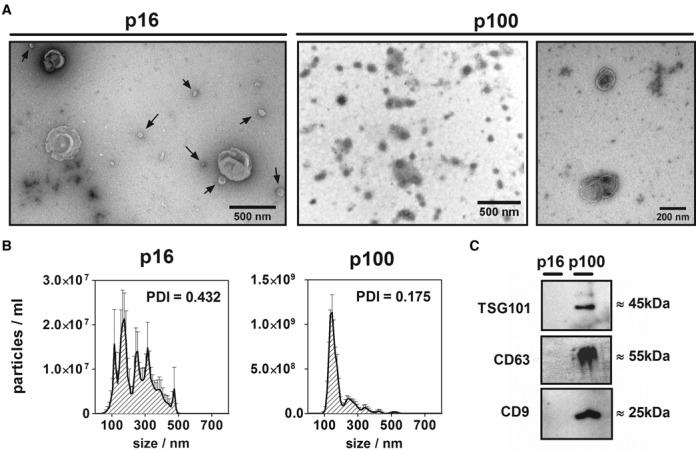
Figure 1. Characterization of p16 and p100 fractions. (A) Negative staining transmission electron microscopy of 16 000 g (p16; left) and 100 000 g (p100; middle: low magnification; right: high magnification) pellets of the conditioned medium of MCF-7 cells. Arrows in p16 show particles of <100 nm which co-purified with bigger (>300 nm) vesicles. (B) Size distribution (nanoparticle tracking analysis) of p16 (left) and p100 (right) fractions. Error bars correspond to the standard error of the mean for five repeated measurements of the same sample. The polydispersity index (PDI) of replicates of the same fractions measured by dynamic light scattering is also shown. (C) Western blot of exosomal markers: TSG101, CD63 and CD9 in equal protein loads of MCF-7 p16 and p100 fractions.
Figure 1. Characterization of p16 and p100 fractions. (A) Negative staining transmission electron microscopy of 16 000 g (p16; left) and 100 000 g (p100; middle: low magnification; right: high magnification) pellets of the conditioned medium of MCF-7 cells. Arrows in p16 show particles of <100 nm which co-purified with bigger (>300 nm) vesicles. (B) Size distribution (nanoparticle tracking analysis) of p16 (left) and p100 (right) fractions. Error bars correspond to the standard error of the mean for five repeated measurements of the same sample. The polydispersity index (PDI) of replicates of the same fractions measured by dynamic light scattering is also shown. (C) Western blot of exosomal markers: TSG101, CD63 and CD9 in equal protein loads of MCF-7 p16 and p100 fractions.CC BY-NC · PubMed Central
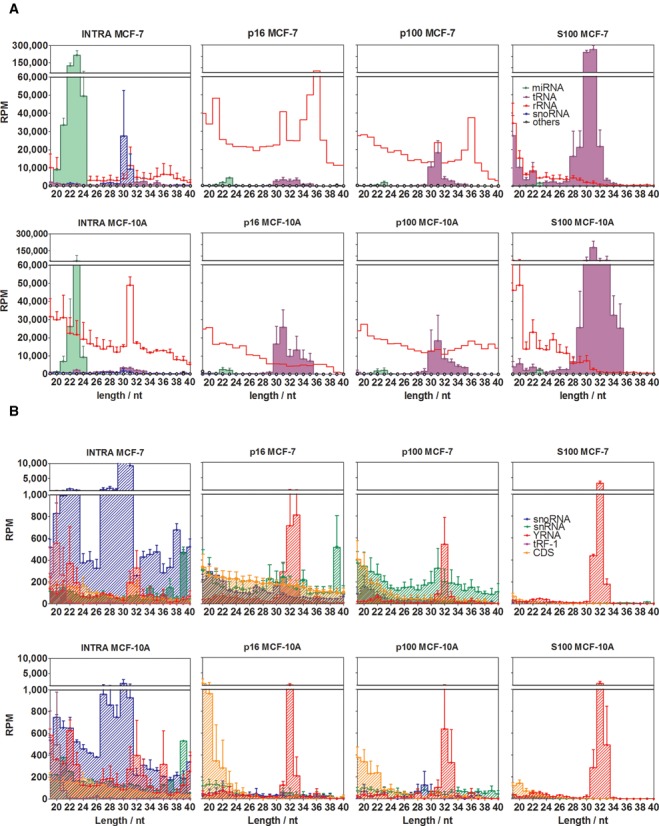
Figure 2. Different small RNA profiles characterize intracellular and extracellular fractions. Reads were annotated in one of the following functional categories: miRNAs (green area), rRNA-derived sequences (red line), snoRNA-derived sequences (blue diagonal pattern), tRNA-derived sequences (violet area), snRNA-derived sequences (green diagonal pattern), sequences derived from protein-coding exons (orange diagonal pattern), YRNA-derived sequences (diagonal red pattern) and 3′ trailer sequences from tRNA precursors (violet diagonal pattern). (A) and (B) are plots of the same data, but miRNAs, rRNA-derived and tRNA-derived sequences were omitted in (b) for reasons of scale. RPM: reads per million mapped reads. Error bars correspond to one standard error of the mean (n = 3 in p16, p100 and S100; n = 2 in INTRA), and were omitted for rRNA-derived sequences in p16 and p100 for reasons of clarity. The upper size limit of the graphs was set to 40 nt since no remarkable small RNA populations were detected beyond that size.
Figure 2. Different small RNA profiles characterize intracellular and extracellular fractions. Reads were annotated in one of the following functional categories: miRNAs (green area), rRNA-derived sequences (red line), snoRNA-derived sequences (blue diagonal pattern), tRNA-derived sequences (violet area), snRNA-derived sequences (green diagonal pattern), sequences derived from protein-coding exons (orange diagonal pattern), YRNA-derived sequences (diagonal red pattern) and 3′ trailer sequences from tRNA precursors (violet diagonal pattern). (A) and (B) are plots of the same data, but miRNAs, rRNA-derived and tRNA-derived sequences were omitted in (b) for reasons of scale. RPM: reads per million mapped reads. Error bars correspond to one standard error of the mean (n = 3 in p16, p100 and S100; n = 2 in INTRA), and were omitted for rRNA-derived sequences in p16 and p100 for reasons of clarity. The upper size limit of the graphs was set to 40 nt since no remarkable small RNA populations were detected beyond that size.CC BY-NC · PubMed Central
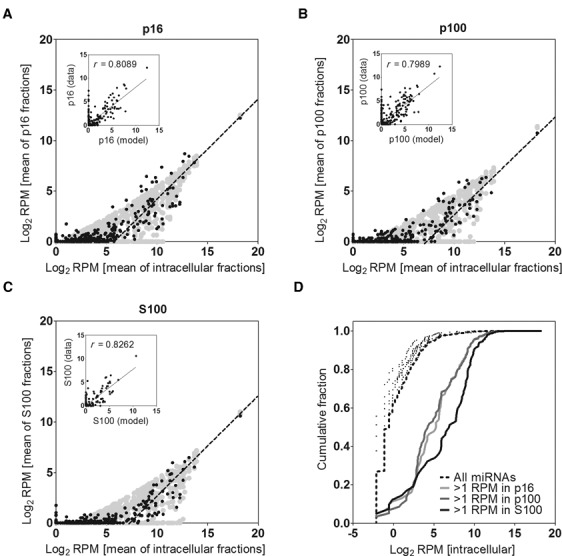
Figure 3. miRNA abundances in the extracellular fractions are consistent with a model of non-selective secretion for most miRNAs. Mean relative abundances (in Log2 scale) of each miRNA in the extracellular fractions p16 (A), p100 (B) and S100 (C) were plotted against their corresponding intracellular levels. Lines of slope = 1 were manually fitted to the data. A theoretical model which assumes passive secretion was overlaid (light gray area). Insets: correlation (Pearson's) between the model and the data. (D) Cumulative distribution of Log2 RPM values of intracellular miRNAs. The black dashed line includes all detected miRNAs in the intracellular fraction of MCF-7 cells (n = 456). The same analysis was repeated including only those miRNAs with >1 RPM in p16 (light gray line; n = 119), p100 (dark gray line; n = 114) or S100 (black line; n = 80). As a control, 5 subsamples of 80 randomly selected miRNAs were also analyzed (black dots).
Figure 3. miRNA abundances in the extracellular fractions are consistent with a model of non-selective secretion for most miRNAs. Mean relative abundances (in Log2 scale) of each miRNA in the extracellular fractions p16 (A), p100 (B) and S100 (C) were plotted against their corresponding intracellular levels. Lines of slope = 1 were manually fitted to the data. A theoretical model which assumes passive secretion was overlaid (light gray area). Insets: correlation (Pearson's) between the model and the data. (D) Cumulative distribution of Log2 RPM values of intracellular miRNAs. The black dashed line includes all detected miRNAs in the intracellular fraction of MCF-7 cells (n = 456). The same analysis was repeated including only those miRNAs with >1 RPM in p16 (light gray line; n = 119), p100 (dark gray line; n = 114) or S100 (black line; n = 80). As a control, 5 subsamples of 80 randomly selected miRNAs were also analyzed (black dots).CC BY-NC · PubMed Central
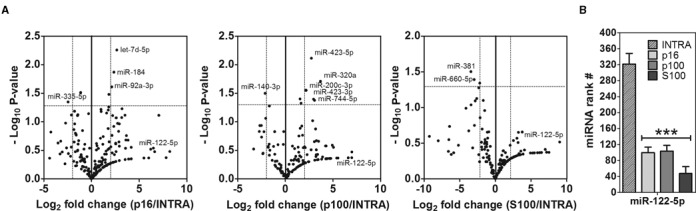
Figure 4. Detection of extracellular-enriched miRNAs. (A) Volcano plots showing miRNAs significantly enriched between extracellular and intracellular fractions. Sequence counts were normalized to the total sum of miRNAs in each data set and the corrected fold change was calculated and expressed as Log2. P-values were calculated by an unpaired two-tailed Welch's t test and expressed as −Log10. The horizontal dashed line shows P < 0.05. (B) Ranking analysis (i.e. position in a list of miRNAs ordered by abundance) of miR-122–5p. A significant (P < 0.001) lower ranking was found in the extracellular fractions (one-way ANOVA with Tukey's post hoc test).
Figure 4. Detection of extracellular-enriched miRNAs. (A) Volcano plots showing miRNAs significantly enriched between extracellular and intracellular fractions. Sequence counts were normalized to the total sum of miRNAs in each data set and the corrected fold change was calculated and expressed as Log2. P-values were calculated by an unpaired two-tailed Welch's t test and expressed as −Log10. The horizontal dashed line shows P < 0.05. (B) Ranking analysis (i.e. position in a list of miRNAs ordered by abundance) of miR-122–5p. A significant (P < 0.001) lower ranking was found in the extracellular fractions (one-way ANOVA with Tukey's post hoc test).CC BY-NC · PubMed Central
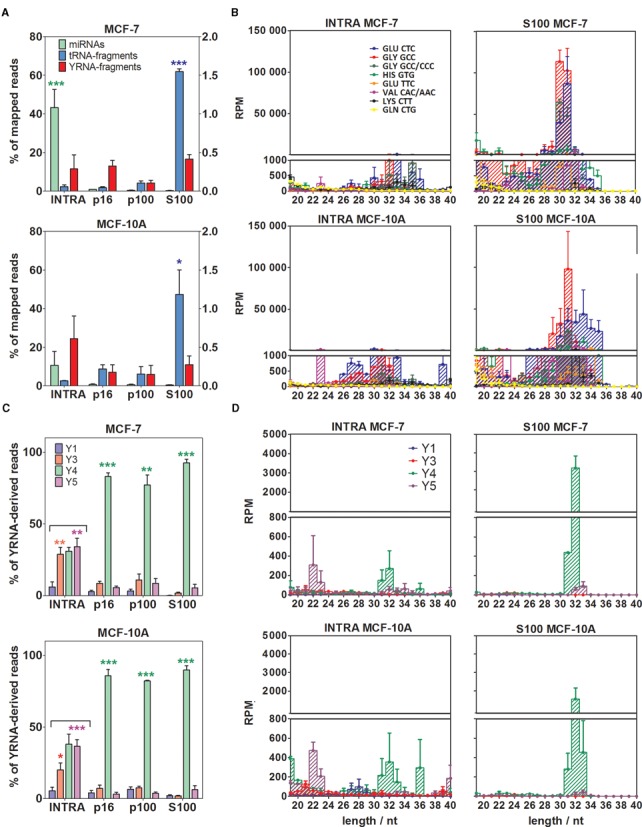
Figure 5. The extracellular milieu is enriched in 5′ tRNA halves and Y4 RNA-derived 5′ fragments, especially in the S100 fraction. (A) Comparison of the percentage of mapped reads corresponding to miRNAs (green; left axis), tRNA-derived sequences (blue; left axis) and YRNA-derived sequences (red; right axis) in the intracellular compartment and the extracellular fractions. Top: MCF-7 cells. Bottom: MCF-10A cells. (B) Size distributions and relative abundances of top eight tRNA-derived sequences. Left: intracellular. Right: S100 fraction. Top: MCF-7 cells. Bottom: MCF-10A cells. (C) Comparison of the percentage of YRNA-derived sequences corresponding to Y1 (blue), Y3 (red), Y4 (green) and Y5 (magenta). (D) Size distributions and abundances of YRNA-derived sequences. Distribution of the panels is the same as in (B). The upper size limit of both panels was set to 40 nt since no remarkable small RNA populations were detected beyond that size. Significantly different samples are shown with stars (one-way ANOVA with Tukey's post hoc test). For this and subsequent figures, *P < 0.05; **P < 0.01; ***P < 0.001.
Figure 5. The extracellular milieu is enriched in 5′ tRNA halves and Y4 RNA-derived 5′ fragments, especially in the S100 fraction. (A) Comparison of the percentage of mapped reads corresponding to miRNAs (green; left axis), tRNA-derived sequences (blue; left axis) and YRNA-derived sequences (red; right axis) in the intracellular compartment and the extracellular fractions. Top: MCF-7 cells. Bottom: MCF-10A cells. (B) Size distributions and relative abundances of top eight tRNA-derived sequences. Left: intracellular. Right: S100 fraction. Top: MCF-7 cells. Bottom: MCF-10A cells. (C) Comparison of the percentage of YRNA-derived sequences corresponding to Y1 (blue), Y3 (red), Y4 (green) and Y5 (magenta). (D) Size distributions and abundances of YRNA-derived sequences. Distribution of the panels is the same as in (B). The upper size limit of both panels was set to 40 nt since no remarkable small RNA populations were detected beyond that size. Significantly different samples are shown with stars (one-way ANOVA with Tukey's post hoc test). For this and subsequent figures, *P < 0.05; **P < 0.01; ***P < 0.001.CC BY-NC · PubMed Central
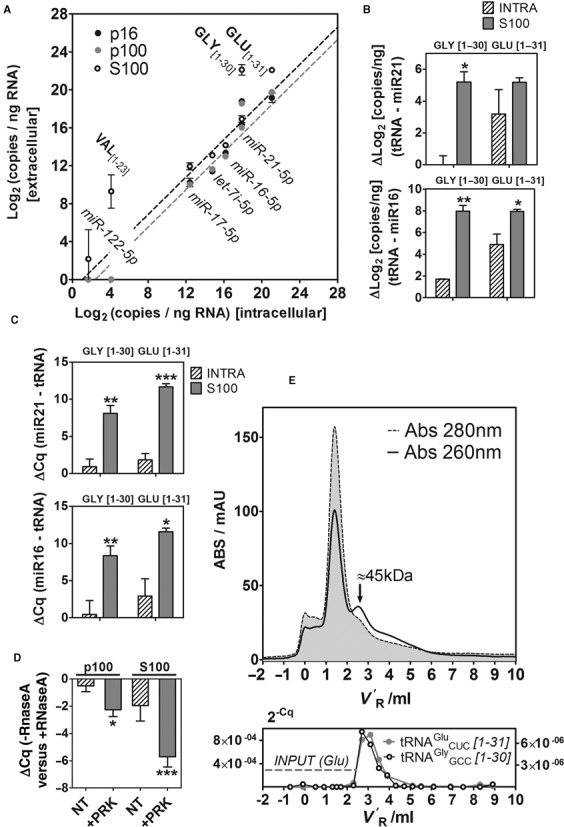
Figure 6. Validation of the sequencing results by SL-RT-ddPCR and SL-RT-qPCR, and purification of ribonucleoprotein complexes containing 5′ tRNA halves. (A) 2D-plots showing the relative abundance (Log2 copies per nanograms of input RNA) of selected miRNAs and tRNA-derived fragments between extracellular and intracellular fractions, measured by droplet digital PCR (ddPCR). Light gray, dark gray and white dots correspond to p16, p100 and S100, respectively. (B and C) Increased relative abundance (measured by ddPCR (B); qPCR (C)) of 5′ tRNA halves derived from tRNAGlyGCC (left; 1–30 nt) and tRNAGluCUC (right; 1–31 nt) in S100 (gray bars) with respect to the intracellular compartment (diagonal pattern). Abundances of tRNA halves were normalized to miR-21–5p and miR-16–5p. Significantly higher normalized abundances of tRNA halves in S100 versus INTRA are shown (Student t test; one-tailed). (D) Protease and RNase protection assays of the p100 and S100 fractions. ΔCq values were calculated between samples not treated and treated with RNaseA. The other experimental variable was treatment with Proteinase K (NT: not treated; +PRK: treated). Three biological replicates of each condition were analyzed, and each replicate was assayed for miR-21–5p and 5′ halves of tRNAGlyGCC and tRNAGluCUC (thus, each bar corresponds to nine different ΔCq values). (E) Top: The S100 fraction from MCF-7 cells was injected in a Superdex 75 10/300 column (size-exclusion chromatography) and fractions (200 μl) were eluted in 1× PBS using an ÄKTA purifier FPLC system (GE Healthcare, Amersham). The chromatograms correspond to the absorbance at 280 nm (gray area with dashed contours) and 260 nm (black line). V′R: adjusted retention volume (VR - Vm). Bottom: Eluted fractions were assayed for the presence of 5′ halves from tRNAGluCUC (gray; left Y axis) and tRNAGlyGCC (black; right Y axis) by SL-RT-qPCR. The horizontal gray dashed line corresponds to the input (before injection) 2−Cq value for tRNAGluCUC. The input 2−Cq value for tRNAGlyGCC was 7.5×10⁻⁸.
Figure 6. Validation of the sequencing results by SL-RT-ddPCR and SL-RT-qPCR, and purification of ribonucleoprotein complexes containing 5′ tRNA halves. (A) 2D-plots showing the relative abundance (Log2 copies per nanograms of input RNA) of selected miRNAs and tRNA-derived fragments between extracellular and intracellular fractions, measured by droplet digital PCR (ddPCR). Light gray, dark gray and white dots correspond to p16, p100 and S100, respectively. (B and C) Increased relative abundance (measured by ddPCR (B); qPCR (C)) of 5′ tRNA halves derived from tRNAGlyGCC (left; 1–30 nt) and tRNAGluCUC (right; 1–31 nt) in S100 (gray bars) with respect to the intracellular compartment (diagonal pattern). Abundances of tRNA halves were normalized to miR-21–5p and miR-16–5p. Significantly higher normalized abundances of tRNA halves in S100 versus INTRA are shown (Student t test; one-tailed). (D) Protease and RNase protection assays of the p100 and S100 fractions. ΔCq values were calculated between samples not treated and treated with RNaseA. The other experimental variable was treatment with Proteinase K (NT: not treated; +PRK: treated). Three biological replicates of each condition were analyzed, and each replicate was assayed for miR-21–5p and 5′ halves of tRNAGlyGCC and tRNAGluCUC (thus, each bar corresponds to nine different ΔCq values). (E) Top: The S100 fraction from MCF-7 cells was injected in a Superdex 75 10/300 column (size-exclusion chromatography) and fractions (200 μl) were eluted in 1× PBS using an ÄKTA purifier FPLC system (GE Healthcare, Amersham). The chromatograms correspond to the absorbance at 280 nm (gray area with dashed contours) and 260 nm (black line). V′R: adjusted retention volume (VR - Vm). Bottom: Eluted fractions were assayed for the presence of 5′ halves from tRNAGluCUC (gray; left Y axis) and tRNAGlyGCC (black; right Y axis) by SL-RT-qPCR. The horizontal gray dashed line corresponds to the input (before injection) 2−Cq value for tRNAGluCUC. The input 2−Cq value for tRNAGlyGCC was 7.5×10−8.CC BY-NC · PubMed Central

Verification

Claims the paper makes

The claims and statistics of this paper haven’t been checked yet.

Run the check — free, no account needed. It reads the open-access text and checks the sources it cites.

A few free checks a day · papers already verified open instantly · results are public

Claims other papers make about this one

Each is checked against this paper’s own text: does it say what the citing paper says it does?

Self-check

Percentages, sums and reported differences re-computed from the paper’s own numbers.

The self-check needs the paper’s full text.

Citations

Cites

Show all 1 references

Research works printed but not linked: 52

  1. Valadi, 2007, Nature Cell Biology, 9, 654, 10.1038/ncb1596 · DOI · Paper page
  2. Cortez, 2011, 8, 467, 10.1038/nrclinonc.2011.76 · DOI
  3. 2014, 11, 145, 10.1038/nrclinonc.2014.5 · DOI · Paper page
  4. Mittelbrunn, 2012, Nature reviews. Molecular cell biology, 13, 328, 10.1038/nrm3335 · DOI
  5. 2011, PNAS, 108, 5003, 10.1073/pnas.1019055108 · DOI · Paper page
  6. 2014, PNAS, 111, 14888, 10.1073/pnas.1408301111 · DOI
  7. 2011, Nucleic Acids Research, 39, 7223, 10.1093/nar/gkr254 · DOI · Paper page
  8. 2010, Nucleic Acids Research, 38, 7248, 10.1093/nar/gkq601 · DOI · Paper page
  9. Vickers, 2011, Nature Cell Biology, 13, 423, 10.1038/ncb2210 · DOI · Paper page
  10. Mathivanan, 2010, 73, 1907, 10.1016/j.jprot.2010.06.006 · DOI
  11. 2004, Blood, 104, 2761, 10.1182/blood-2003-10-3614 · DOI
  12. 2012, Nucleic Acids Research, 40, 9272, 10.1093/nar/gks658 · DOI
  13. 2013, 4, 119
  14. Turchinovich, 2012, Trends in biochemical sciences, 37, 460, 10.1016/j.tibs.2012.08.003 · DOI
  15. 2012, Nucleic Acids Research, 40, 6787, 10.1093/nar/gks307 · DOI
  16. Ivanov, 2011, Molecular cell, 43, 613, 10.1016/j.molcel.2011.06.022 · DOI
  17. Lee, 2009, Genes & Development, 23, 2639, 10.1101/gad.1837609 · DOI · Paper page
  18. 2014, FEBS Letters, 588, 4297, 10.1016/j.febslet.2014.09.001 · DOI · Paper page
  19. 2013, 10, 1798, 10.4161/rna.27177 · DOI
  20. 2014, 6, 37
  21. 2013, BMC genomics [electronic resource], 14, 298, 10.1186/1471-2164-14-298 · DOI
  22. 2014, PNAS, 111, 11151, 10.1073/pnas.1401724111 · DOI · Paper page
  23. 2013, Physiological Genomics, 45, 990, 10.1152/physiolgenomics.00129.2013 · DOI
  24. 2014, Nucleic Acids Research, 42, 7290, 10.1093/nar/gku347 · DOI
  25. Barnes, 1979, Nature, 281, 388, 10.1038/281388a0 · DOI
  26. Langmead, 2009, Genome biology, 10, R25, 10.1186/gb-2009-10-3-r25 · DOI · Paper page
  27. 2014, Nucleic Acids Research, 42, D68, 10.1093/nar/gkt1181 · DOI · Paper page
  28. Chen, 2005, Nucleic Acids Research, 33, e179, 10.1093/nar/gni178 · DOI
  29. 2013, RNA, 19, 1864, 10.1261/rna.040501.113 · DOI
  30. 2013, PNAS, 110, 7312, 10.1073/pnas.1220998110 · DOI · Paper page
  31. 2013, Methods in molecular biology (Clifton, N.J.), 1024, 97, 10.1007/978-1-62703-453-1_8 · DOI
  32. 2014, Cancer cell, 26, 707, 10.1016/j.ccell.2014.09.005 · DOI
  33. 2014, J EXTRACELL VESICLES, 3, 25011, 10.3402/jev.v3.25011 · DOI
  34. Persson, 2009, Nature Cell Biology, 11, 1268, 10.1038/ncb1972 · DOI
  35. 2004, Nucleic Acids Research, 33, e179
  36. 2014, 9, e89237, 10.1371/journal.pone.0089237 · DOI
  37. Nicolas, 2012, FEBS Letters, 586, 1226, 10.1016/j.febslet.2012.03.026 · DOI
  38. 2009, The Journal of Cell Biology, 185, 35, 10.1083/jcb.200811106 · DOI
  39. 2010, Journal of Biological Chemistry, 285, 10959, 10.1074/jbc.M109.077560 · DOI · Paper page
  40. Fu, 2009, FEBS Letters, 583, 437, 10.1016/j.febslet.2008.12.043 · DOI
  41. 2014, Clinical Chemistry, 61, 56
  42. Duttagupta, 2011, 6, e20769, 10.1371/journal.pone.0020769 · DOI
  43. 2013, 8, e57841, 10.1371/journal.pone.0057841 · DOI
  44. 2014, 9, e110314, 10.1371/journal.pone.0110314 · DOI
  45. Anders, 2010, Genome biology, 11, R106, 10.1186/gb-2010-11-10-r106 · DOI · Paper page
  46. 2014, RNA, 20, 754, 10.1261/rna.044263.114 · DOI
  47. 2014, 8, 1432, 10.1016/j.celrep.2014.07.035 · DOI · Paper page
  48. Wu, 2012, 10, 42, 10.1186/1479-5876-10-42 · DOI
  49. Skorupa, 2012, Journal of Neuroscience, 32, 5024, 10.1523/JNEUROSCI.6366-11.2012 · DOI
  50. 2014, Parasitology research, 113, 285, 10.1007/s00436-013-3655-1 · DOI
  51. 2011, Molecular cell, 43, 613, 10.1016/j.molcel.2011.06.022 · DOI
  52. 2014, RNA, 20, 1715, 10.1261/rna.047241.114 · DOI

Cited by

Sorted by citations

Metadata

Authors
Tosar, J. P., Gambaro, F., Sanguinetti, J., Bonilla, B., Witwer, K. W., & Cayota, A.
Venue
Nucleic Acids Research
Published
2015-05-04
Volume
43
Issue
11
Pages
5601-5616
ISSN
  • 0305-1048
  • 1362-4962
Cited by
224
References
1
Language
en

About these checks

Registry, retraction, Cites and statistics results are computed, not judged, with one exception: a printed reference that no index lists is read once by a model before it counts as a citation error. Claims are extracted by a model and kept only when their quote appears verbatim in the text; each cited source is then checked, with a model’s help, for whether it says what the claim relies on. Those verdicts can be wrong — read the claim’s quote and the cited source before relying on one.

Statistics and arithmetic are recomputed, not judged.

Confidence bands are shown only for fields calibrated on our annotated test set. None is calibrated yet, so no band is shown.

What counts as a claim ›How we measure confidence ›How we check this ›

Are you an author, or do you see a problem with this page? Request a review